Transcription
NATIONALCENTERFor TATISTICSHEALTHSURVEYCharacteristicsin Institutionsof Residentsfor the agedand chronically illUnitedStates- April- June1963Statisticson age, sex, color, length of stay, and se lected health characteristicsof residents in institu tionsforthe aged and chronicallyill. Based on datacollectedfrom institutionsduring the period AprilJune ies122I NumberWELFAREPublicHealthServiceLutherL. TerrySurgeonGeneral
.t,.fPublic Health Service Publication No. 1000.Series 12-No. 2For sale by the Superintendent of Documents, U.S. Government Printing oflieeWashington, D.C., 20402 - Price 40 cenb
NATIONALCENTER FOR HEALTHFORREST E. LINDER,STATISTICSPH. D., DiwctorTHEODORE D.WOOLSEY, DeputyDirectorOSWALD K. SAGEN, PH.D., ArrirtanlDirectorWALT R. SIMMONS, M.A., StatisiicalAdvisorALICE M.WATERHOUSE,M.D., MedicalAdvisorJAMES E. KELLY,D.D.S., Dental AdvirorLOUIS R.STOLCIS,M.A., Executive OficerDIVISION OF HEALTHRECORDSSTATISTICSMONROEG. SIRKEN,PH.D., C&fPublicYealthServiceLibrary of CongressPublicationCatalogNo.1000.Series12.No.Card Number 65-615472
CONTENTSPageInf-r NursingandpersonalDescriptionofCareofData- ----------Personal Characteristicsof Residents-------------------------------Age, Sex, and Color -- - - - ------------------------Lengthof ----Health Characteristicsof Residents - - ---- ---- ------------------- - - -- -----------------Age and Sex--------------Characteristicsof HomesLong-StayGeriatricDescriptionofPersonaland Chronic"Hospitals"Disease f-patients-- -- --------------Sex, and Color - -- -- - --- -------------------------Lengthof ----Health Characteristicsof patients --- ---------AppendixI. TechnicalBackground&signofofGeneral3939394142Notes on Survey Design and yofEstimatesAppendix II. Definitions of Certain Terms1. Terms Relating to Home, “Hospital,”11.16DemographicTermsUsed in This Report-----------or Resident--------------------- ----Appendix III.Classificationof Homes ProvidingAppendixQuestionnairefor Resident Places Survey-l-----------------IV.- - ---Nursing and Personal Care---4646474850
IN THIS REPORTnational informationabout the health and relatedcharacteristicsof residents OYpatients in institutions for the aged andchronically ill in the United States is provided for the fkst time. Datapresented ivz this report were collectedduring April-June1963 and ayebased on a probabilitysample of about 37,000 residents of institutionssuch as nursing homes, homes for the aged, and hospitals which spe cialize in the long-termcaye of the aged OY chronically ill. Statisticsaye presented on age, sex, color, length of stay, and selected healthcharacteristicsof residents in these institutions.Based on estimates derived from this survey, there weye about 505,000residents in 16,370 homes providing nursing and personal care to theagedand chronically ill. In addition, there were about 77,000 patients in728 chronic disease and geriatrichospitals.Approximatelycave homesforwas 77.6 years.Only 4 percent.70 percent of the residents in the nursing and personalthe aged weYe at least 75 years of age. The average ageApproximately66 percent of the residents were women.of the residents in the homes weye nonwhite.Patients in the geriatricand chronic disease hospitals weye primarilyelderly peysons, but, on the average, they were younger than the resi dents in nursing homes. Nine percent of the patients in these hospitalswere nonwhite. This is aboz& the same as the proportion for the totalcivilian population 20 years of age and over which is nonwhite.The average duration of stay of residents in these homes as well as the“hospitals,” from the date of last admission to the institution to the dateof the survey, was 3 years.The health status of residents in homes for the aged was related to theirage as well as to the type of ownership and primary type of service pro vided by the home. Disability in terms of ambulation, continence, mentalawareness, hearing, and vision increased with advancing age of the resi dents. Residents in proprietaryhomes had poorer health than those inthe nonprofit and government-ownedhomes. Also, residents in homesproviding nursing caYe as their primary and predominant @netion hadpoorer health than those in homes providing routine personal servicesonly.SYMBOLSData not available-- - roQuantity more than 0 but less than0.05---Figure does not meet standards ofreliabilityorprecision------------------.0.0*
CHARACTERISTICS OF RESIDENTSIN INSTITUTIONSFOR THE AGED AND CHRONICALLY ILLGoolooS. Wunderlich,Ph.D., DivisionINTRODUCTIONThis report presents findings from the firstof a series of institutionalpopulation surveys.The institutionalpopulation surveys within theDivision of Health Records Statistics are a partof the National Health Survey program, whichobtains information about the health of the UnitedStates population.’Institutions included within the scope of thesesurveys cover a wide variety of facilities whichare in business to provide medical, nursing,per sonal, domiciliary,or custodial care to groups ofunrelated individuals who have no usual place ofresidence elsewhere. These establishmentsin clude institutionssuch as long-stay hospitals,nursing homes, homes for the aged, homes forincurables, homes for the blind and deaf, homesfor crippled children, orphan asylums, homes fordependent children, detention homes for juveniledelinquents,prisons,reformatories,and peni tentiaries.Because of the heterogeneity of thesevarious institutions statistics on the institutionalpopulation are being collected in a series of adIzoc surveys of specific types of institutions. Thisprocedure enables collection of statistics whichare problem oriented to the specific type of in stitution surveyed; it also provides more generalpurpose data related to the total institutionalpopulation.The first such survey, referredto in thisreport as the Resident Places Survey-l, coveredestablishmentsprovidingnursing and personalcare to the aged, infirm.and chronicallyill.of Health RecordsStatisticsThese include nursing homes, convalescent homes,homes for the aged, geriatric and chronic diseaseand nursing home units and chronichospitals,disease wards of general hospitals.Althoughchronic disease wards and possibly some of thenursing home units are not usually considered asinstitutionsbut as integral parts of short-stayhospitals, they were included in the survey because of the type of care provided and are con sidered in this report as institutions. The decisionto survey this particularsegment of the institu tions first was influenced by the current interestin the health of the aged and chronically ill, manyof whom are being cared for in resident institu tions. Data are needed on the characteristicsofresidents of these institutions,the types of serv ices provided, and the characteristicsof the staffemployed.Several local and State surveys of nursinghomes and related facilities have been conductedduring recent years in the United States.” Theonly survey that extended beyond the boundariesof a single State was the survey of nursing homesand related facilities conducted in 13 States dur ing 1953 and 1954, following a design suggestedby the Commissionon Chronic Illness.” Hence,the statisticsderived from the Resident PlacesSurvey- 1 should provide for the first time nationalinformationof this nature about residentsinnursing homes and related facilities.This report describes the personal and healthcharacteristicsof residents in institutions for theaged and chronicallyill. The discussion of thedata is divided into two main sections. The first1
section deals with “nursing and personal carehomes ,‘I which include nursing homes, convales cent homes, and other homes for the aged pro viding nursing or personal care to the residentsThe second section deals with long-stay geriatricand chronic disease hospitals, which also includenursing home units and chronic disease wards ofgeneral hospitals.SOURCESQUALIFICATIONSANDOFDATAThe data presented in this report are basedon the Resident Places Survey-l,conducted bythe National Center for Health Statistics duringApril-June1963. This survey was conducted bymail except for institutionswith 300 or morebeds, where data were collected by personalvisits. This report is based on data obtained froma probability sample of 3,178 nursing or personalcare homes for the aged, geriatricand chronicdisease hospitals,and nursing home units andchronic disease wards of general hospitals. Eventhough long-stay psychiatric hospitals were alsoincluded in the scope of the survey, data for thesehospitals are not included in this report. Althoughinstitutionswithin the scope of this survey areby no means homogeneous, they all are engagedin caring for the aged or chronically ill population.Resident institutionswhich provide care pri ,marily to children,those homes for the agedwhich maintain less than three beds, and homeswhich provide room and board only were notwithin the scope of the survey.The universe from which the sample wasselected is the Master Facility Inventory.4 ThisInventory is composed of a comprehensivelistof institutionsand hospitals in the United Statesand serves as a sampling frame for institutionswithin the scope of the various InstitutionalPop ulation Surveys. Preliminaryevaluation of theMaster Facility Inventory indicates approximately85-90 percent completeness in the listing of nurs ing homes and related facilities which are coveredin the Resident Places Survey-l. Hence, statis tics presented in this report should be inter preted with caution, as any incompleteness in theMaster Facility Inventory is necessarily reflectedin the sample.’ A descriptionof the sample design of thesurvey, estimation techniques, and general qual ificationsof the data obtained in the survey isgiven in Appendix I. Statistics shown in this reportare estimates based on a sample and are therefore subject to sampling errors. Although thesampling errors for most of the estimates arerelativelylow, the error may be high when thepopulation on which a percentage is based issmall. Tables and a chart of relative standarderrors and instructionsfor use of these tablesand chart are also presented in Appendix I.In addition to sampling errors the reportedsurvey data are subject to measurement errors.In an attempt to keep such errors to a minimum,the questionnairewas made as self-explanatoryas possible, i.e., definitionsand explanationswere included as part of each question. Definitionsof certain terms used in this report are presentedin Appendix II.In the absence of any commonly accepteddefinitions of nursing home, convalescent home,or the other institutionsof this type, criteriawere developed by the National Center for HealthStatistics which could be used to classify an in stitutionaccording to the predominant type ofservice provided.These criteriaand the pro cedures used to develop them are described inAppendix III.A facsimile of the questionnaire used for theSurvey is shown in Appendix IV.NURSINGPERSONALDescriptionANDCAREofHOMESHomesIn order to better understand the character istics of residents of homes providing nursingand personal care to the aged, a brief descrip tion of these homes may be helpfuL5Data collected in the Resident Places Sur vey-lindicated an estimated 505,242 residentsin about 16,370 nursing and personal care homesin the United States (table 1). Eighty-two percentof these homes were proprietary,that is, theywere privatelyowned and operated. However,they accounted for only 61 percent of the residents,implyingthat proprietaryhomes were smaller
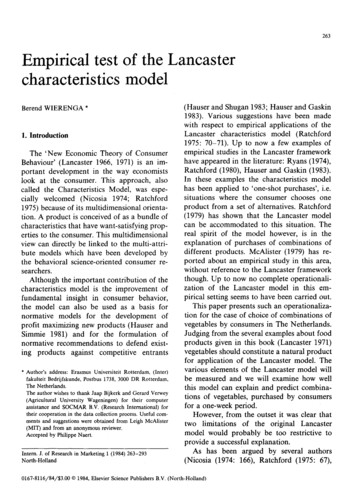
than those operated under other types of ownership. This latter group includes homes operatedby nonprofit organizations and homes operatedby State, local, or Federal Government. Twelvepercent of the homes were operated by nonprofitorganizations, and the remaining 6 percent wereoperated by State, local, or Federal Government.Forty-eight percent of the total homes wereclassified as nursing care homes, that is, theyprovided nursing care as their primary type ofservice. Thirty percent were personal-care-withnursing homes, that is, they were primarily per sonal care homes with some nursing servicesprovided. The remaining 22 percent providedroutine personal care only. The nursing carehomes and the personal-care-with-nursing homeswere similar in size, averaging 40 and 39 beds,respectively. Personal care homes, however,were much smaller, with an average of 16 bedsper home. Almost 95 percent of the homes main tained less than 100 beds; 64 percent of thesemaintained less than 30 beds. The proprietaryhomes had, on the average, 26 beds and 23 resi dents per home. Comparable figures for nonprof it homes were 65 beds and 59 residents; andfor government homes, 96 beds and 81 residents.TableAs shown in table A, the government homeswere much larger than the homes operated undernqnprofit and proprietary ownerships regardlessof the type of service grovided.PersonalCharacteristicsofResidentsThe residents in nursing and personal carehomes are identified and classified by age, sex,color, and length of stay in these institutions.Age,Sex,andColorNursing and personal care homes are predominantly institutions for the care of the elderlypopulation. This fact is supported by the agedistribution of residents in these institutions(table 2). Approximately 12 percent of the esti mated 505,242 residents were under 65 years ofage, and as little as 2 percent wereunder 45 yearsof age. At the other extreme 70 percent of theresidents were 75 years and older. The averageage of the residents was 77.6 years.‘Ikis selectivity in age becomes more ap parent when considered in relation to the agedistribution of the total civilian population. AsA. Average number of beds and residentsin nursingtype of ownershipand primarytype of service:Unitedand personalcareStates,April-Junehomes,1963byType of nprofitGovernmentAverage number of --------care-------------------------care with ----------------------care -------------------------care with 11.371.268.923.3112.573.326.93
shown in table B, almost 5 out of every 1,000persons 20 years and over were residents innursingand personal care homes. This rateincreased sharply with increasing age. hess than1 out of every 1,000 persons 20 to 65 years ofage was in these homes compared with morethan 148 per 1,000 persons 85 years of age andolder.About 66 percent of the estimated 505,242residentswere women (table C). There weremore men than women residents under 65 yearsof age. However, after 65 years this ratio wasreversed,with twice as many women as men.Tablein nursingB. Number of residents20 years and over, by age, color,The average age was 79 years for females and75 years for males. This sex difference in theresident population reflectsthe sex differenceobserved in the older ages in the total population.However, as shown in table B, this is not the onlyfactor accounting for the larger proportion ofwomen in nursing and personal care homes. Thenumber of residents in homes for the aged per1,000 persons 65 years and older was much largerfor females than for males in each of the agegroups shown. Moreover,the differencesincreased very sharply with advancing age.and personalcare homes per 1,000 populationand sex: United eFemaleTotalMaleNumber perAll ages20 years--4.520-64 years----65-74 years----75-84 years----85 85: 8FemaleMaleTotal0.52512:440.41E42:9iiTableAagesll - - C.Percentdistributionof residentssex, and color:UnitedAgeof nursingand --Whiteage,Nonwhitedistribution66Under 65 years-------------------------65-74 years----------------------------75-84 years --- - ----------------------8% 0622462;7379.177.969.7
Only 4 percent of the residents in nursingand personalcare homes, compared with 10percent in the total population, were nonwhite.The nonwhite resident population was youngerthan the white. The estimated average age wasalmost 70 years for the nonwhite and 78 yearsfor the white resident population. The propor tion of nonwhite persons decreased with increasing age. Whereas 10 percent of the resi dents under 65 years of age were nonwhite,only 2 percent of the residents85 years andolder were nonwhite (table C). This color dif ference in older ages is a function not only ofdifferentiallongevity but also of differentialrateof residence in homes for the aged. As shown intable B, relative to the total population 65 yearsand older the proportionof nonwhite persons innursingand personalcare homes was muchsmaller than the proportionof white persons ineach age group shown, and the differencesbecame progressivelygreater with age.As 96 percent of the residents were white,informationon the sex compositionof the totalresident population discussed earlier essentiallyreflects the sex compositionof the white resi dent population. The nonwhite resident populationwas comprisedalmost equally of females andmales, while the ratio of females to males amongthe white residents was 2 to 1.A larger proportionof the residents in theSouth Region were under 65 years of age thanthose in the North Central, Northeast, and WestRegions (table 3). The North Central Region hadmore white residents in homes per 1,000 whitepersons than any of the other regions (table D).This rate of residencefor white persons waslowest in homes in the South Region. For nonwhite persons homes in the Northeasthad ahigherrate of residenceper 1,000 nonwhitepersons than any of the other regions. The num ber of nonwhite residentsper 1,000 nonwhitepersons in homes located in the South, West, anddistributionof residentsand number of residentsper 1,000 popula Table D. Percentand personalcare homes, by colorand geographiction 20 years and over in nursingregion : United States,April-June1963GeographicNumber -- ---------------------------North Central --------------- ---------------------------------West ----------- ----------- bution100 v1003019,84010023Z?1;14E;;11Number per ---------------------North Central ----- 4.65.2-i-4.91.824;I:“;2::::;NOTE: Populationaged 20 years and over used to computeratiosshown in the abovetable obtainedfrom U.S. Bureau of the Census, U.S. Census of nitedStates Summary, FinalReport PC (I)-lB,U.S. Govern ment PrmtlngOfrice,Washington,1961.5
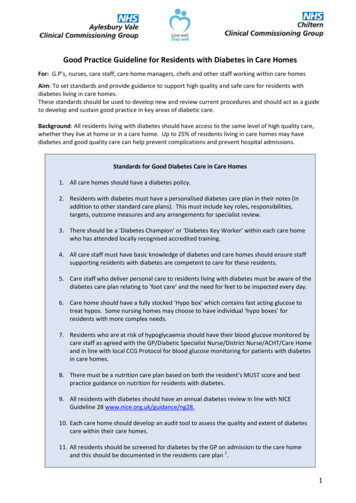
North Central Regions was about the same. Itshould be noted that the 50 percent of nonwhiteresidents in homes in the South essentially re flects the concentrationof the nonwhite popula tion in this region. Approximately53 percent ofthe nonwhite population in the United States is inthe South Region.Among the three ownership groups shown intable 4, the nonprofit homes had a much largerproportion of residents 75 years of age and olderthan the proprietaryand government homes. Inthe nonprofit homes 5 percent of the residentswere under 65 years of age, and as many as81 percent were 75 years and older; the govern ment-operated homes had 27 percent of the resi dents under 65 years of age and only 52 percent75 years and older. Comparable figures for pro prietary homes are 11 percent and 71 percent.The government homes also had a much largerproportionof men than the proprietaryand nonprofit institutions.While the ratio of femalesto males in proprietaryhomes was 2 to 1 and inthe nonprofit homes almost 3 to 1, it was com pletely reversed in the government homes, wheremore than 50 percent of the residents were men.The large domiciliarycare units of the VeteransAdministrationincluded in the homes operatedunder governmentauspices contributed largelyto this difference.Residentsin personalcare homes wereyounger than those in homes providing nursingservices (table 5). Ten percent of the residentsin nursing care homes, compared with 18 per-TableE.Average length of stay ofand sizetype of ownershipcent in the personal care homes, were under65 years of age. This pattern was also apparentamong both male and female residents. However, when white and nonwhite persons wereconsidered separately, this pattern did not holdin the nonwhite resident population.LengthofStayThe length of stay of residents innursingandpersonal care homes discussed in this report re fers to the time intervalbetween the date oflast admission to the home and the date of thesurvey in that home. Therefore,length-of-staystatisticspresented in this report do not repre sent the total length of stay in these homes forthe aged and only the most recent stay for persons with multiple admissions.Tables 6 and 7 show the distributionof resi dents by length of stay classified, respectively,according to type of ownership and primary typeof service provided by the homes. Almost 35 percent of the residents had been in the home lessthan 1 year, and only 5 percent had stayed aslong as 10 or more years.The estimated average length of stay sincetheir last admission to the home was 3 years.Residents in proprietaryhomes had the shortestlength of stay, an average of 2.3 years as cornpared with 4.4 years in government homes ana4.2 years in nonprofit homes (table E).As shown in table 6, 40 percent of the resi dents in proprietaryhomes had spent less thanresidentsin nursingand personalof home: UnitedStates,April-Junecare homes,1963byType of ownershipSizeof --------Under 30 beds------------------------30-99 beds---------------------------100-299 beds-------------------------300 entin years3.02.34.24.4;:;2.34.12::2::222:72-z4:8t::.
1 year in the home. A long stay of 10 or moreyears is relativelyinfrequentin proprietaryhomes. Only 2 percent of the residents in thesehomes, compared with 10 percent in thenonprofithomes and 12 percent in the government-operatedhomes, had stayed that long.The variation noted in length of stay of resi dents according to size of the homes is more areflectionof the differencesby type of ownership than by size because of the close relationship between the size and the type of ownership of the homes. The average length of stayfor residents in homes maintaining 300 or morebeds was 4.6 years as compared with only 2.5years in homes with less than 30 beds. However, when the homes were further classified bytype of ownership, no real differencesby sizeof the homes were observed.The length of stay also varied by the pri mary type of service provided by the home(table 7). Residents in nursing care homes hadthe shortest length of stay, an average of 2.5years as compared with 3.4 years in personalcare homes and 3.8 years inpersonal-care-with nursing homes (table F).Table 8 shows the distributionof residentsby length of stay classified according to sex andage. There was some evidence that women stayedin nursing and personal care homes for aslightlylonger period of time than men, an average of3.1 years compared with 2.8 years. When malesand females were further classified by age, nosex differences were observed among residentsunder 85 years of age. However, females 85 yearsTableofF. Average lengthprimarytype of serviceand older stayed in these homes longer thanmales in the same age group.Several factors should be kept in mind wheninterpretingthe data on length of stay of resi dents in the various institutions.Length of stayas presented in this report is affected by thelength of time these institutionshave existed.Proprietaryhomes are probably newer than nonprofit and government-operatedhomes, so theaverage length of stay of residents in the pro prietary homes tends to be shorter. The cost ofcare to the resident, combined with the possibletendency to “shop around,” may also account forthe shorter length of stay in proprietaryhomes.HealthCharacteristicstypeofstay ofresidentsin nursingand geographicregion:Unitedand personal care homes, lPersonalregionserviceAllregionsAllResidentsThe health characteristicsof residents innursing and personal care homes are discussedin terms of ambulation, mental awareness, con tinence, hearing, and vision. The residents areclassifiedin 1 of 3 categories according to extent of disability-none,partial, or complete-ineach of these health characteristics(see AppendixII). These health characteristicsare then relatedto the age and sex of the residents and to selectedcharacteristicsof the homes.Of the estimated 505,242 persons in nursingand personal care homes about 57 percent wereout of bed except for normal rest or sleep, andabout as many were able to walk alone or with acane or crutch. Approximatelythree-fourthsofthe total residents were continent, i.e., had con trol of their bladder and bowels, and half ofGeographicPrimaryofNorthCentralSouthWestin yearstypes -- ------ ----------care ------------------------------care with nursing---------------care ------------------ - 3?jq qq7
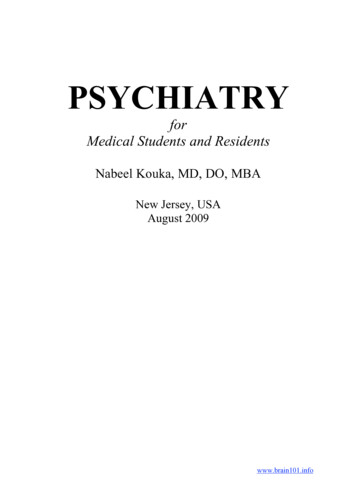
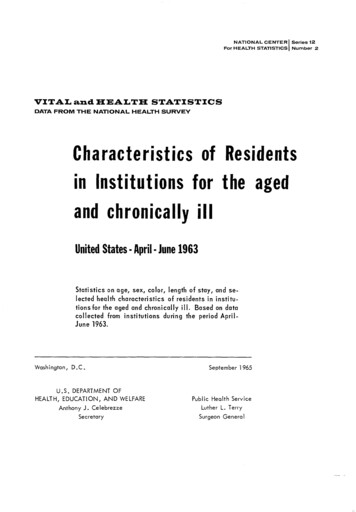
Incontinence and mental confusion observedamong the older persons is commonly the resultof senility and other usual processes of aging.However, the incontinence and mental confusionreported for over 10 percent of the persons under65 years of age suggests that in these personsthese disabilitiesare more likely the result ofstroke or other related diseases requiring longterm care.Eleven to 20 percent of the residents under6.5 years of age had “complete” disability in oneor more of the health characteristicsshown infigure 1. Although these homes are predominantlyhomes for the care of the aged, a substantial percent of residents under 65 years of age with a dis abling condition suggests that disability, regardless of age, is a crucial factor in the decision .tothe residents were always mentally aware of theirsurroundings.Four-fifthsof the residents had noserious problems with hearing or vision.AgeandSexTable 9 shows the percent distributionofresidentsby extent of disabilityin selectedhealth characteristicsaccording to age and sex.Among the age groups shown, both physicaland mental disabilityincreased with advancingage of the residents.The proportionof resi dents. who were disabled was lower among thoseunder 65 years of age than among those 85 yearsand older. These differencesranged from 14 to21 percent among the various health characteris tics 100II-A 75-65-74No disabilityFigureI.Percentdistributionof residentsin .;.::qe;;Complete.disabilityin nursingand personalcarecharacteristicsaccordingtohomes,age.by extentofdisability
enter a nursing home. One possible explanationmay be that younger persons are more likelythan older persons to be in a nursing or personalcare home because of a severe or long-term dis ability that cannot becaredfor at home by mem bers of the family. Older persons, on the otherhand, may enter such a home because of generalinfirmity accompanying old age and because ofthe difficulties of living alone at an advancedage.Although the proportion of residents withhearing and vision problems also increased withage, it probably reflects the normal audiovisualchanges associated with aging. Approximately 94percent of the residents under 65 years of agehad no problems with hearing. This proportiondropped to 74 percent for those 85 years and older.The same pattern was noted in their ability tosee. Almost 90 percent of those under 65 yearshad no serious problem with vision, 8 percenthad serious problems, and 3 percent were blind.However, among residents 85 years and olderonly 72 percent had no problems with vision,24 percent were reported to have serious prob lems, and 5 percent were blind.With the exception of hearing and visionstatus the proportion of disabled persons waslarger for females than for males; this patternprevailed throughout all age groups shown. However, except in the age groups under 65 yearsand 85 years and older the differences weresmall. Among residents under 65 years thesesexdifferences ranged from 8 to 15 percent amongthe
incurables, homes for the blind and deaf, homes for crippled children, orphan asylums, homes for dependent children, detention homes for juvenile delinquents, prisons, reformatories, and peni tentiaries. Because of the heterogeneity of t