Transcription
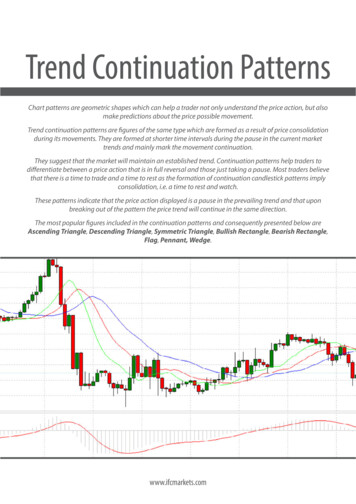
Trend Continuation PatternsChart patterns are geometric shapes which can help a trader not only understand the price action, but alsomake predictions about the price possible movement.Trend continuation patterns are figures of the same type which are formed as a result of price consolidationduring its movements. They are formed at shorter time intervals during the pause in the current markettrends and mainly mark the movement continuation.They suggest that the market will maintain an established trend. Continuation patterns help traders todifferentiate between a price action that is in full reversal and those just taking a pause. Most traders believethat there is a time to trade and a time to rest as the formation of continuation candlestick patterns implyconsolidation, i.e. a time to rest and watch.These patterns indicate that the price action displayed is a pause in the prevailing trend and that uponbreaking out of the pattern the price trend will continue in the same direction.The most popular figures included in the continuation patterns and consequently presented below areAscending Triangle, Descending Triangle, Symmetric Triangle, Bullish Rectangle, Bearish Rectangle,Flag, Pennant, Wedge.www.ifcmarkets.com
Ascending TriangleAscending triangle represents a trend continuation pattern which is formed in an uptrendserving as a confirmation of existing direction.It displays a narrowing range between high andlow prices which visually form a triangle.The ascending triangle is characterized by ahorizontal trendline called resistance and anascending trendline called support. The formerconnects the price highs arranged at the samelevel and the latter connects price higher andhigher lows.Price break above the resistance line usually somewhere between halfway and ¾ length of the pattern indicatesa signal to buy.How to calculateT R H,Where:T – target price;R – resistance (horizontal line);H – pattern’s height (distance between support and resistance lines at pattern’s origin).www.ifcmarkets.comClick here to share
Descending TriangleDescending triangle represents a trend continuation pattern which is formed in a downtrendserving as a confirmation of existing direction.It displays a narrowing range between high andlow prices which visually form a triangle.The descending triangle is characterized by adescending trendline called resistance and ahorizontal trendline called support. The first oneconnects lower and lower highs and the secondone connects price lows arranged at almost thesame level.Price break below the support line usually somewhere between halfway and ¾ length of the pattern indicates asignal to buy.How to calculateT S – H,Where:T – target price;S – support (horizontal line);H – pattern’s height (distance between support and resistance lines at pattern’s origin).www.ifcmarkets.comClick here to share
Symmetric TriangleSymmetric triangle represents a trend continuation pattern which can similarly be formedboth in an uptrend and a downtrend. Trenddirection is confirmed when appearing on thechart.The main feature of symmetric triangle is thatthe latter displays a narrowing range betweenhigh and low prices thus visually forming a triangle. It is formed of a descending trendline,called resistance, and an ascending trendline,called support. The former connects lower andlower highs and the latter connects higher and higher lows of price. Price break is a crucial factor in confirmingthe direction of trend movement: If the triangle is formed in a downtrend the price break below the support line will indicate a signal to sell. If the triangle is formed in an uptrend the price break above the resistance line will indicate a signal to buy.How to calculateIn case of an uptrend:T BL HIn case of a downtrend:T BL – HWhere:T – target price;BL – breakthrough level (point where the price leaves the triangle);H – pattern’s height (distance between support and resistance lines at pattern’s origin).www.ifcmarkets.comClick here to share
Bullish RectangleBullish rectangle pattern is a trend continuationpattern which is usually formed in an uptrendand signals the trend’s direction. It is characterized by support and resistance levels whichconnect recent highs and lows of the price.If the price rises above the resistance line a buysignal appears.How to calculateT R H,Where:T – target price;R – resistance level (pattern’s top);H – pattern’s height (distance between support and resistance).www.ifcmarkets.comClick here to share
Bearish RectangleBearish rectangle pattern is a trend continuation pattern which is usually formed in adowntrend and signals the trend’s direction. Itis characterized by support and resistance levels which connect recent lows and highs of theprice.If the price falls below the support line a sell signal appears.How to calculateT S – H,Where:T – target price;S – support level (pattern’s low);H – pattern’s height (distance between support and resistance).www.ifcmarkets.comClick here to share
Forex FlagFlag is a minor and short-term trend continuation pattern indicating the previous directionwhich will prevail after its formation.Flag is formed within a week. It comprises twotrendlines: support and resistance levels, whichrepresent the range between high and low prices, visually forming a parallelogram or a flag.The formation of the given pattern implies thatthe price may change at the same direction asit was going prior to the pattern. This patterndetermines the direction of trend movementby price breaking: If in a downtrend the price falls below the support line a sell signal arises. If in an uptrend the price rises above the resistance line a buy signal arises.How to calculateIn case of a downtrend:T BP – (TS – PS)In case of an uptrend:T BP (PS – TS)Where:T – target price;BP – breakthrough point;TS – trend start point;PS – pattern start point.www.ifcmarkets.comClick here to share
PennantPennant is a minor and short-term trend continuation pattern indicating the previous direction which will prevail after its formation.Pennant is formed within a week. It comprisestwo converging trendlines: support (upwardsloping) and resistance (downward sloping)which visually form a triangle. The formationof the given pattern implies that the price maychange at the same direction as it was goingprior to the pattern.This pattern determines the direction of trendmovement by price breaking: If in a downtrend the price falls below the support line a sell signal arises. If in an uptrend the price rises above the resistance line a buy signal arises.How to calculateIn case of a downtrend:T BP – (TS – PS)In case of an uptrend:T BP (PS – TS)Where:T – target price;BP – breakthrough point;TS – trend start point;PS – pattern start point.www.ifcmarkets.comClick here to share
WedgeWedge is a minor and short-term trend continuation pattern indicating the previous directionwhich will prevail after its formation.Wedge is formed within a week. It comprisestwo trendlines: support and resistance levels which visually form a triangle. Both of thetrendlines can be either downward sloping (inan uptrend) or upward sloping (in a downtrend)against the direction of the primary trend. Theformation of the given pattern implies that theprice may change at the same direction as itwas going prior to the pattern. This pattern determines the direction of trend movement by price breaking: If in a downtrend the price falls below the support line a sell signal arises. If in an uptrend the price rises above the resistance line a buy signal arises.How to calculateIn case of a downtrend:T BP – (TS – PS)In case of an uptrend:T BP (PS – TS)Where:T – target price;BP – breakthrough point;TS – trend start point;PS – pattern start point.www.ifcmarkets.comClick here to share
ConclusionNote that the signal is accepted to be complete when the pattern is fully formed and the price breaks the pattern in a specific manner. Continuation patterns are considered the mostaccurate when the trend has existed for one to three monthsand you have an opportunity to spot patterns in all timeframes (30 minutes, one hour, even daily and weekly charts).www.ifcmarkets.com
Forex Flag Flag is a minor and short-term trend continu-ation pattern indicating the previous direction which will prevail after its formation. Flag is formed within a week. It comprises two trendlines: support and resistance levels, which represent the range between high and l