Transcription
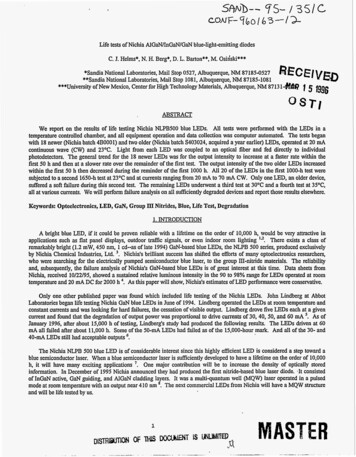
Life tests of Nichia AlGaN/InGaN/GaN blue-light-emitting diodesC. J. Helms*, N. H. Berg*, D. L. Barton**, M. Osidski***RECEIVED*Sandia National Laboratories, Mail Stop 0527, Albuquerque, NM 87185-0527**Sandia National Laboratories, Mail Stop 1081, Albuquerque, NM 87185-1081***University of New Mexico, Center for High Technology Materials, Albuquerque, NM 8713 I-&!&@1 5 1996ABSTRACTWe report on the results of life testing Nichia NLPB500 blue LEDs. All tests were performed with the LEDs in atemperature controlled chamber, and all equipment operation and data collection was computer automated. The tests beganwith 18 newer (Niclua batch 4B0001) and two older (Nichia batch S403024, acquired a year earlier) LEDs, operated at 20 mAcontinuous wave (CW) and 23OC. Light from each LED was coupled to an optical fiber and fed directly to individualphotodetectors. The general trend for the 18 newer LEDs was for the output intensity to increase at a faster rate within thefirst 50 h and then at a slower rate over the remainder of the first test. The output intensity of the two older LEDs increasedwithin the first 50 h then decreased during the reminder of the first 1000 h. All 20 of the LEDs in the first 1000-h test weresubjected to a second 1650-h test at 23OC and at currents ranging from 20 mA to 70 mA CW. Only one LED, an older device,suffered a soft failure during this second test. The remaining LEDs underwent a third test at 3OoCand a fourth test at 35OC,all at various currents. We will perform failure analysis on all sufficiently degraded devices and report those results elsewhere.Keywords: Optoelectronics, LED, GaN, Group IIlNitrides, Blue, Life Test, Degradation1. INTRODUCTIONA bright blue LED, if it could be proven reliable with a lifetime on the order of 10,000 h, would be very attractive inThere exists a class ofapplications such as flat panel displays, outdoor tnffic signals, or even indoor room lightingremarkably bright (1.2 mW, 450 nm, 1 cd--as of late 1994) GaN-based blue LEDs, the NLPB 500 series, produced exclusivelyNichia's brilliant success h a s shifted the efforts of many optoelectronics researchers,by Niclua Chemical Industries, Ltd.who were searching for the electrically pumped semiconductorblue laser, to the group 111-nitride materials. The reliabilityand, subsequently, the failure analysis of Nichia's GaN-based blue LEDs is of great interest at this time. Data sheets fromNichia, received 10/22/95, showed a sustained relative luminous intensity in the 90 to 98% range for LEDs operated at roomtemperature and 20 mA DC for 2000 h As this paper will show, Nichia's estimates of LED performance were conservative.'*.'.'.Only one other published paper was found which included life testing of the Nichia LEDs. John Lindberg at AbbotLaboratories began life testing Nichia GaN blue LEDs in June of 1994. Lindberg operated the LEDs at room temperature andconstant currents and was looking for hard failures, the cessation of visible output. Lindberg drove five LEDs each at a givencurrent and found that the degradation of output power was proportional to drive currents of 30,40,50, and 60 mA As ofJanuary 1996, after about 15,000 h of testing, Lindberg's study had produced the following results. The LEDs driven at 60mA all failed after about 11,000 h. Some of the 50-mA LEDs had failed as of the 15,000-hour mark. And all of the 30- and40-mA LEDs still had acceptable outputs '.'.The Niclua NLPB 500 blue LED is of considerable interest since this highly efficient LED is considered a step toward ablue semiconductor laser. When a blue semiconductor laser is sufficiently developed to have a lifetime on the order of 10,000h, it will have many exciting applicationsOne major contribution will be to increase the density of optically storedinformation. In December of 1995 Niclua announced they had produced the first nitride-based blue laser diode. .It consistedof InGaN active, GaN guiding, and AlGaN cladding layers. It was a multiquantum well (MQW) laser operated in a pulsedmode at room temperature with an output near 410 nm '. The nest commercial LEDs from Niclua will have a MQW structureand will be life tested by us.'.
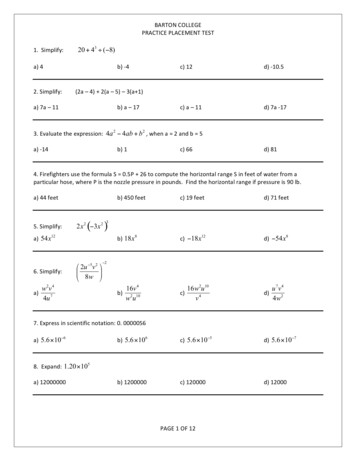
2. GOALS OF PRESENT LIFE TESTINGThe goals of the present life testing included control of the environmental temperature and LED drive current to within afew percent. Another goal was the automated in situ recording of the voltage across each LED and the relative intensity ofeach LED Thus,a meaningfd record of the operating history of the LEDs would be obtained.'.Because the present study varied two parameters, environmental temperature and drive current, it was not our intention topredict or model LED lifetimes Io. Instead, the intent was to produce soft failures (relative intensity reduced to 50% of itsoriginal'value) which left the LEDs operational. Failed LEDs would then undergo extensive failure analysis usingmeasurement techniques such as: I-V characteristics, forward resistance, electron beam induced current (EBIC), transmissionelectron microscopy ("EM), and focused ion beam (FlB)analysis ' I .3. DESIGN OF L E E TESTING SYSTEMA complete, and very expensive, system for life testing LEDs would include the in situ monitoring of output power andlight spectrum for each LED as well as full temperature control of all temperature sensitive components (such as drivecircuitry) in the test. Because of the cost of the required life testing equipment and the time involved, few commercialcompanies are able to e?ctract such exhaustive life test data from their optoelectronic products. Gathering this life testing datawould not be a cost-effective or timely feedback mechanism for improving the manufacturing process of the devices.The present life testing system was designed to control and monitor each LED's voltage, current, and intensity; as well asthe supply voltage, the time data was recorded, and the chamber temperature. Twenty Nichia GaN blue LEDs were tested, 18newer LEDs (Niclua batch 4B0001), purchased in 1995, and two older LEDs (Nichia batch S403024), purchased in 1994.The LEDs were placed electrically in parallel, and failed devices were removed from the test for failure analysis.A block diagram of the life testing system used is shown in Fig. 1. All test control and measurements were fully computerautomated across an IEEE-488 bus. The computer used to automate all tasks was a 66-MHz, 486-based PC-compatiblecomputer, running version 3.12 of Hewlett Packard's HP VEE, an iconic programming language for test and measurement.The current status of the test was constantly visible on the computer's monitor.During the first 1000 h of testing, LED currents were controlled using two methods. An op-amp circuit was designed toprovide constant current to one half of the LEDs even if the LED resistances changed. For comparison, we also designed acircuit based on current limiting resistors, designed to prevent excessive current drain in any one LED. The resistor-basedcircuit relied on the constant voltage from its power supply. In theory, the op-amp circuit was to provide better currentregulation. After the first 1000 h of testing, we found that both designs adequately controlled the drive current. In latersegments of the life testing, where higher drive currents were required, the resistor-based circuit was more easily adapted tohandle the higher currents. The use of a circuit board tlnt supplied approximately constant current to each LED allowed theuse of a single power supply (with an ample maximum current rating) to power all 20 LEDs. The power supply was aKeithley model 238, set up as a constant voltage source, with remote voltage sensing at the current distribution circuit board.All LEDs were operated in a large temperature chamber (a Thermotron, with model 2800 programmer controller). Afiber optic probe was secured to the output end of each LED. A metallic fixture held each fiber-LED pair in a fixedrelationship. The fibers traveled outside the temperature chamber, and each was coupled to a PIN-1OD silicon photodiodeusing a fixture that blocked the ambient light. Three switch banks (Wavetek 500 W l O channel witching system, model601) and two switch controllers (Wavetek switcher control panel, model 603) were used to obtain data from the 20 separatechannels. LED intensity was monitored by recording detector currents (at first with a Keithley model 485 autorangingpicoameter, and later with a Hewlett Packard 4140B picoameter). LED voltage and current were measured with a HewlettPackard model 3478A multimeter. LED voltage was monitored at the LED contacts, while LED current was derived from thevoltage across the 1-!2 resistors on the current distribution board.2,'
1LEDINTENSITYMONITORSWITCH BANK 3LIGHT DETECTORS( FIBER OPTICS )( CURRENT TESTBLUE LED TEST FIXTUREIN TEST OVEN(- CURRENTDISTRIBUTIONBOARDIEEE-488 BUS )Fig. 1. Block diagram of the life testing system used4. MONITORING LED OPTICAL OUTPUTSince only a portion of the LED's output would be monitored during actual testing, a well controlled pre- and post-testpower measurement system was incorporated as a check on the in situ intensity data. The power measurements utilized a 5inch diameter Labsphere optical integrating sphere, a Newport optical power meter model 835, and a Newport detector model818-SL. Forty power readings were taken during a three-minute warm-up of the LED and were computer controlled forconsistent timing between measurements. Power data were recorded as the average of 10 readings.Initially we e.xpected the measurement of the real-time intensity to correlate with pre- and post-test power measurements.We found the two sets of measurements to be in quantitative disagreement, and for good reasons. Real-time intensity datashowed the gradual changes in LED output over long continuous test periods and often revealed warm-up or bum-in periods of50 to 100 14 during which the output intensity would increase. The in situ monitoring of LED intensities also helped avoidcatastrophic failures. Intensities were monitored once per hour for the first 10 11then once each 12 h for the remainder of eachtest. In contrast, the optical power data represented measurements on LEDs running for only a few minutes after a long restperiod, The post-test power readings proved very useful in confirming the degree of degradation in LED which suffered softfailures.3
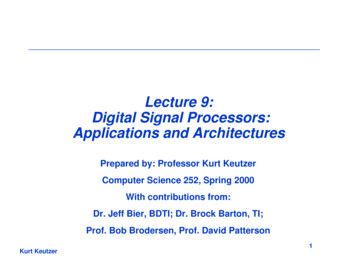
5. TEST CONDITIONSTable 1 shows the parameters used for each of the four phases of the life testing. Forward currents varied from 20 to 70mA, with 20 mA being the rated operating current and 70 mA being a reasonable maximum before a rollsff in outputintensity occurred. Test chamber temperatures ranged from 23 C to 35OC to simulate room temperature and warm ambientoperating temperatures of LEDs in display applications. Temperatures much higher than 35OC were also deemed unnecessarysince constant, gradual degradation in LED output was seen at 3OoC and because soft failures were the aim of this testing.Test duration varied from 500 to 1650 h. Tests 3 and 4 ran for 500 h to represent the time that most LEDs would need toundergo any possible increases in intensity and then stabilize.Test 11000 h2 3 OCNewer(LEDs1 L I1 8 Q 20 m A1Test 21650 h23 CI3 @ 40 m AIImIIrn F -lm/LEDs1II3 Q 70 m A0 lderI:",:Test 3IIIII2 Q 70mA2 Q 70mA1 Q 70 m ASOFT F A I L U R Em1820mAI1Q20mAITable 1. Life test conditions for the four phases of testing6, DISCUSSION OF DATAThe most concise and m e a n i n a l representation of LED performance was given by a graph of relative intensity versuselapsed time. To present the relative changes in an LED's intensity over all of the tests, discontinuities were removed byadjusting intensity data. The discontinuities in the intensity data which were accounted for were:0Temporary rises in temperature to 28 C for 48 11 and to 31 C for 72 11 during Test 1. These rises caused onlytemporary changes (mostly decreases) in the output intensities of the LEDs.0Temporary loss of electrical contact to an LED near the end of Test I.0Known physical misalignment of five LEDs and their fibers when DUT #I9 was removed from Test 2 with testing inprogress.0Some erroneous detector currents for two of tlie LEDs, caused by a failure of a Keitllley 485 autoranging picoameter.The Keitliley 485 was removed from tlie test and replaced.4
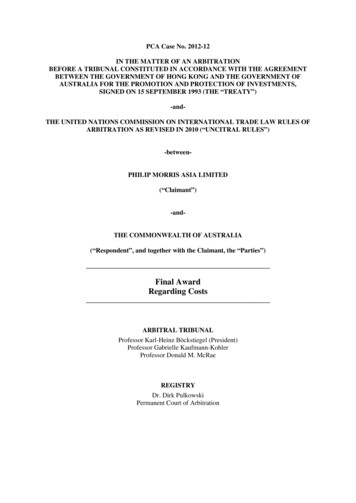
00Discontinuities due to system restarts following two weather related power disruptions.Discontinuities from one test segment (Test 1, 2, etc.) to another.The continuous graph of percentage change in relative intensity values is shown in Fig. 2. The intensity values areaveraged over all LEDs operating under the same conditions (usually three LEDs per group). By refemng to Table 1, thenumber of LEDs used to obtain these average intensities can be seen.o!020 0i0 0000 00L00z00z00Time (h)&00!00s00E0000!i00200!00200 KFig. 2. Percentage change in relative intensity for the LEDs tested, averaged according to drive currentBecause there were typically only three newer LEDs per drive-current group, taking an average of the intensity values didlittle to smooth out the effects of atypical LEDs. There were two specific examples of this. Only one LED out of three in the30-mA group showed an increase in intensity of 10 to 15% over the first 100 to 200 h of Tests 1 through 4. Thus, the LEDWith the unusually high intensity dominated the average of the 30-mA group. The second occurrence of an outlying LEDoccurred during Test 2; one of the three LEDs in tlie 50-mA group did not degrade. These two instances may be the reasonthat the 30-mA data exceeds the 20-mA data and the 50-mA data exceeds the 40-mA data in Fig. 2.In Test 1 the general trend for all LEDs was for output intensity to increase more quickly over the first 50 to 100 h. Thenewer LEDs then continued to slowly increase in intensity, while the older LEDs began to decrease.5%
In Test 2 the LEDs were separated into groups of different drive currents. The older LED at 20 mA continued its gradualdecline in output intensity. The older LED at 70 mA suffered a catastrophic decline in intensity to 50% of its original valueand was removed from Test 2 after about 250 h. The newer LEDs were divided into groups of three, and a group was drivenat 20,30,40,50,60, or 70 mA. The intensity of the newer 20-mA LEDs continued to slowly increase then leveled out at 10%above the initial value. The intensities of the 30-, 40; 50; 60; and 70-mA groups all began to decline, with the decline beingproportional to drive current. This proportionality did not apply to the 50-mA group, which contained one LED of unusuallyhigh intensity.In Test 3 the temperature was increased to 3OOC. The intensity of the older LED, now at 20 mA, showed a slight increase,possibly indicating that a temperature above 23OC had reversed some of the ill effects of Test 1. The newer LEDs at 20 mAmaintained their performance at 10% above their initial average intensity value. Newer LEDs driven above 20 mA continuedto decline in intensity, but at a greater rate than they did during Test 1. The temperature increase to 3OoC appeared to beincreasing the activity of the degradation mechanisms occurring within these LEDs.In Test 4 the temperature was increased to 35 C. The intensity of the older 20-mA LED continued its increase. DuringTest 4 the newer LEDs driven at 20 mA continued to hold an intensity 10% above their initial average value. The newerLEDs at higher currents all continued to decline in intensity, with no noticeable change in slope relative to their performancesat 30 C (as in Test 3).7. CONCLUSIONSSoft failures of NicIua AlGaN/InGaN/GaN blue LEDs were more difficult to produce than expected.These LEDs showed lifetimes well in excess of 4000 h at their recommended operating current of 20 mA. A bum-inperiod for these 20-mA LEDs was evident, with their average intensity increasing to 110% of initial intensity. No degradationin output intensity was seen for the 20-mA LEDs after 3600 h of testing, even with 1000 h of the test being run at 30 to 35OC.According to Nichia's own data sheets, tlie maximum allowable forward current for these LEDs is 30 mA. During thepresent testing, LEDs driven at 30 mA showed a slight increase in intensity after 3600 h.The final intensity values for the 18 newer LEDs were as follows:Drive Current (mA) Final Relative Intensitv (%)20110301044097509660887061There were only two soft fdlures seen (relative intensity dropped to 50% of the original value). The older-generationLED, which failed after 1000 h at 20 mA and 250 h at 70 mA, had a diagonal crack across the semiconductor chip. The onenewer LED which failed had sustained 1000 h at 20 mA, 2650 h at 70 mA, with 1000 h at 3OoC and above. Failure analysison this device is pending.Current control circuitry was designed specifically for this life testing. The hvo circuits used in the first phase of testing,an op-amp circuit and a resistor circuit, performed equally well. No correlation was found between LED performance and thetype of circuit used.Detailed studies were conducted to uncover any correlation which may have existed between operating conditions (LEDvoltage, current, or resistance) and LED performance. No such correlation was found. For instance, the drive current for eachLED was adjusted using a potentiometer to within /3%of the target values. Thus, all of the LEDs being driven at "20 mA"had slightly different drive currents. The drive current also varied slightly (by approximately /-IS%) during any one phase6
of life testing. But neither the variations in initial current settings nor the minor current variations during tests had anycorrelation to the overall trends of LED intensities.8. ACKNOWLEDGMENTSThe authors would like to thank G. L. Knauss, E. P. Royer, and R J. Sons for their assistance in canying out this work.This work was supported by the United States Department of Energy under Contract DE-AC04-94AL85000 and by the ARPAOptoelectronic Materials Center.9. REFERENCES1. S. Nakamura, "High-BrightnessBlue LEDs Using 111-V Nitrides and Their Applications," SlD 95 Digest, pp. 713-716,1995.2, S. Nakamura,T. Mdcai, and M. Senoh, Appl. Phys. Lett., Vol. 76, p. 8189, 1994.3. Nichia Chemical Industries, Ltd., "Product Guide for the NLPB 500 Series Blue LED," November 1994.4. Niclia Chemical Industries, Ltd., "Blue LED Room Temperature Operating Test data," private communication,November 1995.5. J. Lindberg, "Characterization of gallium Nitride (GaN) blue LEDs," SPIE Vol. 2622, pp. 366-373, August 1995.6. J. Lindberg, Abbott Laboratories, private communication, January 22, 1996.7. C. Kobayashi, "The Continuing Quest for a Blue Laser Diode," Photonics Spectra, pp. 90-91, January 1995.8. S. Nakamura, the Materials Research Society at http://nsr.mij.mrs.org/news/PWSummary.ht,results to be publishedin the Japanese Journal ofdpplied Physics, January 15, 1996.9. T. H. Faltus,D. J. Bicket, "Implementation of a system to life test 2-dimensional laser arrays," SPIE Yol. 1620, pp. 819, February 1992.10. T. H. Faltus, "Step-stressand life testing of muIti-emitter bar lasers," SPIE Yol. 1850, pp. 238-249, June 1993.11. D. L. Barton, J. Zeller, B. S. Phillips, P. Chiu, S. A s h , D. Lee, M. Osin'ski, K. J. Malloy, "Degradation of blueAlGaNfInGaN/GaN LEDs subjected to high current pulses," 1995 IEEE International Reliability Physics Proceedings: 33rdAnnual, pp. 191-199, April 1995.DISCLAIMERThis report was prepared as an account of work sponsored by an agency of the United StatesGovernment. Neither the United States Gwernment nor any agency thereof, nor any of theiremployees, makes any warranty, express or implied, or assumes any legal liability or responsibility for the accuracy, completeness, or usefulness of any information, apparatus, product, orprocess disclosed. or represents that its use would not infringe privately owned rights. Reference herein to any specific commercial product, process, or service by trade name, trademark,manufacturer, or otherwise does not necessarily constitute or imply its endorsement, recommendation, or favoring by the United States Government or any agency thereof. The viewsand opinions of authors expressed herein do not necessarily state or reflect those of theUnited States Government or any agency thereof.7
Nichia's brilliant success has shifted the efforts of many optoelectronics researchers, who were searching for the electrically pumped semiconductor blue laser, to the group 111-nitride materials. The reliability and, subsequently, the failure analysis of Nichia's GaN-based blue