Transcription
Human ResourcesDo you know?The Government ofIndia has a Ministryof Human ResourceDevelopment.The Ministry wascreated in 1985with an aim toimprove people’sskills. This justshows howimportant peopleare as a resourcefor the country.Do you know?Pradhan MantriKaushal VikasYojna (PKVY) wasstarted in 2015aiming to train onecrore Indian youthfrom 2016 to 2020.The objective ofthis scheme is toencourage aptitudetowards employableskills by givingquality trainingto probable andexisting wageearners.People are a nation’s greatest resource. Nature’s bountybecomes significant only when people find it useful. Itis people with their demands and abilities that turnthem into ‘resources’. Hence, human resource is theultimate resource. Healthy, educated and motivatedpeople develop resources as per their requirements.Human resources like other resources are notequally distributed over the world. They differ in theireducational levels, age and sex. Their numbers andcharacteristics also keep changing.There are 500children in myschool.How manypeople do youthink, there arein the wholeworld?My villagehas 1,000people.There are30 childrenin my class.Around 6.6 billion people.aAa2021–22How do youwrite that innumbers?
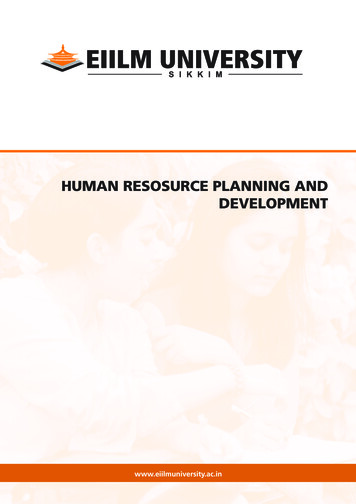
DistributionofPopulationThe way in which people arespread across the earth surfaceis known as the pattern ofpopulation distribution. Morethan 90 per cent of the world’spopulation lives in about 30 percent of the land surface. Thedistribution of population in theworld is extremely uneven.Some areas are very crowdedand some are sparely populated.The crowded areas are south andsouth east Asia, Europe and northeastern North America. Very fewpeople live in high latitude areas,tropical deserts, high mountainsand areas of equatorial forests.Many more people live northof the Equator than south of theEquator. Almost three-quartersof the world’s people live in twocontinents Asia and Africa.Sixty per cent of the world’speople stay in just 10 countries.All of them have more than a 100million people.Of every 100 people in the world.live in Asialive in Centraland SouthAmericalive in Europelive in Africalive in Northern live in OceaniaAmerica(Australia, NewZealand and thePacific island)Fig. 6.1: World population by continentsActivityStudy Fig. 6.1and find out :of the world’s totalpopulation whichcontinent has —(a) only 5 per cent(b) only 13 per cent(c) only 1 per cent(d) only 12 per centFig. 6.2: World’s most populous countriesLocate and label these countries on the outline map of the world.Source: Census of India, 2011 Provisional Population Totals, Paper 1 of 2011 India Series 1Human Resources2021–2263
Do you know?Average density ofpopulation in Indiais 382 persons persquare km.DensityofPopulationPopulation density is the number of people living in aunit area of the earth’s surface. It is normally expressedas per square km. The average density of population inthe whole world is 51 persons per square km. SouthCentral Asia has the highest density of populationfollowed by East and South East AsiaWhen all the 30 students arepresent, our classroom seemsvery crowded. But when thesame class is seated in theschool assembly hall, it seemsso open and empty. Why?Because the size or area of thehall is much larger than that ofthe classroom. However, whenall the students of the schoolcome into the hall, the hall toostarts looking crowded.Factors Affecting DistributionofPopulationGeographical FactorsActivityLook at Fig 6.2and find out:of these countrieshow many are inAsia? Colour themon a world map.Topography: People always prefer to live on plainsrather than mountains and plateaus because theseareas are suitable for farming, manufacturing andservice activities. The Ganga plains are the most denselypopulated areas of the world while mountains likeAndes, Alps and Himalayas are sparsely populated.Climate: People usually avoid extreme climates that arevery hot or very cold like Sahara desert, polar regions ofRussia, Canada and Antarctica.Soil: Fertile soils provide suitable land for agriculture.Fertile plains such as Ganga and Brahmaputra in India,Hwang-He, Chang Jiang in China and the Nile in Egyptare densely populated.Water: People prefer to live in the areas where freshwater is easily available. The river valleys of theworld are densely populated while deserts have sparepopulation.Minerals: Areas with mineral deposits are morepopulated. Diamond mines of South Africa and discoveryof oil in the Middle east lead to settling of people inthese areas.Social, Cultural and Economic FactorsSocial: Areas of better housing, education and healthfacilities are more densely populated e.g., Pune.64ResourcesandDevelopment2021–22
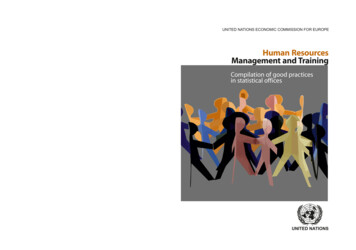
Cultural: Places with religion or cultural significanceattract people. Varanasi, Jerusalem and Vatican cityare some examples.Economic: Industrial areas provide employmentopportunities. Large number of people are attracted tothese areas. Osaka in Japan and Mumbai in India aretwo densely populated areas.GlossaryLife expectancyIt is the numberof years that anaverage person canexpect to live.Population ChangeThe population change refers to change in the numberof people during a specific time. The world populationhas not been stable. It has increased manifold as seenin the Fig 6.3. Why? This is actually due to changes inthe number of births and deaths. For an extremely longperiod of human history, until the 1800s, the world’spopulation grew steadily but slowly. Large numbers ofbabies were born, but they died early too. This was asthere were no proper health facilities. Sufficient food wasnot available for all the people. Farmers were not ableto produce enough to meet the food requirements of allthe people. As a result the total increase in populationwas very low.In 1804, the world’s population reached onebillion. A hundred and fifty five years later, in 1959,the world’s population reached 3 billion. This is oftencalled population explosion. In 1999, 40 years later,the population doubled to 6 billion. The main reasonfor this growth was that with better food supplies andmedicine, deaths were reducing, while the number ofbirths still remained fairly high.Births are usually measured using the birth rate i.e.the number of live births per 1,000 people. Deaths areusually measured using the death rate i.e. the numberof deaths per 1,000 people. Migrations is the movementof people in and out of an area.Births and deaths are thenatural causes of populationchange. The difference betweenthe birth rate and the deathrate of a country is called thenatural growth rate.The population increase inthe world is mainly due to rapidFig 6.3: World Population Growthincrease in natural growth rate.Human Resources2021–2265
Population Steadysean IncrepulatioPopulation DecreaPoereasion IncolpulatPDeath RatePolpulation steadyBirth RateDeath RatePolpulaBirth RateBirth rate and death rate same:population stays the sametion decreaseDeath RateBirth RateBirth rate more than deathrate: population increaseseDeath rate more than birthrate:population decreasesFig 6.4: Balance of PopulationGlossaryImmigrationWhen a personenters a newcountry.EmigrationWhen a personleaves a country.Migration is another way by which population sizechanges. People may move within a country or betweencountries. Emigrants are people who leave a country;Immigrants are those who arrive in a country.Countries like the United States of America andAustralia have gained in-numbers by in-migration orimmigration. Sudan is an example of a country thathas experienced a loss in population numbers due toout-migration or emigration.The general trend of international migrations isfrom the less developed nations to the more developednations in search of better employment opportunities.Within countries large number of people may movefrom the rural to urban areas in search of employment,education and health facilities.PatternsofPopulation ChangeRates of population growth vary across the world(Fig 6.5). Although, the world’s total population is risingrapidly, not all countries are experiencing this growth.Some countries like Kenya have high population growthrates. They had both high birth rates and death rates.Now, with improving health care, death rates havefallen, but birth rates still remain high leading to highgrowth rates.In other countries like United Kingdom, populationgrowth is slowing because of both low death and lowbirth rates.66ResourcesandDevelopment2021–22
Fig. 6.5: World: Differing rates of population growthPopulation CompositionHow crowded a country is, has little to do with its level ofeconomic development. For example, both Bangladeshand Japan are very densely populated but Japan isfarmoreeconomicallydeveloped than Bangladesh.I buildI tell storiesbridges.to myTo understand the role ofgrandchildren.people as a resource, we needto know more about theirqualities. People vary greatlyI takein their age, sex, literacycare of myI sing athome.level,healthcondition,weddings.occupation and income level.It is essential to understandthesecharacteristicsofI am researchingthepeople.PopulationI am afor medicines tocomposition refers to thefarmer.cure cancer.structure of the population.Thecompositionof Think: Every human being is potential resource for the society.population helps us to know What will be your contribution as a human resource?Human Resources2021–2267
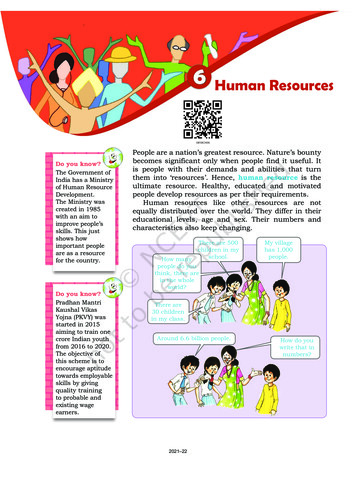
how many are males or females, which age group theybelong to, how educated they are and what type ofoccupations they are employed in, what their incomelevels and health conditions are.An interesting way of studying the populationcomposition of a country is by looking at the populationpyramid, also called an age-sex pyramid.A population pyramid shows The total population divided into various agegroups, e.g., 5 to 9 years, 10 to 14 years. The percentage of the total population, subdividedinto males and females, in each of those groups.What is this triangularlooking diagram?This is apopulationpyramid.Fig. 6.6: Population PyramidCan I play detectiveand investigatethe population of acountry.What’s that?It shows thepre-sent numberof males andfemales in acountry alongwith their agegroups.68ResourcesandDevelopment2021–22Sure, let’s studythree countries.
The shape of the population pyramid tells the storyof the people living in that particular country. Thenumbers of children (below 15 years) are shown at thebottom and reflect the level of births. The size of thetop shows the numbers of aged people (above 65 years)and reflects the number of deaths.The population pyramid also tells us how manydependents there are in a country. There are two groupsof dependents — young dependents (aged below 15 years)and elderly dependents (aged over 65 years). Those of theworking age are the economically active.The population pyramid of a country in which birthFig. 6.7: Populationand death rates bothe are high is broad at the base andPyramid of Kenyarapidly narrows towards the top. This is because although,many children are born, alarge percentage of them diein their infancy, relativelyfew become adults and thereare very few old people. Thissituation is typified by thepyramid shown for Kenya(Fig 6.7).Incountrieswheredeath rates (especiallyamongst the very young)are decreasing, the pyramidis broad in the youngerFig. 6.8: Population Pyramid age groups, becauseof Indiamore infants surviveto adulthood. This can be seen in the pyramidfor India (Fig 6.8). Such populations contain arelatively large number of young people and whichmeans a strong and expanding labour force.In countries like Japan, low birth rates makethe pyramid narrow at the base (Fig 6.9). Decreaseddeath rates allow numbers of people to reachold age.Skilled, spirited and hopeful young peopleendowed with a positive outlook are the future ofany nation. We in India are fortunate to have sucha resource. They must be educated and providedskills and opportunities to become able andFig. 6.9: Population Pyramidproductive.of JapanHuman Resources2021–2269
Exercise1. Answer the following questions.(i) Why are people considered a resource?(ii) What are the causes for the uneven distribution of population inthe world?(iii) The world population has grown very rapidly. Why?(iv) Discuss the role of any two factors influencing population change.(v) What is meant by population composition?(vi) What are population pyramids? How do they help in understandingabout the population of a country?2. Tick the correct answer.(i) Which does the term population distribution refer to?(a) How population in a specified area changes over time.(b) The number of people who die in relation to the number of peopleborn in a specified area.(c) The way in which people are spread across a given area.(ii) Which are three main factors that cause population change?(a) Births, deaths and marriage(b) Births, deaths and migration(c) Births, deaths and life expectancy(iii) In 1999, the world population reached(a) 1 billion(b) 3 billion(c) 6 billion(iv) What is a population pyramid?(a) A graphical presentation of the age, sex composition of apopulation.(b) When the population density of an area is so high that people livein tall buildings.(c) Pattern of population distribution in large urban areas.3. Complete the sentences below using some of the following words.sparsely, favourable, fallow, artificial, fertile, natural, extreme, denselyWhen people are attracted to an area it becomes .populatedFactors that influence this include . climate; goodsupplies of . resources and . land.70ResourcesandDevelopment2021–22
4. ActivityDiscuss the characteristics of a society with ‘too many under 15s’ and onewith ‘too few under 15s’.Hint : need for schools; pension schemes, teachers, toys, wheel chairs, laboursupply, hospitals.Some Internet Sources for More Human Resources2021–2271
Notes2021–22
Human resources like other resources are not . equally distributed over the world. They differ in their educational levels, age and sex. Their numbers and characteristics also keep changing. Do you know? The Government of . India has a Ministry of Human Resource Development. The Ministry wa