Transcription
Lesson 4Lesson 4Chart Analysis – Bar-Building Techniques and Chart StylesChart Analysis – Bar-Building Techniques and Chart StylesTable of ContentsChart Analysis Windows .Formatting the Symbol in a Chart .Changing Symbol, Bar Interval and Range .Time-Based Intervals .Activity-Based Intervals .Price-Based Intervals .122344Requesting Data Using the Download Scheduler Changing the Style of a Symbol .Formatting the Price Scale .Symbol Properties and Trading Sessions .Using Background Dragging Chart Analysis WindowsChart Analysis windows, or charts, are used to display price data for historical and real-time technicalanalysis, as well as for strategy back-testing and automation.You can create as many Chart Analysis windows as you like, on the same workspace or on differentworkspaces. To create a Chart Analysis window, click on the Chart Analysis icon from the TradingAppLauncher or click on the File – New – TradingApp Window menu sequence and click Chart Analysisfrom the TradingApp Launcher.Page 1 of 13Learning TradeStation78101112
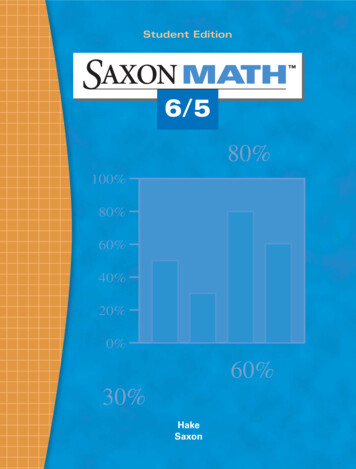
Lesson 4Chart Analysis – Bar-Building Techniques and Chart StylesFormatting the Symbol in a ChartYou can change the settings and appearance of a Chart Analysis window by formatting the symbol. Toaccess the Format Symbol dialog, click on the Format – Symbol menu sequence or right-click on thebackground of a Chart Analysis window and click on Format Symbol from the right-click menu. TheFormat Symbol dialog has four tabs with all the settings to customize the data and appearance in aChart Analysis window.Changing Symbol, Bar Interval and RangeIn the Select Interval box, you can choose the method used to build bars. Interval refers to the rule thatwill be used to determine when a bar (or column, etc.) closes and the next begins. TradeStation offersintervals that are time-based, activity-based or price-based.Under the section labeled Range, you can specify the amount of historical data to load. Historical datacan be a specific number of days, weeks, months or years back. It can also be a specific number of barsback or a range between a first date and last date.Note: In order for a Chart Analysis window to update in real time, Last Date under Range must be thecurrent date. You must also subscribe to the exchange’s real-time data service.Page 2 of 13Learning TradeStation
Lesson 4Chart Analysis – Bar-Building Techniques and Chart StylesTime-Based IntervalsSeconds - Each bar represents the tradingactivity within a user-defined number of seconds.Weekly - Each bar represents the trading activityMinute - Each bar represents the trading activityMonthly - Each bar represents the trading activityfrom the beginning of the calendar month to the end.within a user-defined number of minutes.from the beginning of the week to the end.Daily - Each bar represents the trading activityfrom the beginning of the symbol’s trading sessionto the end (one day).Page 3 of 13Learning TradeStation
Lesson 4Chart Analysis – Bar-Building Techniques and Chart StylesActivity-Based IntervalsTick - Each bar represents the trading activityVolume (Share) - Each bar representswithin a user-defined number of trades.the trading activity within a user-definednumber of shares or contracts traded.Price-Based IntervalsKagi ChartKagi charts display a series of connectingvertical lines whose thickness and directionare dependent on price direction. Whenthe market moves in the same direction asa prior Kagi line, the line will be extended.When the market moves in the oppositedirection by at least the reversal amount, anew Kagi line in the opposite direction willbe displayed. The color and width of theKagi line changes when the Kagi linebreaks a prior high or low.Page 4 of 13Learning TradeStation
Lesson 4Chart Analysis – Bar-Building Techniques and Chart StylesKase ChartKase charts create bars with a true rangebased on a user's specified target rangevalue by using only real price data. KaseBar charts look like a traditional bar (orcandlestick) chart except that the size ofeach bar is dictated by a target rangevalue; all the bars are approximately thesame size or range.Line Break ChartThe Line Break chart is made up of a seriesof vertical blocks called lines. Line Breakcharts are most commonly set to three, andare known as "three-line break" charts. Abreak of the lowest low of the last three uplines will generate a down line. A break ofthe highest high of the last three down lineswill generate an up line.Momentum Bar ChartThe size of Momentum bars will always bethe range size set by the user and willnever be anything smaller or larger unlessit is the current bar that is building. Since anew bar cannot be started until thespecified range is exceeded, the open ofeach Momentum bar is always one pricetick above or below the close of theprevious Momentum bar. There are nogaps displayed on Momentum bar charts,so when there is a price gap in theunderlying data, "virtual bars" will beinserted to fill in the gap.Page 5 of 13Learning TradeStation
Lesson 4Chart Analysis – Bar-Building Techniques and Chart StylesRange Bar ChartThe size of Range bars will always be therange size set by the user and will never beanything smaller or larger unless it is thecurrent bar that is building. The open ofeach Range bar is always equal to theclose of the previous Range bar. There areno gaps displayed on Range bar charts;therefore, when there is a price gap in theunderlying data, "virtual bars" will beinserted as necessary to fill in the gap.Renko Bar ChartWhen the market moves in the samedirection of the prior Renko brick by thespecified brick size, a new brick will beadded in the same direction as the priorbrick. When the market moves in theopposite direction of the prior brick by twicethe specified brick size, a new Renko brickwill be added in the opposite direction ofthe prior brick. If there is no significantchange in price – i.e., the price oscillateswithin the range of the last brick – no newbrick will be added.Point & Figure ChartPoint & Figure charts filter out time andinsignificant price changes, leaving a chartthat contains only relevant pricemovements. Rising prices are displayed ascolumns of Xs and falling prices aredisplayed as columns of Os. The box sizereflects the minimum increase or decreasein price needed to add an X or O to acolumn of Xs or Os, respectively. Thereversal amount refers to the change inprice, either up or down, needed to create anew column and reverse from a column ofOs to a column of Xs, and vice versa.Page 6 of 13Learning TradeStation
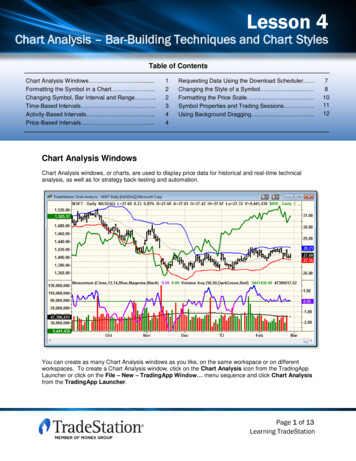
Lesson 4Chart Analysis – Bar-Building Techniques and Chart StylesRequesting Data Using the Download SchedulerRequesting a large amount of historical datawill bring up the Download Scheduler. Selectwhether you wish to download the data “Assoon as possible” or “During off-peakhours.” (This will help you manage systemresources as the data is being downloaded inthe background.) Then click OK.A “PD” or “Pending Data” indicator willappear at the top left corner of the chart,indicating that there is historical data pendingfor download.Historical data is downloaded gradually and automatically inserted on the chart. As soon as thedownload is complete, the “PD” indicator disappears.If alerts are enabled for analysis techniques, or strategies are inserted in a Chart Analysis window, theanalysis techniques or strategies will not recalculate using the recently downloaded data. By default,recalculations are turned off toavoid duplicating alerts or strategyorders. To change thisfunctionality, click on View – ChartAnalysis Preferences and setyour preferences in the Data tab.Here, you may also disable theDownload Scheduler fromappearing every time there is alarge data request.Page 7 of 13Learning TradeStation
Lesson 4Chart Analysis – Bar-Building Techniques and Chart StylesChanging the Style of a SymbolThe Style tab lets you select the display style for the chart, including colors and weights. Bar Type refersto the display style for the bars in the chart. It is independent of data interval, although some price-basedintervals are restricted to only their traditional bar-type setting.In the Bar type box, select the style for the bar. In the Bar components box, you may format individualparts of the bar. Checking the checkbox “Use same color/weight for all components within each bartype” applies any changes to one component to all other bar components. Uncheck this box if you wishto apply different styles to each bar component.Checking the checkbox “Display Update Indication” will show the current trading price of a symbol in theprice scale on the right side of a Chart Analysis window. You may also use a symbol in a Chart Analysiswindow and hide it from viewing by checking the “Make price data invisible” checkbox.Note: Available styles and bar components depend on the interval settings selected on the Settings tab.Page 8 of 13Learning TradeStation
Lesson 4Chart Analysis – Bar-Building Techniques and Chart StylesOHLCHLCDisplays the open, high, low and close foreach bar.Displays the high, low and close ofeach bar. Open is removed.Candlestick ChartThe candlestick chart uses the same price data as a bar chart. The "thick" part of the candlestick isknown as the "real body" and represents the range between the open and closing prices. A green realbody represents a bullish candle – the close price was higher than the open price. A red real bodyrepresents a bearish candle – the close was lower than the opening price. The thin line above the bodyextends to the high, and the thin line below the body extends to the low.Candlestick with TrendDisplays candlestick bars with hollow and filledbodies. A hollow body represents a bullish candle –the close price was higher than the open price. Afilled body represents a bearish candle – the closewas lower than the opening price. The bar color isused to indicate the trend direction. By default, greenindicates the current bar close is greater than theprevious close, red indicates the current bar close isless than the previous close, and gray indicates nochange in close from the previous to current bar.Dot on closePaints a single dot at the close of each bar.Line on closeA line chart displays a line that connects the closingprice of each bar.Page 9 of 13Learning TradeStation
Lesson 4Chart Analysis – Bar-Building Techniques and Chart StylesFormatting the Price ScaleThe Scaling tab has selections for setting the style and range of the chart scaling.Under Type, select Linear to produce a scale where the height of each price increment is equalregardless of the price of the symbol; select Semi-Log to produce a scale where the height of each priceincrement is weighted towards percent of price.A Chart Analysis window containing text annotations, drawing objects or trendlines may need additionalspace above and below the bars. You can select Sub-graph Margins under the Range section to addspace above and below sub-graphs based on a percentage of the chart scale.Custom Axis Increment, under the Display section, allows you to add more price detail to the pricescale or adjust the price increments.Page 10 of 13Learning TradeStation
Lesson 4Chart Analysis – Bar-Building Techniques and Chart StylesSymbol Properties and Trading SessionsThe Properties tab provides access to symbol information such as minimum price movement and bigpoint value. It also provides access to settings for sessions in an intraday chart. These include pre- andpost-market sessions for stocks as well as custom sessions.Click thebutton to see sessionselections and details.TradeStation also allows you to createcustom sessions. By creating a customsession and applying it to a ChartAnalysis window, price bars will only bedisplayed within the times specified.All times used in a regular or customsession are based on exchange time.Page 11 of 13Learning TradeStation
Lesson 4Chart Analysis – Bar-Building Techniques and Chart StylesUsing Background DraggingEnabling Background Dragging on a chart allows you to change the scaling of a sub-graph by draggingthe sub-graph background or any selected object using the mouse. To enable Background Dragging,right-click on the background of a chart, select Background Dragging from the right-click menu and clickon Enable.You may also click on the Background Dragging buttonon the toolbar.With Background Dragging enabled, the mouse pointer changes to a hand that lets you click and drag tomove the background horizontally or vertically to display different sections of the chart window; allindicators and other chart features in a sub-graph will move together.You may also adjust the price scale manually by clicking directly on the price axis area and dragging themouse pointer up to expand the scale or down to contract the scale.To disable Background dragging, right-click on the background of the chart, select BackgroundDragging from the menu and you have two options: restoring the original scale range or maintaining thenew scale and range. Maintaining the new scale range means that the price scale is fixed and any pricefluctuations outside this new range will not be displayed in yourChart Analysis window.Clicking the Background Dragging buttonfrom the toolbarwill restore the original scale range in the Chart Analysiswindow.Page 12 of 13Learning TradeStation
Lesson 4Chart Analysis – Bar-Building Techniques and Chart StylesIMPORTANT INFORMATION:No offer or solicitation to buy or sell securities, securities derivative, futures products or off-exchange foreign currency (forex) transactions of any kind,or any type of trading or investment advice, recommendation or strategy, is made, given or in any manner endorsed by any TradeStation affiliate andthe information made available on this Website is not an offer or solicitation of any kind in any jurisdiction where any TradeStation affiliate is notauthorized to do business, including but not limited to Japan.Past performance, whether actual or indicated by historical tests of strategies, is no guarantee of future performance or success. There is a possibilitythat you may sustain a loss equal to or greater than your entire investment regardless of which asset class you trade (equities, options futures orforex); therefore, you should not invest or risk money that you cannot afford to lose. Options trading is not suitable for all investors. Your accountapplication to trade options will be considered and approved or disapproved based on all relevant factors, including your trading experience. Pleaseclick here to view the document titled Characteristics and Risks of Standardized Options. Before trading any asset class, customers must read therelevant risk disclosure statements on our Other Information page. System access and trade placement and execution may be delayed or fail due tomarket volatility and volume, quote delays, system and software errors, Internet traffic, outages and other factors.TradeStation Group, Inc. Affiliates: All proprietary technology in TradeStation is owned by TradeStation Technologies, Inc. Equities, equities options,and commodity futures products and services are offered by TradeStation Securities, Inc. (Member NYSE, FINRA, NFA and SIPC). TradeStationSecurities, Inc.’s SIPC coverage is available only for equities and equities options accounts. Forex products and services are offered by TradeStationForex, a division of IBFX, Inc. (Member NFA).Copyright 2001-2013 TradeStation Group, Inc.Page 13 of 13Learning TradeStation
from the beginning of the symbol’s trading session to the end (one day). Page 4 of 13 Learning Lesson 4 Chart Analysis – Bar-Building Techniques and Chart Styles TradeStation Activity-Based Intervals Tick - Each bar represents the trading