Transcription
Forex Survival Guide forSerious TradersMaster the Charts Maximize your Success Minimize your Losses
Hi, thanks for stopping by ‘The Forex Guy’ blog.You’ve no doubt grabbed this eBook because you’ve got a passion for trading, a thirst forknowledge, and are serious about becoming a successful trader. The psychology behindtrading is a fascinating subject. In this business, you will hear that if you can get your emotionsunder control, you can make any trading plan work. The ability to follow set rules withoutdeviation or emotional intervention is the mindset that is considered the ‘holy grail’ of thetrading discipline.Ultimately, if you show weakness to the market, it will be exploited and used against you. It’svery easy to screw up and open holes in your defences, allowing vulnerability for silly tradingmistakes. I know a lot of smart, experienced traders who still slip up and make tradingmistakes when they know better, myself included. This risk is something we must deal withconstantly throughout our entire trading career, it never goes away. If anyone tells youotherwise, they’re lying.“The more sophisticated you become as a trader, the more you will realizethat trading is completely mental. It isn't you against the markets, it's justyou." - Mark DouglasTrading can push you to depressive lows or extreme highs. One moment the market can makeyou feel like the most useless human being in the world, and the next make you feel invincible.On average, Forex traders feel frustrated and confused, especially the newbies on the scene.The intense challenges the market throws at you daily leave most traders feeling exhaustedfrom being in a constant negative state, mentally and emotionally. As a result, traders have ahard time building any sort of positive outlook with the Forex markets.Eventually, worn-down traders will feel like they’ve soldtheir soul to the market. They’ll let their guard down andburn their account to the ground via reckless emotionaltrading; the psychological equivalent of committingsuicide. Most traders are second-guessing themselves atevery turn. One of the culprits is the overwhelming amountof conflicting information on the internet. From ‘ExoticForex trading strategies’, to ineffective moneymanagement systems, to shady broker’s promises, to‘magic’ indicators and crude trading robots, there’s plentyof ‘bad advice’ available out there.In this eBook, I share useful, practical tips that you can useto immediately improve your trading, and give you a goodfoundation upon which to build your Forex trading career.
Day Trading – A Dangerous Game“A moderate addiction to money may notalways be hurtful; but when taken in excessit is nearly always bad for the health”.- Clarence Day
daytrading rant Day trading, a.k.a. high frequency trading or ‘scalping’ – is a sensitive, controversial subjectfor a lot of traders. I know there will be many traders that don’t agree with what I say here;to each their own :)Most newcomers are attracted to the idea of day trading because it promotes high profitgeneration through the principle that taking more trades earning more profit.Day trading requires traders to be in-and-out of trades throughout the day, making it a veryintense way to trade. For the ‘adrenaline seeker’, Day trading could be the ‘rush’ they’relooking for.Because ‘Day trading strategies’ is so viral right now, it is discussed heavily in the public Forexforums, and it traps a lot of new traders into believing day trading is the right way to go abouttrading.Everyone else is doing it so it must be good right?Wrong!It’s been discovered through one study that Day traders are some of the worst performingcategory of traders.“We used two distinct methodologies to examine the profitability of asample of U.S. day traders. The results show that about twice as many daytraders lose money as make money.”Source: “The profitability of day traders” published in the Financial AnalystsJournal (Vol. 59, No. 6, Nov-Dec 2003).With high frequency trading strategies, like scalping or day trading, traders are focusing theirattention on the lower timeframes.What’s the problem with short timeframes you may ask?
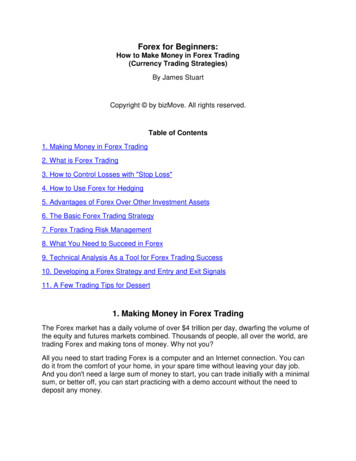
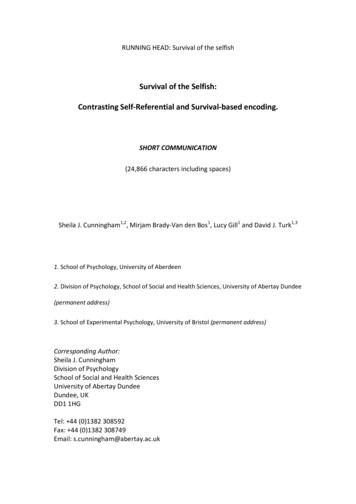
Look at the chart above. It’s a typical scenario on the intraday price charts. It’s a very noisy, unstable,unreliable picture of the trading environment. It’s hard to see the bigger picture and really get anyidea of what the market is doing. Welcome to the battlefield of a Day trader.Here is the same currency pair (EURUSD) displayed on the daily timeframe. At first glance we can seethe market is clearly in a down trend here and would be best to look for short opportunities. Muchmore clarity is available to us by looking at the market from this perspective.
The candlesticks on short timeframes are nothing but noise; they don’t represent meaningfulmovement. Day traders make high risk trading decisions based on this kind of noise.Not only that, but day traders generally have to make a lot of trades per day to see any sort of decentreturn for their efforts. This is true because their losses will normally greatly out perform any winners.It’s just the nature of these strategies, large risk for small profits.The difference between winners and losers is not a small amount; it’s generally a nasty gap. Due tothis ‘negative profit ratio’, day traders are required to maintain a very high win rate to keep losingtrades from destroying huge chunks of capital.A losing trade could potentially wipe out the gains from the previous 10 trades. Think about the stressthis would induce when a day trader discovers their trade isn’t working out. Closing the trade on earlysigns of failure will still probably result in a big loss because there is very little margin for error.Day trading ends up turning into a very emotional, ‘gut instinct’ way to trade. Many day traders whodo manage to keep the losses at bay eventually get frustrated with the small progress made in accountgrowth, and decide to ‘up the risk’ in order to speed profit-gaining results.Day trading requires traders to spend hours in front of the computer screen. Who would want to livelike this? It’s a very taxing way to trade leading to physical and mental exhaustion. When you’rementally fatigued, you make poor decisions. It breaks my heart when traders tell me they day trade.Seriously don’t engage in high frequency trading strategies, no matter how good they sound or howstrongly they are being promoted. If you’re after action, go down to the casino and play some blackjackor something. Walking away from the charts a loser makes you feel like crap, walking away from thecasino a loser is to be expected right? But at least you had a good time. /daytrading rant
The ‘Real’ Value of Pips“Trading is an exercise in accumulatingmoney” - Mark Douglas
When you hear traders call out “oh, I made 250 pips on a EURUSD short!” Realize that it’s really justan empty statement. 250 pips sounds like a nice trade, but how much did the trader actually risk inthe first place to get that return?What if the trader had a 900 pip stop loss and was running the trade over a period of 5 months? Whatif the trade actually spent most time in the negative, and the trader kept expanding the stop lossbecause the market continued to move against the position?That doesn’t sound like such a good trade anymore, does it? If anything it sounds more like the tradergot a lucky break! You’ve got to ask yourself, “What are we trading for?” Money!So, your trades should be measured in the amount of risked, not pips.Let’s compare two traders: we will call them trader A and B.Trader A could be risking 30 pips on a trade, while trade B has risked 300 pips. What if I told you tradeA has more risk? Trader A with his 30 pip stop could have a position size of 3 full lots. Let’s comparethat to trader B who has a position size of 0.1 lots Trader ATrader BStop Loss Size30 pips300 pipsPosition Size3 Standard Lots0.1 Standard Lots ( 1 mini )EURUSD Pip Value @ 1 Lot 10 10Trade Risk 900 300Just for fun, let’s flip the position sizing around between the traders to see the effects Trader ATrader BStop Loss Size30 pips300 pipsPosition Size0.1 Standard Lots ( 1 mini )3 Standard LotsEURUSD Pip Value @ 1 Lot 10 10Trade Risk 30 9000Stop loss size is only part of the equation when it comes to trade risk. Your position sizing and thepoint value of the instrument you’re trading will also have a big effect on trade risk as you can seefrom the examples above.Most traders don’t understand position sizing very well and don’t actually know, or accept the riskthey are taking on. When it comes down to trade risk, it’s not about the pips, it’s about the money.When I go to sleep at night, I want to feel comfortable in knowing exactly how much risk I have appliedto my trades.I won’t go through the math behind manually calculating position sizing, that’s something we cover indetail in our price action course. A quick solution, use an online lot size calculator like this one BabyPips Online Lot Size CalculatorStop trading blind and calculate your position size correctly!
Don’t Spray & Pray“It is quality rather than quantity thatmatters.”- Lucius Annaeus Seneca
Do you approach Forex trading like a 1930’s gangsta, offloading his tommy gun into his rival’s favouritehangout?A massive problem with Forex traders is they take on more than they can handle by opening too manytrades at a time. It’s this ‘spray and pray’ mentality where a trader opens an unmanageable amountof trades with the hope some of them work out, and turn a good profit.‘Hope’ is not a valid trading strategy by the way The logic trap here is that most of the currency movements are correlated. So if a group of trades aretaken around the same time, and the market moves against you, then all your trades will probably allfail at once.This is the typical “shoot first and think later” kind of trading.Taking on too many trades at one time makes things unmanageable, messy and can be very mentallytaxing. On occasions I’ve seen some ‘cowboy traders’ open up to50 trades at once. I mean that’s justridiculous.I have been guilty in the past of having too many trades open, and I know you have too. When thingsgo wrong, you feel like you’re aboard the Titanic when it’s taking on water. There aren’t any lifeboatsleft and you’re already feeling those ice chilling waters.This is why I adopted the policy of “Only one trade at a time”.
Seriously try it, it’s probably one of the best rules I’ve put in place. It helps remove the temptation ofovertrading and adopting unnecessary risk. You leave the market alone to do its thing and give yourselfthe breathing space you need between you and your account.In my experience, the less involved you are with your trading account, the more profitable you are inthe end. By only managing one trade at a time, you will find yourself in a better situation thanattempting to nail 3 trades simultaneously.Think about it. If those ‘excess’, or extra trades you stack up don’t work out, they put you a few stepsback, even though the intention was to move forward. If the first initial trade you take does hit itstarget, it’s only going to place you at break even. It’s a trading paradox that has always come back tobite me in the behind – “The more you push the market, the harder it is to move forward. ““If only I stuck with just that one trade”.Seriously, how many times have you said that to yourself?By sticking with just the one trade, you can focus on the higher quality, ‘high probability’ trade signals.This advice might not sit well with newer traders who want all the action they can get. Eventually youwill see my reasoning after you ‘churn and burn’ your account with heavy trading activity.The less involved you are with your trading, the more progress you will see.
20% Work, 80% ResultsWork Smarter – Not Harder
If you haven’t figured it out yet, I am a lazy trader. I don’t like to be very involved with my tradingaccount. Once I place an informed trade, I prefer to let the market do the rest of the work for me.I don’t know why, but many traders seem to love to ‘micro manage’ their positions. That’s got to bethe quickest way to suffer from ‘trader burnout’.Have you ever heard of the ‘80/20 Rule’? It’s also known as the ‘Pareto Principle’. It’s a ratio that states80% of your results come from 20% of your efforts. Most traders have it the wrong way around –putting in 80% work for 20% results. We need to think on the inverted side of the ratio to make it 20%Work, 80% Results instead.Here is a typical scenario of an overworked trader trying to micro manage his/her trades “I’VE MADE 300 ON THIS GBPUSD TRADE, IT HASN’T HIT THE TARGET YET BUT I SHOULD TAKE THE PROFITBEFORE THE MARKET REVERSES ON ME”“BUT ON SECOND THOUGHT IF THIS TREND KEEPS GOING, IT COULD EASILY BE A 3000 WINNER, EVEN MORE IFI ADD TO MY POSITION AT THIS PRICE”“HMM, MAYBE I SHOULD JUST TAKE THE TRADE NOW BECAUSE MY ACCOUNT IS DOWN AND I REALLY NEED TOGET A WIN HERE”“MAYBE IF I JUST MOVE MY STOP TO BREAK EVEN TO PROTECT AGAINST A LOSS AND LET THE TRADE RUN”“I AM GETTING A SELL SIGNAL ON THE 15 MIN CHARTS THOUGH MAYBE IF I SHORT NOW I CAN CATCH A MAJORREVERSAL”“BUT THE DAILY TREND IS VERY BULLISH, I SHOULD STAY LONG”“MAYBE I COULD DO SOME HEDGING HERE, I HEARD THAT’S A GOOD SYSTEM”“OH, GBP NEWS COMING OUT FROM THE BANK OF ENGLAND SOON THOUGH, IT’S EXPECTED TO BE BULLISH”“WHAT SHOULD I DO . ARRRRGGGGGGHHHHHH”These examples illustrate the thoughts weighing on the minds of many novice traders. We can allrelate to this kind of frustration, trading without any direction, structure or plan in place.There is no benefit of being over analytical in the markets. The less variables you bring into trading,the better. That’s why I like price action trading so much because you only need to worry about what’sgoing on with price on the charts.Price action is a very ‘low maintenance’ way to trade. You can deploy ‘set and forget’ style trademanagement very easily where you set your trade up and let the market take over from there. Yourtrade will either hit its target, or be stopped out, no in-betweens.If you have a full time job, study, or have other commitments, then you don’t have time to sit in frontof the charts all day. Here are a few suggestions to help you fit trading into a busy lifestyle
1. Switch to higher timeframesHigher timeframes, my favourite being the daily time frame, offer a much clearer picture of what’sgoing on in the market. Generally daily trends last a long time and are much more reliable thanintraday moves.Those traders who get caught up in lower time frames waste hours in front of the screen, dealingwith low quality signals and market noise. Most of the time lower timeframes look like a mess andare just outright confusing. You need to see the bigger picture.If you had 1 million dollars to trade with, would you use unreliable timeframes like the 5 min and 15min chart, or put your trust in the daily and weekly timeframes?When you work with daily candlesticks, you’re working with much more reliable data. A trade signalon the daily chart has many times the value of a trade signal on lower timeframes.See More: How End of Day Trading Strategies Can Transform your Life2. Check the market only at key timesThis suggestion goes hand in hand with using higher timeframes. By using the higher timeframe likethe daily chart, you only need to check the market at key times.We use, ‘New York Close’ candles which means our daily candle will close when the New Yorkmarket closes. The New York close data offers a true representation of what happened during the 24hour Forex session (Sydney Open – New York Close).We are checking the markets at the New York Close to see how the daily candle closed, and if thereare any price action signals we can take advantage of.A second, but less important check point, is around the London open. Here we look to see if thereare any breakout trap signals that have been generated through the Asian session that could lead toa breakout trap & reverse trade setup.You really only need to spend about 15 minutes (minimum) per day, analysing the daily chart forprice action signals that you can act on.3. Don’t stare at chartsEspecially when you have trades open!If you watch every price tick, you’re going to be tempted to intervene on the position. You might betempted to fiddle with your trade and start with that bad ‘micro-management’ habit that we spokeof earlier. Whether it’s a quick ‘stop loss adjustment’ here, implement a trailing stop there, or evenjust an outright early trade closure, you are not sticking to your plan.You need to remain emotionally disconnected from trading, and it’s going to be very difficult to dothat if you’re starting at the screen anticipating every tick.If you can’t control yourself, don’t put yourself in a position where you are vulnerable to ‘selfsabotage’. Place your trade, step away from the charts and go enjoy your day.
Attention Ratio"A man with a watch knows what time it is.A man with two watches is never sure."- Segal's Law
How many variables do you take into consideration when placing a trade?We walked through a typical scenario earlier where a trader essentially drowns in data and doesn’tknow what to do with an open position. With so many variables influencing price movements, it’s easyfor your charts to get out of control.You’ve got the economic calendar which the ‘news traders’ watch like a hawk, the underlying financialand political fundamentals affecting the markets, new Forex robots popping up every day, not tomention Forex ‘analysts’ offering different opinions.Then there are the price charts 1000’s of indicators to choose from, Fibonacci levels, pivot levels, support and resistance, varioustypes of chart formats need I go on?Where does it stop?It’s easy to get lost with the amount of information and data available to traders. It’s very easy fortraders to over complicate their trading quickly, and lose themselves in their own tradingenvironment. This is why it’s important to only focus your attention on the a few important detailsonly and be as minimalistic as possible.This is why I became a price action trader. Price action strategies focus strictly on the candlesticks,support and resistance levels, and we utilize two EMA’s for mean value analysis. I don’t need to worryabout the news or what the Stochastic indicator is doing.‘Price action’ is regarded as the king of all trading methodologies. Why? Because most technicaltrading systems are derived from the price action itself. By using price action you can cut out themiddle man so to speak and identify high probability, low risk trading signals by focusing straight onthe price action.Generally all the variables like the news, fundamentals and sentiment of the market are alreadyfactored into price anyway. By looking at a price chart you’re already peering into the collectedthoughts of all the market participants.Price Action – The one method that rules over allIf you get a good understanding of price action trading you will see the markets in a whole new light.You can work from clean price charts and keep your attention focused on the important details only.Every trader will benefit from a good understanding of price action.
Why I Hate Indicators So Much“There is no point in watering a deadflower”- Dean Steed
Indicators are very popular, you see them on most trader’s charts in popular Forex forums rightthrough to the ‘big shot’ market analyst’s chart. Despite their insane popularity, I have no time forthem, and I never have. From the very point of inception with my own Forex trading, I never likedthe idea of Indicators!Here are a few reasons why I have no time for Indicators 1. Indicators generate horrible trade signalsHonestly, for an indicator to function correctly and generate good trade signals, the marketconditions need to be perfectly suitable for that specific indicator.If you relied on one indicator, it would generate some OK signals, but then give all the profits straightback to the market as soon as market conditions shifted. Some traders will work with ‘indicatorstacks’ to try get multiple indicators to come to a common consensus on buy or sell signals.It sounds good, but adding indicators to filter out the flaws from other indicators only compoundsthe problem. Indicators will only generally line up after long extended price movements, by thattime the move is probably over anyway.Above is the popular CCI indicator generating poor trade signals.
2. Indicators are actually very basicTraders will often look at indicators as a ‘black box’ that contains some highly complex mathematicalalgorithm that will give them a really good edge in the market.In our ‘Indicator Autopsy’ series, we open up common indicators and explain how they work. Youmay be in for a shock; they are actually quite simple in nature.Most of the common indicators you find in your charting package are nothing more than a play onmoving averages and price action data points, like swing highs and lows.Some Indicators will actually use the output of other indicators and blend them in with a barrage ofmoving averages.I am sorry to break the hearts of all the indicator lovers out there, but I can’t see any ‘edge’ in usingthem. All they do is obstruct the most valuable thing on your charts, and that’s price itself.The chart above demonstrates the Stochastic generating ‘buy’ signals through a strong bear market.
3. Indicators are slow to respond to market movesIndicators react slowly to price movements. Sometimes even so badly that an entire price movecould be over, and the indicator will only have just begun to generate a ‘buy’ or ‘sell’ signal. It’s likearriving to the party after everyone else has gone home.As we discussed in the previous point, this is mostly due to the fact that the inner workings of mostindicators revolve around slow averaging calculations (sometimes, even a moving average on top ofmoving average, on top of another moving average).Indicators do this to help prevent ‘false signals’ from being generated by sharp moves in themarkets, like news spikes. It does its job effectively, but unfortunately to get a signal the market hasto move up do down for a long term before the indicator responds with a buy or sell signal.Clean up your chart template, ditch the indicators and learn how to ‘read the charts’ by focusing ona strategy like price action trading.
What is Price Action Trading?“Give a man a fish and you feed him for aday; teach a man to fish and you feed himfor a lifetime”- Maimonides
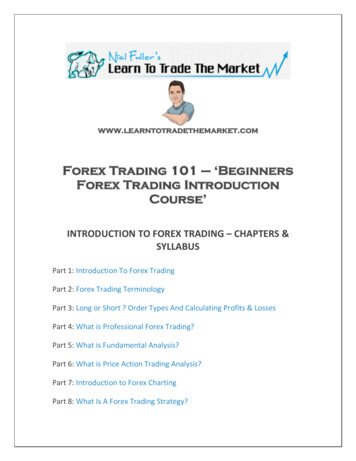
We’ve been referring to price action trading quite a lot, but what is it exactly? - Only the mostpopular/powerful trading methodology used in the markets today.Price Action Trading is the skill of being able to look at a plain price chart and make confident, logicaland rational trading decisions. It’s the art of reading simple candlestick charts and then being able toidentify patterns which you can use to anticipate future price movements with a high degree ofaccuracy.The real truth is; many traders only start to see progress after they learn how to trade strictly withprice itself.This is the chart of an uneducated Forex trader This trader probably thinks he is very smart, and from a newbie looking outside that may appear tobe the case for them also. But the reality is this chart is filled with useless indicators that have addeda lot of ‘noise’, creating a bad trading environment.It’s beyond me how any trader can work with this sort of chart. It might look ‘cool’ at first, and seemreally ‘advanced’, but all this really does is to create a stressful, confusing trading environment whichwould eventually drive any trader insane.The beauty of price action is you don’t have to deal with all these confusing indicators, Fibonaccilevels or pivot points. Just by looking at price action you can make low risk, high probability tradingdecisions without the stress.Take a look at the chart below
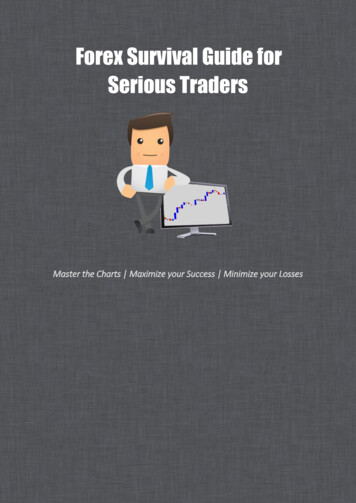
This is the clean price template that I use for my price action trading, and believe me it’s all youneed. What I’m pointing out in the chart above, is a bearish short opportunity on the EURUSDmarket.The ‘mean’ is simply the zone created by two EMAs; the 10 and 20. Nothing else is needed as far asindicators are concerned. It really doesn’t get any simpler than that now does it? And believe mewhen I tell you, that’s all you need.I’ve identified this trading opportunity by using 4 non correlated variables. Market MomentumA resistance levelMean value analysisA bearish candlestick reversal patternIt’s easy to identify that the market is moving downwards because we’re getting that nice ‘lowerhighs, lower lows’ stepping down pattern.The resistance level is obvious and was quickly identified on the chart. The mean value analysis helpsus establish a bearish bias because the market is trading on the negative side of the mean value.Finally the large bearish rejection candle brings the setup into focus nicely, and is our ‘trigger’ to goshort. The rejection candle shows us that price tried to move up into the resistance level, but therally was rejected and the market ended up closing much lower than its open price. This is a verycommon price action trade setup that brings great trading opportunities.
As anticipated, the market did sell off the next few trading days and drove the setup into deep profitquickly. The beauty of trading with price action is you’re working with the raw price movements ofthe market.You can actually ‘see’ what’s really going on in real-time, allowing you to pull the trigger withconfidence. The greater your confidence, the easier it is to execute your trades.
Gaining an Edge withPrice Action Trading“It is not the strongest of the species thatsurvive, nor the most intelligent, but theone most responsive to change.”- Charles Darwin
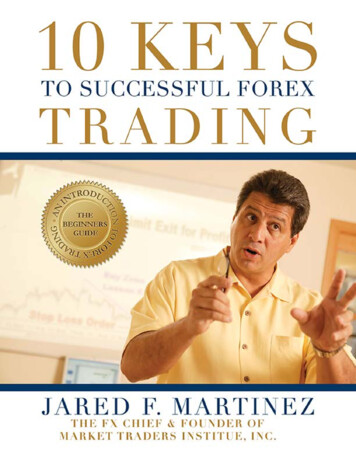
One of the key reasons price action trading is so effective, is because it’s simple. Despite popularbelief; you don’t need complicated mathematical models to gain an edge over other traders. Thetechnical side of trading should remain simple, logical and straight forward.The extra ‘bells and whistles’ on your chart will not give you a better or more consistent marketanalysis. In fact, it will do quite the opposite because these extra variables like indicators and ‘magictrading tools’ will often conflict not only with one another, but with your own personal analysis. Thisis how traders become ‘unhinged’ mentally and emotionally and eventually spiral out of control.When you trade with price action, you’re focusing on what the market is doing ‘NOW’ in relation towhat happened in the past. There is a ‘flock’ mentality in the markets which caused the market tobehave the same way in certain situations.The repetitive behaviour of the market creates price patterns that continue to form time and timeagain, which continuously produce the same outcome. So, you can use these price action signals toidentify low risk/high reward trade signals, which can position you into the market ahead of a largemove, before it actually happens. You can’t beat that. Let me show you what I mean in the tradeexample below The AUDCAD daily chart produced a ‘double inside day’ setup. An inside day is a candle which has atrading range that’s ‘inside’ the previous candle’s range. A double inside day setup is where you getan inside day within an inside day.
This is a price action pattern that occurs time and time again in the market, and they always producethe same result – a very powerful breakout. Some simple market analysis tells us the trend is clearlyup here, so we’re only interested in trading breakout that occur on the high side, because this linesup nicely with the core market momentum.Have a look what happened As expected a breakout did occur to the high side and you can see how powerful the move was. Thisis very typical of a double inside day breakout trade; you can go back through your charts and seehow explosive these setups are.The best part about this trade is that it was easy. It was simple to identify, and I could define my riskeasily and confidently enter the trade. You don’t have to worry about sitting in front of the computerfor hours to monitor the trader either, this is one of those trade setups where you can set up thetrade and walk away.
The Indecision CandleThe calm before the storm
The Indecision Candle is often referred to as a ‘Doji’ or a ‘Spinning Top’. Let me show you what anIndecision candle actually looks like on a price chart.It’s a very simple and easy pattern to identify, and it’s really simple to trade. Just a word of caution,the Indecision candle alone is not a good enough reason to pull the trigger. You need to line theseguys up with major turning points in the market, like strong support/resistance levels or strong trendlines.The Indecision candle is communicating to you that the market has lost momentum and fallen intoconsolidation, while price churns around heavily from lots of orders entering the market.Generally what follows consolidation periods are strong breakouts, and that’s what IndecisionCandles are great for, getting you into those breakouts before the actual move takes place.If an Indecision candle forms at a strong support or resistance level, and you can anticipate areversal, then you can ‘catch’ the breakout out of these patterns. All you have to do is set a buy stop,or sell stop order a few points above the high, or below the low of the indecision setup.Stop losses should be placed on the opposite side of the Indecision Candle, so you cover the full riskof the setup.Some of our War Room traders will place their stop loss above the high/low of the current tradingday to tighten up the stop. This play is a little bit riskier, but it will almost double the rewardpotential of the setup.
On the GBPJPY chart above, we can
On average, Forex traders feel frustrated and confused, especially the newbies on the scene. The intense challenges the market throws at you daily leave most traders feeling exhausted from being in a constant negative state, mentally and emotionally. As a result, traders have a hard time buil