Transcription
Big Data Driven SupplyChain ManagementA Framework for ImplementingAnalytics and Turning Informationinto IntelligenceNada R. Sanders, Ph.D.Distinguished Professor of Supply Chain ManagementD’Amore-McKim School of BusinessNortheastern University
Associate Publisher: Amy NeidlingerExecutive Editor: Jeanne Glasser LevineDevelopment Editor: Natasha TorresOperations Specialist: Jodi KemperCover Designer: Alan ClementsManaging Editor: Kristy HartSenior Project Editor: Lori LyonsCopy Editor: Karen AnnettProofreader: Debbie WilliamsIndexer: Erika MillenSenior Compositor: Gloria SchurickManufacturing Buyer: Dan Uhrig 2014 by Nada R. SandersPearson Education, Inc.Upper Saddle River, New Jersey 07458For information about buying this title in bulk quantities, or for special sales opportunities (which may include electronic versions; custom cover designs; and content particularto your business, training goals, marketing focus, or branding interests), please contactour corporate sales department at corpsales@pearsoned.com or (800) 382-3419.For government sales inquiries, please contact governmentsales@pearsoned.com.For questions about sales outside the U.S., please contact international@pearsoned.com.Company and product names mentioned herein are the trademarks or registered trademarks of their respective owners.All rights reserved. No part of this book may be reproduced, in any form or by anymeans, without permission in writing from the publisher.Printed in the United States of AmericaFirst Printing June 2014ISBN-10: 0-13-380128-4ISBN-13: 978-0-13-380128-6Pearson Education LTD.Pearson Education Australia PTY, Limited.Pearson Education Singapore, Pte. Ltd.Pearson Education Asia, Ltd.Pearson Education Canada, Ltd.Pearson Educación de Mexico, S.A. de C.V.Pearson Education—JapanPearson Education Malaysia, Pte. Ltd.Library of Congress Control Number: 2014934904
This book is dedicated to the reader.With knowledge and understanding,we can make our enterprising efforts moreefficient, effective, and intelligent.
This page intentionally left blank
ContentsForeword . . . . . . . . . . . . . . . . . . . . . . . . . . . . . . . . . . . . viiiPart I:“Big” Data Driven Supply ChainsChapter 1A Game Changer . . . . . . . . . . . . . . . . . . . . . . . . . . . . . . . .3Chapter 2Transforming Supply Chains. . . . . . . . . . . . . . . . . . . . . .23Chapter 3Barriers to Implementation. . . . . . . . . . . . . . . . . . . . . . .43Part II:Impact on Supply Chain LeversChapter 4Impact on “Sell”. . . . . . . . . . . . . . . . . . . . . . . . . . . . . . . .61Chapter 5Impact on “Make” . . . . . . . . . . . . . . . . . . . . . . . . . . . . . .85Chapter 6Impact on “Move” . . . . . . . . . . . . . . . . . . . . . . . . . . . . .109Chapter 7Impact on “Buy” . . . . . . . . . . . . . . . . . . . . . . . . . . . . . .131Part III:The FrameworkChapter 8The Roadmap . . . . . . . . . . . . . . . . . . . . . . . . . . . . . . . . .155Chapter 9Making It Work . . . . . . . . . . . . . . . . . . . . . . . . . . . . . . .181Chapter 10Leading Organizational Change . . . . . . . . . . . . . . . . . .209Endnotes . . . . . . . . . . . . . . . . . . . . . . . . . . . . . . . . . . . .229Index . . . . . . . . . . . . . . . . . . . . . . . . . . . . . . . . . . . . . . . .249
Table of ContentsPart I:“Big” Data Driven Supply Chains . . . . . . . . . . . . 1Chapter 1A Game Changer .31.1 Big Data Basics . 51.2 What Is Different? . 101.3 What Does It Mean? . 131.4 Transformations . 181.5 Data-Driven Supply Chains . 21Chapter 2Transforming Supply Chains .232.1 Across the Entire Supply Chain . 242.2 The Supply Chain System . 252.3 From Sourcing to Sales. 302.4 Coordinated and Integrated . 362.5 The Intelligent Supply Chain . 37Chapter 3Barriers to Implementation .433.1 Why Isn’t Everyone Doing It? . 433.2 The Barriers . 463.3 Breaking Ahead of the Pack . 56Part II:Impact on Supply Chain Levers . . . . . . . . . . . . . 59Chapter 4Impact on “Sell” .614.1 Driving the Supply Chain . 624.2 All About the Customer . 694.3 Price Optimization . 754.4 Merchandising . 774.5 Location-Based Marketing . 784.6 The Whole Bundle . 81Chapter 5Impact on “Make” .855.1 Making the Things We Sell . 865.2 Product Design and Innovation . 935.3 Improving the Production Process . 985.4 The Digital Factory. 1035.5 Make Connects the Value Chain . 106
CONTENTSChapter 6viiImpact on “Move” .1096.1 Moving the Things We Sell . 1106.2 How Big Data Impacts Move . 1186.3 Integrating Logistics Activities . 129Chapter 7Impact on “Buy” .1317.1 Big Data and Buy . 1327.2 How Much Do You Need? . 1387.3 Outsourcing . 1437.4 Risk Management . 147Part III:The Framework . . . . . . . . . . . . . . . . . . . . . . . . . . . 153Chapter 8The Roadmap .1558.1 Lessons . 1568.2 Doing It Right . 1588.3 How It Works . 1628.4 Breaking Down Segmentation . 1648.5 Strategic Alignment . 1678.6 The Importance of Measuring . 1718.7 The Journey . 176Chapter 9Making It Work .1819.1 Strategy Sets the Direction. 1819.2 The Building Blocks. 1869.3 Following the Maturity Map . 1959.4 Sales & Operations Planning (S&OP) . 2009.5 People Making Decisions with Data . 207Chapter 10 Leading Organizational Change .20910.1 Transformation Required . 21010.2 The Four-Step Change Process . 21510.3 Leadership. 225Endnotes .229Index .249
ForewordThe surge of professional and academic interest in the topic ofbig data analytics has been similar to the gold rush—there is muchcommotion but few know where to look for the real payoff. Althoughit has long been obvious that utilizing emerging information technology is vital to remaining competitive, the nature of that technologyhas shifted in a tectonic way, and thought leadership must keep pace.Many companies have yet to leverage big data analytics to transform their supply chain operations. Many are awash in data but areunsure how to use it to drive their supply chains. Many are engagingin fragmented utilization or implementation rather than a systematicand coordinated effort. The results are isolated benefits, lack of insightand competitiveness, and supply chains plagued with inefficienciesand cost overruns. Others are unsure how to even begin, particularlysmall and medium-sized firms.Why all the confusion? The reason is that companies lack a clearroadmap for how to implement big data analytics in a meaningful andcost-effective manner.This book attempts to remedy the situation by providing a systematic framework for companies on how to implement big data analytics across the supply chain to turn information into intelligence andachieve a competitive advantage. This end-to-end perspective on theapplication of big data analytics provides a much-needed conceptualorganization to this topic while linking strategy with tactics. Furthermore, this roadmap shows organizational leaders how to implementthe type of organizational change big data analytics requires.
AcknowledgmentsI am most grateful to my family—especially my parents, whotaught me how to create order out of chaos, and convey with clarity.I would also like to thank all the professionals who shared theirexperiences and provided insights into this work. Special thanks goesto Jeanne Glasser Levine at Pearson, as well as the other talented staffat Pearson who have contributed work to this book.
About the AuthorNada R. Sanders, Ph.D., is Distinguished Professor of SupplyChain Management at the D’Amore-McKim School of Business atNortheastern University, and she holds a Ph.D. from the Ohio StateUniversity. She is an internationally recognized thought leader andexpert in forecasting and supply chain management. She is authorof the book Supply Chain Management: A Global Perspective andis coauthor of the book Operations Management, in its 5th edition.She was ranked in the top 8 percent of individuals in the field ofoperations management from a pool of 738 authors and 237 differentschools by a study of research productivity in U.S. business schools.Nada is a Fellow of the Decision Sciences Institute, and has servedon the Board of Directors of the International Institute of Forecasters(IIF), Decision Sciences Institute (DSI), and the Production Operations Management Society (POMS). Her research focuses on themost effective ways for organizations to use technology to achieve acompetitive advantage.
This page intentionally left blank
1A Game ChangerThe era of radically different competition is here. It is a tsunamithat has transformed entire industries and left numerous casualties inits wake. Like Gutenberg’s invention of the printing press changingthe world through printing, the move toward big data is creating anequally tectonic shift in business and society. Transform or be leftbehind.Consider the fate of Borders.1 In l971, the company opened itsfirst store in Ann Arbor, Michigan, when the book industry was a different place. In 2011, 40 years later, the bookstore chain closed itsdoors. So, what happened? Borders fell behind the curve on embracing the Web and the digital world of data. Not understanding that therules of the game had changed, Borders had outsourced its onlinebookselling to Amazon.com. So any time you visited Borders.com,you were redirected to Amazon. Playing by the old rules made thisseem like a smart decision. In the new world, however, there was aproblem.To jump on the tails of Amazon and leverage its competitive priorities did not take into account that playing in the digital world wasthe competitive priority. Relinquishing control to another companywould simply cut into the company’s customer base. Also, not understanding that the world was now a digital place, Borders did notembrace e-books, like Amazon and Barnes & Noble. Walking intoBorders was like walking into a bookstore of yesteryear. The outcomewas predictable.The competitive world Borders lived in was one where booksellers tracked which books sold and which did not. Loyalty programs3
4BIG DATA DRIVEN SUPPLY CHAIN MANAGEMENTcould help tie purchases to individual customers. That was about it.Then shopping moved online. The ability to understand and trackcustomers changed dramatically. Online retailers could track everyaspect of what customers bought. They could track what customerslooked at, how they navigated through the site, how long they hoveredover a site, and how they were influenced by promotions and pagelayouts. They were now able to develop microsegments of individualcustomers and groups based on endless characteristics. They couldthen create individually targeted promotions. Then algorithms weredeveloped to predict what books individual customers would like toread next. These algorithms were self-teaching and performed betterevery time the customer responded to a recommendation. Traditionalretailers like Borders simply couldn’t access this kind of information.They could not compete in a timely manner.And Amazon? With its Kindle e-book readers and convincinghundreds of publishers to release their books on the Kindle format,the company has cornered the market. It has “datafied” books—turning them into quantified format that can be tabulated and analyzed.2This allows Amazon everything from recommending books to usingalgorithms to find links among the topics of books that might not otherwise be apparent. Embracing the digital age, technology, and datadriven decisions, the company is moving well beyond wanting to bethe biggest bookstore on the Internet. It is moving toward being themost dominant retailer in the world. Amazon understands that thismeans using big data and technology to manage its entire supply chainin a synchronized manner. In fact, Jeff Bezos, Amazon’s CEO, isknown for demanding rigorous quantification of customer reactionsbefore rolling out new features.3 Data and technology have been usedto coordinate everything from customer orders to fulfillment, inventory management, labor, warehousing, transportation, and delivery.Amazon is not the only one. Leading-edge companies across theglobe have scored successes in their use of big data. Consider Walmart,Zara, UPS, Tesco, Harrah’s, Progressive Insurance, Capital One,Google, and eBay.4 These companies have succeeded in this gamechanging environment by embracing and leading the change. They
CHAPTER 1 A GAME CHANGER5have used big data analytics to extract new insights and create newforms of value in ways that have changed markets, organizations, andbusiness relationships.1.1 Big Data BasicsTo fully understand the impact of big data analytics, we first needto have a clear idea of what it actually is. In this section we explainbig data basics. We define the key concepts of big data analytics andexplain how these concepts find novel applications across business.This will set up the book’s subsequent discussions of big data analyticsapplications in supply chain management.1.1.1 Big DataBig data is simply lots of data. The term big data specifically refersto large data sets whose size is so large that the quantity can no longer fit into the memory that computers use for processing. This datacan be captured, stored, communicated, aggregated, and analyzed.5There is no specific definition of the size of big data, such as the number of terabytes or gigabytes. The reason is that this is a moving target.Technology is advancing over time and the size of data sets that areconsidered big data will also increase.As the volume of data has grown, so has the need to revamp thetools used for analyzing it. That is how new processing technologieslike Google’s MapReduce and its open source equivalent, Hadoop,were developed. These new technologies enable companies to manage far-larger quantities of data than before. Most important, unlikein the past, this data does not need to be placed in neat rows andcolumns as traditional data sets to be analyzed by today’s technology.Big data comes in different forms. It includes all kinds of datafrom every source imaginable. It can be structured or unstructured.It can be a numerical sequence or voice and text and conversation.It can come in the form of point-of-sale (POS), radio-frequency
6BIG DATA DRIVEN SUPPLY CHAIN MANAGEMENTidentification (RFID), or Global Positioning System (GPS) data,or it can be in the form of Twitter feeds, Facebook, call centers, orconsumer blogs. Today’s advanced analytical tools allow us to extractmeaning from all types of data.1.1.2 AnalyticsAnalytics is applying math and statistics to these large quantities of data. When we apply math and statistics to big data—oftencalled big data analytics—we can gain insights into the world aroundus unlike ever before. We can infer probabilities or likelihoods thatsomething will happen.We are used to this in our everyday life. We are accustomed toe-mail filters that estimate the likelihood that an e-mail message isspam or that the typed letters teh are supposed to be the. The key isthat these systems perform well because they are fed with lots of dataon which to base their predictions. Moreover, the systems are built toimprove themselves over time, by keeping tabs on the best signals andpatterns to look for as more data is fed in. Think about “teaching” youre-mail filter that a type of e-mail is a spam by labeling similar e-mails.It is through big data that Walmart learned that customers preferto stock up on the sugary treat Pop-Tarts during a hurricane,6 eBayidentified which Web designs generate the highest sales,7 and Progressive Insurance learned how to optimize insurance premiums byrisk category.8Even small companies have benefited. Consider the online musicequipment retailer The Musician’s Friend. Using basic analytics, thecompany was able to compare different versions of its Web page toidentify customer preferences. The preferred site generated a 35percent increase in sales over the original home page. This simplechange resulted in a measurable improvement on return on investment (ROI).9
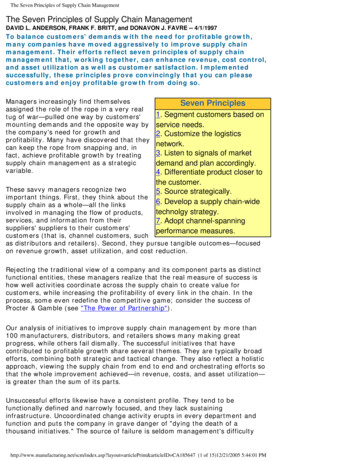
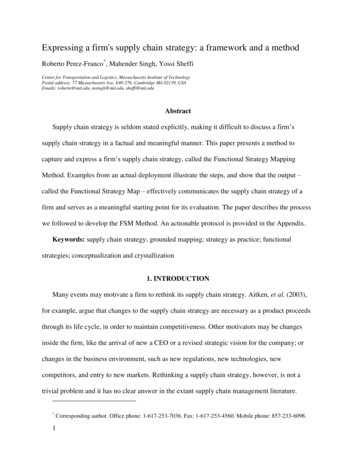
CHAPTER 1 A GAME CHANGER71.1.3 Big Data and Analytics: The Perfect DuoTo set the record straight, big data without analytics is just lotsof data. We’ve been accumulating a lot of data for years. Analyticswithout big data is simply mathematical and statistical tools and applications. Tools such as correlation and regression, for example, havebeen around for decades. In fact, Google’s director of research, PeterNorvig, explained it well by saying: “We don’t have better algorithms.We just have more data.”10However, it is the combination that makes the difference. It isthrough the combination of big data and analytics that we can get thereally meaningful insights and turn information into business intelligence (see Figure 1.1). Also, big data and analytics build on eachother. Continued application of even simple analytical tools resultsin their improvement, refinement, and sophistication. Consider thatas you increasingly identify the number of e-mails as spam, the filter“learns” and becomes better at correctly identifying spam. It is forthis reason we use the term big data analytics throughout this book torefer to the application of analytics to these large data sets.ANALYTICS INTELLIGENCEBIG DATAFigure 1.1 Turning information into intelligence
8BIG DATA DRIVEN SUPPLY CHAIN MANAGEMENT1.1.4 New Computing PowerHow can companies extract intelligence out of these huge amountsof data? This is made possible through today’s massive computingpower available at a lower cost than ever before. Large data, coupledwith larger and more affordable computing power, means that youcan do on a larger scale that which cannot be done on a smaller one.Improvements in computing have resulted in large advances in capability. This has enabled high-level analytics to be performed on theselarge and unstructured data sets.Processing power has increased over the years just as predictedby Moore’s law.11 The law is named after Intel cofounder Gordon E.Moore and states that the amount of computing power that can bepurchased for the same amount of money doubles about every twoyears. This law has proven correct. We have seen computers becoming faster and memory more abundant. Similarly, storage space hasexpanded through cloud computing, which refers to the ability toaccess highly scalable computing resources through the Internet.Cloud computing is often available at a lower cost than that requiredfor installation on in-house computers. This is because resources areshared across many users. Further, the performance of the algorithmsthat drive so many of our systems has also increased. Therefore, thegains from big data are a combination of the size of current data setscoupled with rapidly increasing processing capability and improvedalgorithms.Hadoop is an open source technology platform that has receiveda great deal of buzz as it was designed to solve problems with lotsof data. In fact, Hadoop was specifically designed to deal with bigdata that is a mixture of complex and structured data that does notfit nicely into tables. It was originated by Google for its own use forindexing the Web and examining user behavior to improve performance algorithms. Yahoo! then furthered its development for enterprise purposes. Hadoop uses distributed applications across manyservers. The database is distributed over a large number of machines.Spreading data over multiple machines greatly improves computing capability. Because the tables are divided and distributed into
CHAPTER 1 A GAME CHANGER9multiple servers, the total number of rows in each table in each database is reduced. This reduces index size and substantially improvessearch performance. The database is typically divided into partitionscalled database shards. A database shard can be placed on separatehardware and multiple shards can be placed on multiple machines.Database shards significantly improve performance. The segment ofthe database placed on a shard can be based on real-world segmentation. This can greatly help analysis—such as separating Canadiancustomers versus American customers. This makes it especially easyto query a particular segment of the data or evaluate comparisonsacross segments.1.1.5 New Problem SolvingJust a few years ago, the topic of analytics and computing powerwould have concerned only a few data geeks. Today, however, bigdata is an imperative for all business leaders across every industry andsector—from health care to manufacturing. The ability to capture,store, aggregate, and combine data—and then perform deep analyses—has now become accessible to virtually all organizations. Thiswill continue as costs of computing power, digital storage, and cloudcomputing continue to drop. These advancements will further breakdown technology barriers and level the playing field, especially forsmall and medium-sized firms. Just consider that today an individualcan purchase a disk drive with the capacity to store all of the world’smusic for less than 600.12 In fact, the cost of storing a terabyte of datahas fallen from 1 million in the l970s to 50 today.13What does this mean for business? Simply put, increasinglysophisticated analytical techniques combined with growing computerhorsepower mean extracting unparalleled business insights. It meansnew and revolutionary problem-solving capability. Big data is notabout the data itself. It is about the ability to solve problems betterthan ever before. And now pretty much everyone can do it.
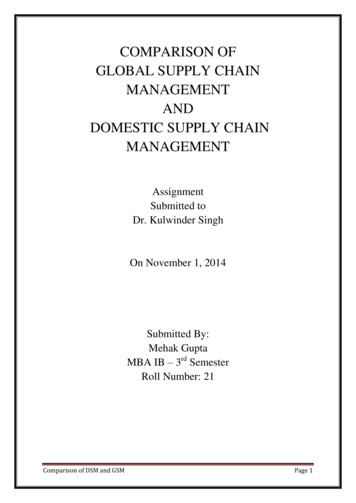
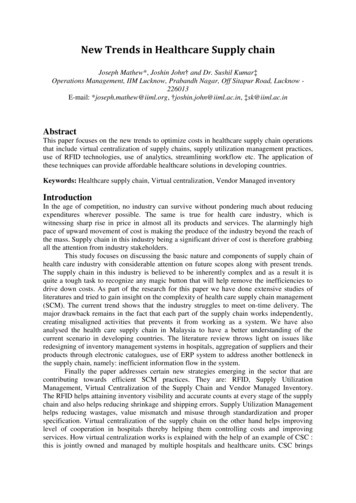
10BIG DATA DRIVEN SUPPLY CHAIN MANAGEMENT1.2 What Is Different?Companies have been capturing data for years and conductinganalysis to gain market intelligence. It is natural to wonder whatexactly is different today.The difference is scale. This scale is in terms of the amount ofdata and the computing capability to analyze it. Combined, these elements can offer objective, evidence-based insights into virtually everyaspect of a business. This has created a new level of competitivenessand the opportunity for companies to use this intelligence as a competitive advantage. We are living through a data explosion. Accordingto a recent New York Times article, “Data is a vital raw material of theinformation economy, much as coal and iron ore were in the Industrial Revolution. But the business world is just beginning to learn howto process it all.”14The three characteristics of big data—volume, velocity, andvariety—are what make big data different from all the other datacollected in the past (see Figure 1.2).15VOLUMEVELOCITYVARIETYBIG DATAFigure 1.2 The three Vs of big data
CHAPTER 1 A GAME CHANGER111.2.1 VolumeToday’s data is huge and data is everywhere. Consider that Googlereceives more than three billion queries every day, a volume that isthousands of times the quantity of all printed material in the U.S.Library of Congress; Facebook gets more than 10 million new photos uploaded every hour; Walmart conducts a million transactions perhour; and the New York Stock Exchange (NYSE) trades 490 millionshares per day.16 The amount of data generated will continue to growexponentially. In fact, the number of RFID tags sold globally is projected to rise from 12 million in 2011 to 209 billion in 2021.17Manufacturers and retailers are collecting data all along their supply chains. This includes data from POS, GPS, and RFID data, todata emitted by equipment sensors, to social media feeds. Virtuallyall companies have information technology (IT) systems in their backoffices. The world we live in is enveloped in data. When convertingterabytes and exabytes into meaningful terms, it is estimated thatthe data that companies and individuals are producing and storing isequivalent to filling more than 60,000 U.S. Libraries of Congress.18Where is this data going? It is accumulating in large pools growinglarger by the minute. This is big data. In fact, many companies do noteven recognize the data they possess and how valuable it is. Data canbe traded or sold, and it has economic value. Data is the new asset.1.2.2 VelocityYes, the data is large. The data is growing. And it is growingrapidly.Data has become a deluge flowing into every aspect of businessand everyday life. Companies are capturing exponentially growingvolumes of transactional data. They are also capturing volumes ofinformation about their customers, suppliers, and operations. Consider that there are millions of sensors embedded in physical devicesall around us, including mobile phones, smart energy meters, automobiles, and industrial machines. These devices capture and communicate data in what is called the age of the Internet of Things.19
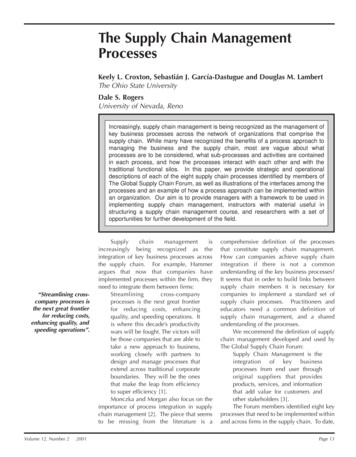
12BIG DATA DRIVEN SUPPLY CHAIN MANAGEMENTCompanies and individuals are generating a tremendous amountof digital exhaust data. This is data that is created as a by-product ofother activities and is generated just by going about everyday business. Consumers going about their day through texting, communicating, browsing, searching, and buying are creating digital trails. Thesetrails can be captured, monitored, and analyzed. Social media sites,smartphones, PCs, and laptops have enabled billions of individualsaround the world to continue adding to the amount of big data available. The growing amount of multimedia content has played a majorrole in the exponential growth in the amount of big data. In fact, eachsecond of high-definition video, for example, generates more than2,000 times as many bytes as required to store a single page of text.20Companies are collecting data with increasingly greater granularity and frequency. They can capture every customer transaction. Theycan attach increasingly personal information to these transactions. Asa result, they are collecting more information about consumer behavior in many different environments. Companies can then aggregateand disaggregate this data in infinite combinations to mathematically optimize and determine the best marketing strategies, customtailored shopping experiences, flexible and targeted product designs,and an optimized fulfillment system.1.2.3 VarietyBig data is also in every form imaginable. Most of us think of dataas numbers neatly stored in columns and rows. However, big data isin combinations of forms and this variety is growing. It is in the formof structured data that we are familiar with but may also be readingsfrom sensors, GPS signals from cell phones, and POS and RFID data.It is also unstructured, such as text and voice messages, social networks feeds, and blogs.Sources of big data are everywhere—from sensors such as RFIDand POS data at retail checkouts, to geolocation information transmitted from GPS signals, to vibration and heat sensors on equipment, tosocial media feeds (think of Twitter “re-tweets” and Facebook “likes”),
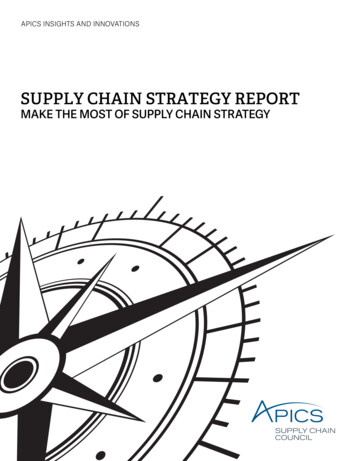
CHAPTER 1 A GAME CHANGER13to maintenance logs, to customer complaints (see Figure 1.3). Mostsmartphones have GPS capabilities that enable tracking. Cars aloneare stuffed with chips, sensors, and software that upload performancedata to the carmakers’ computers when the vehicle is serviced. Typical mid-tier vehicles now have some 40 microprocessors and electronics that account for one third of their cost.21 How else does your carmanufacturer inform you that it is time for service?WEBSITESEARCHMOBILERETAILSOCIA
have used big data analytics to extract new insights and create new forms of value in ways that have changed markets, organizations, and business relationships. 1.1 Big Data Basics To fully understand the impact of big data analytics, we first need to have a clear idea of what it actually i