Transcription
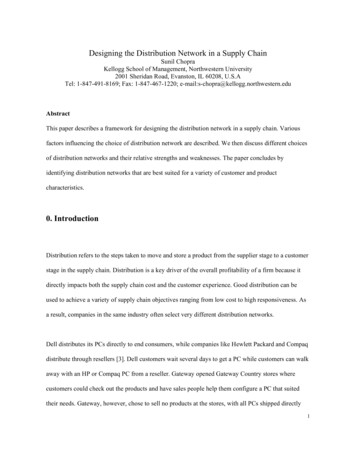
International Journal of Scientific & Engineering Research Volume 9, Issue 7, July-2018ISSN 2229-5518827Step by Step for Designing an Optimum Heat ExchangerNetworkEman M.Gabrdremangabr@hotmail.comEgyptian Petroleum Research InstituteAbstractFeatures of energy crisis became more complicated due to shortage of non- renewablesources of energy. While energy requirements increase parallel to technologyprogress. Energy researchers always apply energy targeting methodology to reduceutilities consumption. Designing a Heat Exchangers Network [HEN] by application ofpinch analysis is an effective technique for energy integration. I can say that this workis specific and simple course for designing a HEN through case study application.Where 8 alternatives Grass roots HEN designs with 66% of utilities saving areconcluded. Minimization of units and cost, process control and operability areimportant factors for choosing the suitable HEN design. Revamping of the existingprocess to maximize energy recovery with least alterations and cost took place; wherenet annual saving reached to 1,400,000 .IJSERGraphical AbstractWhat is the idea of Heat Exchanger Network?Coole rQ C 180 k wH1 0 0 ?C4 0 ?CC6 0 ?C2 0 ?CC P 3 k w/?CH1 0 0 ?C4 0 ?CC6 0 ?CCP 4 .5 kw /?CH ea t erQH 1 80 k w2 0 ?CHe a tE xc ha nge rQ 18 0 kwB efo re En er g y In te g r ati o nA fte r E n er g y In te g rat io nFigure (1) the Idea of HENThrough two streams from any processTransferring Heat Load from Source (hot stream H) to Sink (cold stream C)Replacement both Cooler and Heater by a Heat Exchanger*Corresponding author: Eman Gabr / Assistant Professor (Head Manager of Reactor Engineering andProcesses Laboratory) Egyptian petroleum Research Institute. E-mail: Dremangabr@hotmail.comIJSER 2018http://www.ijser.org
International Journal of Scientific & Engineering Research Volume 9, Issue 7, July-2018ISSN 2229-5518Index Terms: Heat recovery, Energy saving, Pinch Analysis, Minimum utilitiesHeat Exchanger Network HEN, Cost estimation, Optimum HEN.1-IntroductionAs population increase and technologydevelop; demand for energy increase whilein the same time we suffer from shortageof non-renewable sources, all these factorscomplete the energy crisis. Heat exchangernetwork (HEN) is an important techniquefor maximizing heat recovery in theindustrial chemical process and reducingexternal heating and cooling utilities.Extensive research has been done toimprove HENs design and synthesis overthe past 40 years [1].Pinch Analysis (PA); one of the mostHEN was proposed by Shenoy et al.[8].Akbarnia, Amidpour, and Shadaram[9] added piping costs to the heatexchanger capital cost which improvesthe accuracy of capital cost 'estimationand detects the optimum point fordesigning.Kravanja and Glavič [10] proposed asimultaneous optimization for HENcost targeting method based on processflow sheets using rigorous models anddetailed cost for HEN functions. Thenonlinear programming NLP model isa combination ofpinch technology and mathematicalprogramming and can be used to HENsynthesis with a large number ofstreams.Mixed-integer-linearprogramming(MILP) transportation method; wasformulated by Shethna, Jezowski, andCastillo [11] to optimize heatexchanging area, number of units andutilities load in order to achieveoptimum cost target for HEN.Reza, Reza, and Hassan [12]developed a mathematical modelwhich affected by specifications shelland tube heat exchanger (materials costoptimization of HEN.The MILP-MINLP Methodology byYee and Grossmann [13] was the basemodel for MO MINLP simultaneousflexibility and operability technique fordesigning a flexible HEN. Where thisHEN; can maximize energy recoveryIJSERmethods used to design (HEN) andintegrate heat since it introduced byLinnhoff and Flower [2] & Linnhoff andHinmarsh [3]. [Ahmad &Linnhoff andAhmad][4,5]introducedthe“Supertargeting” procedure for thedesign of near-optimal heat exchangernetworkwhichsystematicallyconsiders the energy capital trade off.This method involves searching for theoptimum approach temperature thatyields the lowest total annual cost for aHEN designing.The effect of Tmin contribution oncost was modified by Sun et al [6]where economical balance and analysisbetween the capital and operating costsfor a given Tmin took place. ialofconstruction, equipment type and rateof pressure on the HEN cost hasmodified by [Hall, Ahmad and Smith][7].A methodology for determinationoptimum loads of multiple utilities totrade- off the capital and energy cost ofIJSER 2018http://www.ijser.org828
International Journal of Scientific & Engineering Research Volume 9, Issue 7, July-2018ISSN 2229-5518829transforming the process streams intothe Composite Curves (CCs) [19].From (CCs), we can estimate theminimum external requirements of hotand cold utilities which are the nonoverlapping segments of the cold andhot composite curvesMaximum heat recovery represents in(CCs) by the overlap region betweenhot and cold composites curves. CCsplay an important role in processdesign; for designing a Heat ExchangerNetwork (HEN) directly. The GrandComposite Curved (GCC) and theProblem Table Algorithm (PTA) Whereminimum utilities and so on minimumemissions can be concluded [20].although, there is deviation of thestreams 'conditions [14, 15, and 16].2- Pinch Analysis TechniqueWe can consider the first “red” bookby Linnhoff et al. [17]; is the first stepfor prevalence of heat integration topicin research sector. This User Guide; isstill the massively cited in the literatureand is considered as the beginningoverview for energy integration.Where application of Pinch AnalysisTechnique (PAT); provides searcherswith catalogue for solving the problemof process integration. The techniqueprovedintegrationsuccessfullythrough heat exchanger networksynthesis, heat recovery targeting, andselecting multiple utilities [18].In (PAT) utilities integration andenergyrecoveryrealizedbyIJSERsaving in processes and total sites. Themethodologyisbasedonthermodynamic principles, the basisequations are:2-1 Principles of Pinch AnalysisPinch Technology provides asystematic methodology for energyCP m Cp H m Cp T CP TCP H / TTWhere:m: mass flow rateCp: specific heat (physical property)CP: Heat Capacity flow rate H: Enthalpy Change T: Temperature Change TSlope 1/CPH HFigure (2) Presentation of hot stream on T-H diagram2-2 Steps of Pinch Analysis Technique1) Identification of hot, cold, utilitystreams in the process.2) Extraction of thermal data forprocess streams and utilities.3) Selection of Initial Tmin value.4) Estimation of minimum hot andcold utilities and defining ofpinch point by: Construction ofComposite CurvesIJSER 2018http://www.ijser.org
International Journal of Scientific & Engineering Research Volume 9, Issue 7, July-2018ISSN 2229-5518 Problem Table Algorithm5) Design of Heat ExchangerNetwork [HEN].6) Estimation of minimum energycost target.7) Estimation of the capital costtarget.8) Identification of the optimum Tmin value.9) Design of the optimum HeatExchanger Network [HEN].2-3 Estimation of minimum utilitiesMaximum energy recovery for anyprocess leads to minimization of therequired external heating and coolingloads. Estimation of minimum hot andcold utilities through pinch analysis bytwo techniques (composite curve&problem table) is done as a beginningstep for HEN designing.2-3-1 construction of CompositeCurvecurve named as hot composite curve.By repeating this step with coldstreams; we get also cold compositecurve. The overlap region is the energyrecovery limits while the non overlapare the required heating and cooling.We can move composite curveshorizontally to change temperaturedifference which affects on utilities'loads and heat transfer area. Whiledetecting Tmin value is realizingmaximum energy recovery andminimum utilities [21].See Figures (3 &4)IJSERTransferring of all hot streams whichpresented in T-H diagram into onecurve depending on Summation thestreams loads of the same interval; thisFigure (3) Construction of Composite CurvesIJSER 2018http://www.ijser.org830
International Journal of Scientific & Engineering Research Volume 9, Issue 7, July-2018ISSN 2229-5518831Pinch point defined as the temperature correspondingto the shortest distance between hot and coldcomposite curvesPinchHeat RecoveryFigure (4) Definition of Pinch Point & control of Tmin by sliding cold composite curve2-3-2 Problem TableIt is an analytical method forestimation of minimum utilities and itsadvantage no need for especial utensilas graph paper and scissor.Steps of problem table method: Divide the process into intervals Limits of intervals are shiftedtemperatures(hotstreamstemperatures – 1/2 Tmin) & (coldstreams temperatures 1/2 Tmin ) Schematic representation of thestreams with a vertical temperaturescale took place through intervalboundaries (shifted temperaturesSi).See Figure (5) Enthalpy balances of every intervali, limited by shifted temperatures(Si & Si 1) can easily be calculatedas:namedinterval caseas"surplus" while the negativenamed as "deficit" to produce afeasible network design basedon the assumption that all"surplus" intervals rejected heatto cold utility, and all "deficit"intervals took heat from hotutility.Beginning of external heatingof zero and accumulating ofintervals loads ascending todefine the highest deficit valuewhich represent minimum hotutility (QH).Cascading the process intervalwith (QH) with accumulating ofintervals loads will finalconclude minimum cold utility(QC) which is the load of lastinterval [22]IJSER ΔHi (Si–Si 1) ( CPHot – CPCold)i The positive magnitude ofenthalpy balance equationIJSER 2018http://www.ijser.org
International Journal of Scientific & Engineering Research Volume 9, Issue 7, July-2018ISSN 2229-5518hiSi (Thin – 1/2 Tmin)832ThinSi 1 (TCout 1/2 Tmin)TCoutSi 2 (Thout - 1/2 Tmin)ThoutSi 3 (TCin 1/2 Tmin)TCinCjFigure (5) Vertical Representation of Streams on Shifted Temperatures Intervals3- Design of Heat Exchanger NetworkAfter classification the process intostreams with its thermal and physicalproperties, estimation of minimumutilities and defining pinch point.Now we can begin the more interestingpart which is HEN designing. Thepinch separates the process into twosubnetwork designs; above and belowpinch.To achieve maximum energyrecovery we must apply these nextsteps:1. Do not transfer heat across thepinch point.2. Do not use hot utility below thepinch point.3. Do not use cold utility above thepinch point.4. Begin with pinch match and moveaway.5. Pinch matches obey this rule: CPhot CPcold (above pinch) CPhot CPcold (below pinch)IJSERAlgorithm of HEN designing is shown in Fig. 6Figure (6) Sequences for designing HEN above pinch (a) and below pinch (b)IJSER 2018http://www.ijser.org
International Journal of Scientific & Engineering Research Volume 9, Issue 7, July-2018ISSN 2229-55188334- Economic Analysis of HEN DesignBy applying pinch analysis technique,we can get many alternative designsfor the same process. Economicbalancing by cost estimation of everydesign helps us to reach to theoptimum one.Cost Estimation Equations are:Ann.Overall Cost of HEN Ann.Capital Cost Ann.Operating Costv Capital cost:Ann.Capital Cost Capital cost of Units / life timeCapital cost of unit ƒ [A] (A Ξ heat transfer area)A Q / U * ΔTlmWhere:Q heat load of the unit1 / U 1 / hi 1 / hj . (hΞ heat transfer coefficient)ΔTlm (T1 – t2) – (T2 – t1) /ln (T1 – t2) / (T2 – t1)Life time 6 yearsCost of piping 8% Installed cost of EquipmentT1it2jT2t1IJSEREffect of Tmin on heat transfer area and capital cost is shown as next diagram: Capital cost affected by number of units and minimum number of units for anyHEN can be estimated by next equation:Nmin Nh Nc Nu -1Where:Nmin Minimum Number of UnitsNh Number of hot streamsNc Number of cold streamsNu Number of utilitiesv Operating CostNuTotal Operating Cost Qu * Cuu 1Where:Qu Duty of utility U, kWIJSER 2018http://www.ijser.org
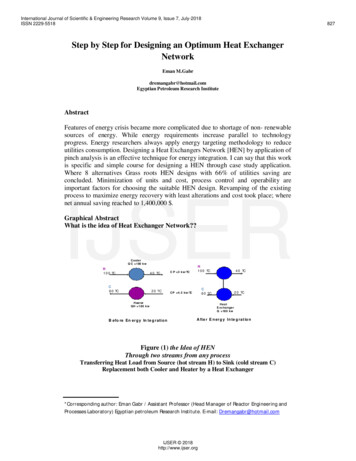
International Journal of Scientific & Engineering Research Volume 9, Issue 7, July-2018ISSN 2229-5518834Cu Unit cost of utility U, / KW.yrNu Total Number of utilities5- Application of Pinch Analysis Technique on a case studyI applied Pinch technique on a casestudy with a plant flowsheet shown inFigure (7). Where: Classification the process into streamswith its thermal and physical propertiesis shown in table (1)As a beginning for HEN design Irepresent the streams in the form ofgrid diagram as shown in Figure (8)where the actual consumption ofexternal utilities is:Heating load 14000 KwCooling load 13800 KwCost of hot utility 140.2 / KW.yrCost of cold utility 7.1 / KW.yrThe feed is heated to the reactiontemperature.The reactor effluent is furtherheated, and the products areseparated in a distillation column.The reboiler and condenser useexternal utilities for controlpurposes.The overhead and bottomsproducts are cooled and sent forfurther processing.IJSER20 ᵒCHC160 ᵒCOverheadProductH1ReactorReactor FeedC1C260 ᵒC20ᵒCColumn180ᵒC120 ᵒCReactor EffluentC2HH280ᵒCBottomProductH2C60ᵒCFigure (7) A Typical Plant Flowsheet of the case studyIJSER 2018http://www.ijser.org
International Journal of Scientific & Engineering Research Volume 9, Issue 7, July-2018ISSN 2229-5518835Table (1): Streams data of the case studyHot Pinch(150 ̊C)CPKW / ̊CIJSERH1H2Over headproduct180 ̊CBottomproduct280 ̊CCQ 7200 KWC20 ̊C4560 ̊C30Q 6600 KW160 ̊CH20 ̊CReactorFeedC1 40120 ̊CReactoreffluentC2 60Q 5600 KW260 ̊CHQ 8400 KWCold Pinch(120 ̊C)Actual Cooling Load 13800 KWActual Heating Load 14000 KWFigure (8) Grid Diagram of the Flowsheet5-1 Estimation of Minimum Hot and Cold Utilities With Tmin of 30ᵒC; minimum hot and cold utilities of the process estimated bygraphical composite curve as shown in Figure (9).Where [QHmin 4750 KW, QCmin 4550 KW, Thp 150 ᵒC and Tcp 120ᵒC] The Analytical problem table method got the same results of minimum utilitiesand pinch point as shown in Figures (10, 11) and Table (2)IJSER 2018http://www.ijser.org
International Journal of Scientific & Engineering Research Volume 9, Issue 7, July-2018ISSN 2229-5518836Qhmin4750 KWTemperature C300250200Pinchpoint150Thp 150 CTmin 30 CTcp 120 C10050Qcmin4550 KW0050001000015000Enthalpy KW20000Figure (9) Estimation of Minimum Utilities by Composite CurveIJSERTB ̊CTt 260 ̊C̊27526517516513545355TB Si Th – ½TB Si Tc ½12567Ts 120 ̊̊CC2CP 60290CP 30H2Ts 280 ̊CTt 160 ̊C34TB ½ Tmin C280CP 45H1Ts 180 ̊C190180150Tt 60 ̊CTs 20 ̊CC1CP 406050Tt 20 ̊C20TminTminFigure (10) Representation of Streams on Boundary IntervalsIJSER 2018http://www.ijser.org
International Journal of Scientific & Engineering Research Volume 9, Issue 7, July-2018ISSN 2229-5518837Table: (2) Definition and Calculation of Enthalpy Change for Every IntervalTemperature T̊C275IntervalNOTi - Ti 1 CPcold - CPhotΔHiSurplus us730-45-135026517516513545355surplusIJSER275 ̊ C265QHmin 4750 KWO KWΔH 600KWΔH ch point135Thp 150 CTcp 120 15503200-1350-1350QCmin 4550 KW-200Figure (11) Estimation of minimum Utilities by Problem Table Algorithm through heat CascadePrinciple5-2 Designing of Subnetworks for the Case StudyBy applying pinch technique sequencesfor HEN designing as mentionedbefore in text 3, four subnetworksalternatives are concluded .Two abovePinch. See Figures (12-a) & (12-b) andthe other two subnetworks weredesigned below pinch point. SeeFigures (12-c) & (12-d).IJSER 2018http://www.ijser.org
International Journal of Scientific & Engineering Research Volume 9, Issue 7, July-2018ISSN 2229-5518CPKW/ ̊C45H130H2Thp 150 ̊ C1350 KW180 ̊C2301 KW280 ̊C203.3 ̊C60CPKW/ ̊CH1Pinchmatch30H2 280 ̊CThp 150 ̊ C1350 KW180 ̊C451600 KW3901 KWPinchmatchCPhot CPcold160 ̊ C40838CPhot CPcoldC1260 ̊C180.85 ̊C142.5 ̊ CC240160 ̊ C60250 KW260 ̊C185. ̊CTcp 120 ̊̊ CQHmin 4750 KW153.75 ̊C4500 KWC1C2Tcp 120 ̊̊ CQhmin 4750 KWFigures (12-a) & (12-b) Subnetworks above pinchThp 150 ̊C4550 KW1300 KWPinchmatch20 ̊ C121.11 ̊C2700 KW60̊ CCPhot CpcoldCP KW/ ̊̊ CThp 150 ̊CPinchmatch451850 KW4000 KW20 ̊ C61.1 ̊C2700 KW3060 ̊ CCPhot Cpcold20 ̊ CTcp 120 ̊CC14020̊ C C1Qc min 4550Tcp 120 ̊CCP KW/ ̊̊̊ C453040Qcmin 4550 KWFigures (12-c) & (12-d) Subnetworks below pinchIJSER5-3 Synthesis of HEN Designs by Subnetworks CombinationBy combination between every two subnetworks (above –below); I got fouralternatives HEN designs for the case study, Figures (13-a, 14-a, 15-a, and 16-a). Allthe designs achieved minimizing of utilities but differed in matching and number ofunits. As a result of combination; loops appear due to match repeating between thesame streams as represented in Figures by purple dashed line. In this case;modification of design by breaking the loop is required by replacement the 2 H.E with1 to minimize the units 'number and so on reduce capital cost as shown in Figures (13–b, 14-b, 15-b and 16-b) .The summary of the economic analysis of the modifieddesigns is shown in table (3); where HEN of Fig.15-b has the least cost.Thp 150 ̊CCP KW/ ̊C45301350 KW180 ̊CH1H22301 KW280 ̊C40160 ̊ C60260 ̊C4550 KW1300 KW203.3 ̊C2700 KW1600 KWQcmin 4550 KW180.85 ̊C20 ̊ C121.11 ̊C60 ̊ C20 ̊ CC1CP KW/ ̊̊ C453040142.5 ̊̊ CNo of Units 7QHmin 4750 KWQCmin 4550 KWTcp 120 ̊CNo of Units 7Figure (13- a) First alternative HEN design, combination between (12-a) and (12-d)IJSER 2018http://www.ijser.org
International Journal of Scientific & Engineering Research Volume 9, Issue 7, July-2018ISSN 2229-5518CP KW/ ̊C1350 KW180 ̊C45H130H2 280 ̊C40160 ̊ C60260 ̊C8394550 KW1300 KW20 ̊ C121.11 ̊C4300 KW2301 KW60 ̊ C203.3 ̊C20 ̊ C142.5 ̊ C180.85 ̊CC1C2QHmin 4750 KWQCmin 4550 KWNo of Units 6Figure (13-b) First alternative HEN design after loop breakingThp 150 ̊ CCP KW/ ̊C180 ̊C45H130H21350 KW1850 KW4000 KW20 ̊ C61.1 ̊CIJSER40160 ̊ C60250 KW260 ̊C185. ̊C2700 KW3901 KW280 ̊C60 ̊ C20 ̊ C153.75 ̊CC24500 KWTcp 120 ̊ CC1No of Units 7QH min 4500 250 4750 KWQc min 2700 1850 4550 KWFigure (14-a) Second alternative HEN design, combination between (12-b) and (12-c)CP KW/ ̊C4530H2160 ̊ C60250 KW260 ̊C185. ̊C20 ̊ C61.1 ̊C2700 KW3901 KW280 ̊C401850 KW5350 KW180 ̊CH1153.75 ̊C60 ̊ C20 ̊ C120 ̊ CC24500 KWFigure (14-b) Second alternative HEN design after loop breakingIJSER 2018http://www.ijser.orgC1No of Units 6QHmin 4500 250 4750 KWQc min 2700 1850 4550 KW
International Journal of Scientific & Engineering Research Volume 9, Issue 7, July-2018ISSN 2229-5518840Thp 150 ̊CCP KW/ ̊C1350 KW180 ̊C45H130H240160 ̊ C60250 KW260 ̊C185. ̊C20 ̊ C121.11 ̊C2700 KW3901 KW280 ̊C4550 KW1300 KW60 ̊ C153.75 ̊C20 ̊ CC24500 KWC1No of Units 7QH min 4500 250 4750 KWQc min 4550 KWTcp 120 ̊CFigure (15-a) Third alternative HEN design, combination between (12-b) and (12-d)CP KW/ ̊C45H130H24550 KW2650 KW180 ̊C20 ̊ C121.11 ̊C2700 KW3901 KW280 ̊C60 ̊ CIJSER40160 ̊ C60250 KW260 ̊C185 ̊C20 ̊ C153.75 ̊CC2C1No of Units 6QHmin 4500 250 4750 KWQcmin 4550 KW4500 KWFigure (15-b) Third alternative HEN design after loop breakingThp 150 ᵒCCP KW/ ̊C1350 KW180 ̊C45H130H22301 KW280 ̊C40160 ̊ C60260 ̊C203.3 ̊C1850 KW4000 KW20 ̊ C61.1 ̊C1600 KW2700 KW60 ̊ C20 ̊ C180.85 ̊C142.5 ̊ C4750 KWQHmin 4750 KWQCmin 1850 2700 4550 KWNo of Units 7Thp 120 ᵒCFigure (16-a) Fourth alternative HEN design, combination between (12-a) and (12-c)IJSER 2018http://www.ijser.orgC1
International Journal of Scientific & Engineering Research Volume 9, Issue 7, July-2018ISSN 2229-55181600 KW5600 KWCP KW/ᵒCH45H130H24084155.6 ᵒC180 ᵒC20 ᵒC3651 KW158.3 ᵒC280 ᵒC60 ᵒC2950 KW160 ᵒC180.6 ᵒC260 ᵒC60120 ᵒC20 ᵒCC1C2QHmin 4750 KW, QCmin 4550 KW, NO of Units 54750 KWFigure (16-b) Fourth alternative HEN design after loop breakingTable (3) Economic Analysis of the HEN DesignsCapital Cost /yCapital Cost*C.I /yCost of Hotutility /yCost of Coldutility /yOperating Cost /yOverall Cost /yFigure 13-bFigure 14-bFigure 15-bFigure 34338392208800575-4 Revamping of the Case Study through Heat Recovery TechniqueAs a new design (grass-root) for the case study; all the last alternatives HEN designscan be used according to availability and operability conditions. While the revampingtechnique depends on choosing the least alterations HEN design compared to theexisting. That's guarantees minimizing added capital cost. So The HEN design ofFigure (14-b) is our pivot for existing process revamping. The modification is onlyadding two heat exchangers represented by yellow circles as shown in Figure (17).Maximum energy recovery realized where external heating reduced from 13800 to4750 KW and external cooling reduced from 14000 to 4550 KW. The summary ofeconomic analysis due to revamping is shown in Table (4); where the net saving isaround 1,400,000 /yIJSER 2018http://www.ijser.org
International Journal of Scientific & Engineering Research Volume 9, Issue 7, July-2018ISSN 2229-5518842H.E250 KW20 CH153.75 CC5350 KW160 COverheadProduct H1ReactorReactor FeedC1260ºCH.EColumn180 C120 ºCReactor EffluentC21850 KWC61.1 C20 C185 ºCH4500 KWH3901 KW280 ºCQHact. 13800 KW, QHmin 4750 KWQcact. 14000 KW, Qcmin 4550 KW150 ºCBottomProduct H22700 KWC60 ºCFigure (17) The flowsheet of the case study after revampingIJSERTable (4) Economic Analysis for Revamping the Case studyIJSER 2018http://www.ijser.org
International Journal of Scientific & Engineering Research Volume 9, Issue 7, July-2018ISSN 2229-5518ConclusionThis study is a summary of pinch analysis to design Heat Exchanger Network HENstep by step. Designing of HEN is an effective technique for maximizing energyrecovery and so on minimizing external utilities. It's proved its validity throughapplication on a case study where percentage of utilities' saving reached to (65% &68%) for hot utility and cold utility respectively. The process revamping got excellentresults where maximization of saving realized by least alterations represented inadding two heat exchangers and the net annual saving reached to 1,382,893 which isgreat.RecommendationThis technique is recommended for any chemical process where energy saving is aninternational target for all countries (rich or poor). We need to reduce energyconsumption to save money and protect environment.AcknowledgmentThe author acknowledges Egyptian Petroleum Research Institute for continuouslysupport.IJSERNomenclatureQhmin: Minimum hot utility (kW)Qcmin: Minimum cold utility (kW) Tlm: Minimum temperature difference log meanThp: hot pinch point (ᵒC)Tcp: cold pinch point (ᵒC)TB: Boundary temperature (ᵒC)Ts: Supply temperature (ᵒC)Tt: Target temperatureA: heat exchanger area (m2)hi: heat transfer coefficient of hot stream (kW/m2 ᵒC)hj: heat transfer coefficient of cold stream (kW/m2 ᵒC)U: Overall heat transfer coefficient (kW/m2 ᵒC)Nmin Minimum Number of UnitsNh Number of hot streamsNc Number of cold streamsNu Number of utilitiesH: enthalpy (kW)CP: heat capacity flow rate (kW/ᵒC)T1: Inlet temperature of hot stream (ᵒC)T2: outlet temperature of hot stream (ᵒC)t1: inlet temperature of cold stream (ᵒC)t2: outlet temperature of cold stream (ᵒC) Tmin: minimum temperature difference approachReferences:1-Suraya Hanim Abu Bakar, Mohd. Kamaruddin Abd. Hamid, Sharifah Rafidah Wan Alwi,Zainuddin Abdul Manan. Selection of minimum temperature difference ( T min) for heatexchanger network synthesis based on trade-off plot. Applied Energy , 2015.IJSER 2018http://www.ijser.org843
International Journal of Scientific & Engineering Research Volume 9, Issue 7, July-2018ISSN 2229-55182- Linnhoff B, Flower JR. Synthesis of heat exchanger networks: I. Systematicgeneration of energy optimal networks. AIChE J 1978; 24:633–42.3- Linnhoff, B.,Hindmarsh,E.,1983.The pinch design method for heat exchangernetworks.Chem.Eng.Sci.38,745–763.4- Ahmad, S. (1985). Heat exchanger networks: Cost trade-offs in energy andcapital. PhD Thesis, UMIST, UK.5- Linnhoff, B., & Ahmad, S. (1990). Cost optimum heat exchanger networks-1.Minimum energy and capital using simple models for capital cost. Computers &Chemical Engineering, 14, 729–750.6- Sun KN, Wan Alwi SR, Manan ZA. Heat exchanger network cost optimization consideringmultiple utilities and different types of heat exchangers. Comput Chem. Eng 2013;49:194–204.7- Hall, S. G., Ahmad, S., & Smith, R. (1990). Capital cost targets for heat exchangernetworks comprising mixed materials of construction, pressure ratings and exchangertypes. Computers & Chemical Engineering, 14(3), 319–335.IJSER8- Shenoy, U. V., Sinha, A., & Bandyopadhyay, S. (1998). Multiple utilities targetingfor heat exchanger networks. Transactions of IChemE, 76(Part A), 259–272.9- Akbarnia, M., Amidpour, M., & Shadaram, A. (2009). A new approach in pinchtechnology considering piping costs in total cost targeting for heat exchanger network.Chemical Engineering Research and Design, 87, 357–365.10- Kravanja, Z., & Glavič, P. (1997). Cost targeting for HEN through simultaneousoptimization approach: A unified pinch technology and mathematical programmingdesign of large HEN. Computers & Chemical Engineering, 21(8), 353–833.11- Shethna, H. K., Jezowski, J. M., & Castillo, F. J. L. (2000). A new methodologyfor simultaneous optimization of capital and operating cost targets in heat exchangernetwork design. Applied Thermal Engineering, 20(15–16), 1577–1587.12- Reza, H., Reza, M., & Hassan, O. M. (2004). Cost effective heat exchangernetwork design with mixed materials of construction. Iranian Journal of Chemistryand Chemical Engineering, 23(2), 89–100.13- Yee, T.F., Grossmann, I.E., Simultaneous optimization of models for heatintegration. II. Heat exchanger network synthesis. Computers and ChemicalEngineering 14 (10), (1990), 1165–1184.14- Konukman, A., C amurdan, M., Akman, U., Simultaneous flexibility targeting andsynthesis of minimum-utility heat-exchanger networks with superstructure-based MILPformulation. Chemical Engineering and Processing 41 (6), (2002), 501–518.IJSER 2018http://www.ijser.org844
International Journal of Scientific & Engineering Research Volume 9, Issue 7, July-2018ISSN 2229-551815- Verheyen, W., Zhang, N., Design of flexible heat exchanger network for multi-periodoperation. Chemical Engineering Science 61 (23), (2006), 7730–7753.16- EL-Temtamy, S. A., Gabr, E. M., Design of optimum flexible heat exchangernetworks for multiperiod process. Egyptian Journal of Petroleum 21, (2012), 109–11717- B. Linnhoff, D.W. Townsend, D. Boland, G.F. Hewitt, B.E.A. Thomas, A.R. Guy,R.H. Marsland, A User Guide to Process Integration for the Efficient Use of Energy.IChemE, Rugby, UK, 1982, last edition 1994.18- Friedler F. ,Process integration, modeling and optimization for energy savingand pollution reduction. Applied Thermal Engineering 30 (2010) 2270- 2280.19 - B. Linnhoff, E. Hindmarsh, The pinch design method for heat exchangernetworks. Chemical Engineering Science 38 (5) (1983) 745-763.20- D.W. Townsend, B. Linnhoff, Heat and power networks in process design.Part II: design procedure for equipment selection and process matching.AIChE Journal 29 (5) (1983) 748-771.21- B. Linnhoff, Introduction to Pinch Technology , Linnhoff March,www.linnhoffmarch.com,Copyright 1998IJSER22- Ian C Kemp, Pinch Analysis and Process Integration-A User Guide on ProcessIntegration for the Efficient Use of Energy. First edition 1982, Second edition Copyright 2007, Elsevier Ltd. All rights reservedIJSER 2018http://www.ijser.org845
Heat Exchanger Network HEN, Cost estimation, Optimum HEN. 1-Introduction As population increase and technology develop; demand for energy increase while in the same time we suffer from shortage of non-renewable sources, all these factors complete the energy crisis. Heat exchanger network (HEN) is an imp