Transcription
J Comput NeurosciDOI 10.1007/s10827-010-0303-yPassive and active shaping of unitary responsesfrom associational/commissural and perforant path synapsesin hippocampal CA3 pyramidal cellsTamara Perez-Rosello & John L. Baker &Michele Ferrante & Satish Iyengar & Giorgio A. Ascoli &Germán BarrionuevoReceived: 19 May 2010 / Revised: 17 October 2010 / Accepted: 14 December 2010# Springer Science Business Media, LLC 2010Abstract Although associational/commissural (A/C) andperforant path (PP) inputs to CA3b pyramidal cells play acentral role in hippocampal mnemonic functions, the activeand passive processes that shape A/C and PP AMPA andNMDA receptor-mediated unitary EPSP/EPSC (AMPA andNMDA uEPSP/uEPSC) have not been fully characterizedyet. Here we find no differences in somatic amplitudebetween A/C and PP for either AMPA or NMDA uEPSPs.However, larger AMPA uEPSCs were evoked fromproximal than from distal A/C or PP. Given the spaceclamp constraints in CA3 pyramidal cells, these voltageclamp data suggest that the location-independence of A/CAction Editor: Alain DestexheElectronic supplementary material The online version of this article(doi:10.1007/s10827-010-0303-y) contains supplementary material,which is available to authorized users.T. Perez-Rosello : G. BarrionuevoDepartment of Neuroscience, University of Pittsburgh,Pittsburgh, PA, USAJ. L. Baker : M. Ferrante : G. A. Ascoli (*)Center for Neural Informatics, Structure, & Plasticity,and Molecular Neuroscience Department,Krasnow Institute for Advanced Study, George Mason University,4400 University Drive, MS 2A1,Fairfax, VA 22030, USAe-mail: ascoli@gmu.eduS. IyengarDepartment of Statistics, University of Pittsburgh,Pittsburgh, PA, USAPresent Address:T. Perez-RoselloDepartment of Otolaryngology,University of Pittsburgh School of Medicine,Pittsburgh, PA, USAand PP AMPA uEPSP amplitudes is achieved in partthrough the activation of voltage dependent conductances ator near the soma. Moreover, similarity in uEPSC amplitudes for distal A/C and PP points to the additionalparticipation of unclamped active conductances. Indeed,the pharmacological blockade of voltage-dependent conductances eliminates the location-independence of theseinputs. In contrast, the location-independence of A/C andPP NMDA uEPSP/uEPSC amplitudes is maintained acrossall conditions indicating that propagation is not affected byactive membrane processes. The location-independence forA/C uEPSP amplitudes may be relevant in the recruitmentof CA3 pyramidal cells by other CA3 pyramidal cells.These data also suggest that PP excitation represents asignificant input to CA3 pyramidal cells. Implication of thepassive data on local synaptic properties is further investigated in the companion paper with a detailed computationalmodel.Keywords AMPA receptor . NMDA receptor .HippocampusAbbreviationsACSFAMPA and NMDAuEPSP/uEPSCA/CARCCCNQXCVD-APVArtificial cerebrospinal fluidAMPA and NMDA receptormediated unitary EPSP/EPSCAssociational/commissuralAdaptation ratioCurrent nt of variationD(-)-2-amino-5-phosphonopentanoicacid
J Comput ifferential interference contrastEntorhinal cortexHalf-height widthHyperpolarization-activated currentA-type potassium ion channelsMossy fiberPerforant-pathPeak valueInput resistanceStratumTime-to-peakVoltage clampVoltage-dependent conductancesMembrane voltageHolding membrane voltageMean Gaussian valueMembrane time constant1 IntroductionHippocampal area CA3 is critically involved in the rapidencoding of new contextual memories, spatial workingmemory, and in pattern separation (cf. Kesner 2007;Leutgeb et al. 2007; Rolls 2007). The implementation ofrapid encoding by area CA3 may be related to severaldistinctive connectivity features. Specifically, CA3 pyramidal cells receive two external excitatory inputs from theentorhinal cortex (EC). The most important input isconveyed monosynaptically via the PP, the axons of stellatecells in EC layer II. PP fibers make synaptic contacts onthe distal apical dendrites in str. lacunosum-moleculare(Steward 1976; Witter and Amaral 1991). The second inputfrom EC is conveyed disynaptically via the mossy fibers(MF), the axons of the dentate gyrus granule cells, which inturn receive input from the same layer II cells in EC(Steward 1976; Witter and Amaral 1991). The MF synapseis located on the apical dendrite in str. lucidum proximal tothe cell soma (Blackstad et al. 1970; Claiborne et al. 1986).Another distinctive connectivity feature of area CA3 isthat pyramidal cells receive strong recurrent (feedbackand feed-forward) excitation via the extensive network ofassociational/commissural (A/C) input from other CA3 pyramidal cells (Ishizuka et al. 1990; Li et al. 1994). A/C axonstarget both the apical dendrites in str. radiatum and basaldendrites in str. oriens (Ishizuka et al. 1990; Li et al. 1994).Pyramidal cells fire action potentials when the membrane potential reaches threshold through integration ofexcitatory synaptic responses generated at different distances from the soma. The dendritic propagation of synapticresponses is controlled, in part, by the passive cableproperties of the cell’s membrane (Jack et al. 1971; Rall1967), which attenuate the amplitude and prolong the timecourse of the synaptic waveforms. In principle, synapticresponses generated closer to the soma would have a largerimpact on the pyramidal cell firing. However, the activeproperties of the dendritic membrane also can affectsynaptic integration via activation of a wide variety ofligand- and voltage-dependent conductances (VDC)(Magee and Johnston 1995; Stuart and Sakmann 1995; cf.Johnston and Narayanan 2008; Williams and Stuart 2003).Synaptic scaling is other mechanism that could compensatefor the voltage attenuation imposed by dendritic cableproperties, making the unitary response amplitude independent of its dendritic origin (Andrasfalvy and Magee 2001;Nicholson et al. 2006; Smith et al. 2003, cf. Johnston andNarayanan 2008). Another mechanism that could affect thepropagation is the passive normalization (Chitwood et al.1999; Jaffe and Carnevale 1999; Nevian et al. 2007) inwhich the anatomic and “passive” biophysical properties ofthe cell coalesce to remove most of the dependence ofsomatic EPSP amplitude on synaptic location.Despite the central role of CA3 pyramidal cells in learningand memory, most of the findings about synaptic propagationhave been obtained in CA1 pyramidal neurons mainly becausedendrite patch clamp recordings from those neurons arefeasible (Johnston and Narayanan 2008). Unfortunately distaldendrites of CA3 pyramidal cells are difficult to visualize inthe slice, thus making technically unfeasible the recordings ofdendritic EPSP in these cells. An indirect method to study thedendrite propagation of synaptic responses is the combination of experimentally somatic recordings with computationalmodels that use a realistic geometry of CA3 pyramidal cells.Previous studies using this approach showed slower kineticsfor A/C than for MF responses and predicted strong passiveattenuation of PP responses (Spruston et al. 1993; Williamsand Johnston 1991). Although the involvement of someactive conductances in shaping of the synaptic responses inCA3 pyramidal cells is known (Miles and Wong 1986;Urban and Barrionuevo 1998; Urban et al. 1998; Williamsand Johnston 1991) there have been not studies exploringthe effects of active mechanisms shaping A/C and PPEPSP/EPSC in the same cell. The passive models of CA3pyramidal cells current available (Johnston and Brown 1983;Henze et al. 1996; Major et al. 1994; Spruston et al. 1993) donot use realistic synaptic responses for constraining theparameters of the model. In part, this is due to lack ofexperimental recordings from A/C and PP synaptic responsesunder passive conditions (pharmacological blockade ofvoltage-dependent conductances).A further issue complicating the analysis of dendriticpropagation is that glutamatergic responses are mediated byboth AMPA and NMDA receptors (Berzhanskaya et al.1998; Debanne et al. 1998; Jonas et al. 1993; McBain andDingledine 1992; Spruston et al. 1995; Weisskopf and
J Comput NeurosciNicoll 1995), which have different amplitudes and kinetics.Given its faster kinetics, it is likely that the AMPA componentwould be strongly attenuated by dendritic filtering as itpropagates to the soma (Johnston and Brown 1983; Major etal. 1994; Spruston et al. 1993). Currently, there are noavailable data on the involvement of dendritic filtering on theshaping of A/C and PP AMPA and NMDA responses.The implementation of a realistic model of synapticintegration and firing by CA3 pyramidal cells requiresquantitative information of the unitary responses. Whereasthe unitary properties of the MF synapse have been previouslycharacterized (Jonas et al. 1993; Lawrence et al. 2004), theavailability of a detailed analysis of A/C and PP AMPA andNMDA receptor-mediated unitary EPSP/EPSC (AMPA andNMDA uEPSP/uEPSC) is limited (Debanne et al. 1998;Miles and Wong 1986).In the present experimental study and in the companionmodeling paper we used a combined experimental andmodeling approach to study the propagation of the AMPAand NMDA uEPSP/uEPSC from PP and A/C inputs. Weprovide a characterization of the amplitude and kineticparameters of minimally evoked isolated AMPA and NMDAcomponents from each of these two pathways recorded at thesoma of pyramidal cells from the middle of area CA3 (CA3b).To test the hypothesis that synaptic propagation of PP and A/Cin CA3 pyramidal cells is affected by active membraneproperties (Miles and Wong 1986; Williams and Johnston1991; Urban and Barrionuevo 1998; Urban et al. 1998), westudied the amplitude and kinetics of the isolated AMPA andNMDA components in current clamp (CC) and voltageclamp recording conditions. Understanding the passive andactive properties that might affect PP and A/C inputspropagation would provide important insights about the roleof these pathways in hippocampal function. To further dissectthe contribution of active conductances unaffected by voltageclamp, synaptic responses at the soma were also measuredunder pharmacological blockage of voltage-dependent channels. The experimental somatic responses recorded underpassive conditions were used to construct a realistic model ofpassive propagation of responses in the CA3b pyramidal cell,which is described in the companion paper (Baker et al.2010). Using this model other mechanisms that may affectthe propagation of AMPA and NMDA uEPSP/uEPSC (e.g.synaptic scaling and passive normalization) are furtherexamined.2 Methods2.1 Slices preparationAnimal use was in accordance with the University ofPittsburgh Institutional Animal Care and Use Committee.Male Sprague Dawley rats (23 5 days old; Zivic–MillerLaboratory) were anaesthetized (Nembutal, I.P., 5 mg per100 g body weight) and perfused intracardially with amodified artificial cerebrospinal fluid (ACSF) (concentrations in mM): 229 sucrose, 1.9 KCl, 1.2 Na2HPO4, 26NaHCO3, 10.0 glucose, 1.0 CaCl2, 4 MgCl2, 0.4 ofascorbic acid at 4 C; pH 7.4 maintained with bubbled O2(95%)/CO2 (5%) at room temperature. After perfusion,animals were decapitated, and the brains removed. Brainslices 315–400 μm were cut using a vibrating LeicaVT1000S and transferred to an incubation chamber withACSF containing the following (in mM): 125 NaCl, 1.87KCl, 12.5 Na2HPO, 26 NaHCO3, 2.17 CaCl2, 1.44 MgSO4,10 glucose, saturated with 95%O2/5% CO2, pH 7.4. Sliceswhere first preincubated at 34 C for 35 min and thenmaintained for at least 30 min at room temperature. Theslices were individually transferred to a submersionrecording chamber and superfused at constant flow(2.5 ml min–1) with the following solution (in mM): 125NaCl, 3.0 KCl, 1.25 Na2HPO4, 25 NaHCO3, 2.0 CaCl2, 1.0MgCl2, 10 glucose, pH 7.4. Bath perfusion temperature wasmaintained at 32 1 C.2.2 Whole cell recordingsWhole-cell CC and VC recordings from CA3b pyramidalcells were obtained with the aid of infrared differentialinterference contrast (DIC) video microscopy. The GABAA/GABAB receptors were routinely blocked using bath applied( )-bicuculline methobromide, 10 μM and CGP35348,500 μM or 2-hydroxysaclofen, 200 μM. The AMPA-andNMDA uEPSP/uEPSC were isolated with bath applied D( )-2-amino-5-phosphonopentanoic acid (D-APV; 50 μM)or 6-cyano-7-nitroquinoxaline-2, 3-dione (CNQX; 20 μM),respectively. In the majority of the experiments in which theNMDA component was isolated, the Mg2 concentration inthe external solution was decreased to 50 μM. The patchelectrodes (3–6 MΩ) were filled with (in mM): 120 Kmethylsulphate, 10 KCl, 10 Hepes, 0.2 EGTA, 4 ATP-Mg,0.3 GTPNa, 14 phosphocreatine, 0.25% biocytin. In mostcases, synaptic responses were obtained in three differentrecording conditions: 1) CC; 2) VC; and 3) passive VC. Inpassive VC experiments, the pipette solution contained Csmethane-sulfonate (120 mM) instead of K-methylsulphate,and QX-314 (5 mM) to block K and Na currents. QX-314may block also the hyperpolarization-activated (Ih) and Ca2 conductances (Perkins and Wong 1995; Talbot and Sayer1996). In passive VC experiments Ni2 was also added tothe bath to block Ca2 currents. Recordings were performedwith an Axopatch 200B amplifier (Molecular Devices,Sunnyvale, CA, USA), low pass filtered at 2 kHz anddigitized at 10 kHz with a Digidata 1422 (MolecularDevices) interface. Step protocols and data acquisition were
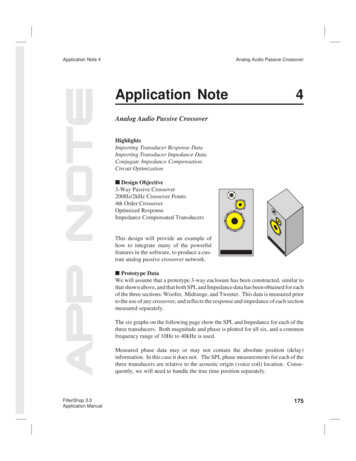
J Comput Neuroscimade with the Clampex software (Molecular Devices). CA3pyramidal cells had stable resting potential within 75and 60 mV (cells with more positive resting potential werediscarded). Cells with high spontaneous activity wererejected because of “contamination” of the evokedresponses. A series of inward and outward current steps(500 ms duration; 20 pA increments) were injected via thewhole-cell pipette to assess input resistance (RN) (Fig. 1c).RN was calculated as the slope of linear fit between voltageand injected current. The membrane time constant (τm) wascalculated from the exponential fit of activation of hyper-polarizing responses. The amplitude of action potential wasdetermined as the difference between peak and thresholdvoltages. The spike adaptation ratio (AR) of the first to lastinterspike interval within a sweep was quantified upon adepolarizing step of 100–500 pA. Based on this measure,CA3 pyramidal cells were classified as strongly adapting(AR 0.5) or weakly adapting (0.5 AR 0.8). Cells werediscarded if changes in series resistance were more than20%. Only recordings with noise levels (peak-to-peak) ofless than 100 μV (CC) or 5.0 pA (VC) were accepted. Themean peak-to-peak baseline noise level was of 60 10 μV(a)(b)PPSLM300 µmA/CS3: SRdistalS4: PP250 µmSRPerforantpathS1: SRproximal150 µmA/CS3: distal SRS2: SRmedial200 µmECS2: medialSRSLDGS1:proximalSR40 µmSPPCSORECA/CA(c)(d)AMPA EPSPNMDA EPSPA/CV (mV)PP5040PP3010 mv100 msA/C200.5nAAMPA EPSC-0.15 -0.10 -0.05-1010 mv100 ms0.050.10-0.08nA25 msNMDA EPSC0.15I (nA)-200.08nA0.5 mV0.5 mV20 ms10PPPP-30A/C-40Fig. 1 Firing and subthreshold synaptic responses from CA3pyramidal cells. (a) schematic diagram of hippocampal slice depictingthe positions of the concentric bipolar stimulation electrodes (S1–S4).The recording electrode (REC) is in one CA3b pyramidal cell.Associational/commissural fibres (A/C) were activated from the str.radiatum (proximal (S1), medial (S2), distal (S3)). Perforant pathfibres (PP) were activated from the str. lacunosum moleculare (S4) inarea CA1. (b) reconstruction of a CA3 pyramidal neuron showing thetypical soma location of CA3pc. CA3 pyramidal cells receiveconvergent excitatory synaptic inputs from other CA3 pyramidal cellsand from the entorhinal cortex, via the A/C and the PP, respectively.10 pA A/C20 ms10 pA25 msThe position of the electrodes for proximal, medial, and distal SRstimulations are shown. Abbreviations: A, alveus; SO, str. oriens; SP,str. pyramidale; SL, str. lucidum; SR, str. radiatum; SLM, str.lacunosum-moleculare. (c) Top left: adapting train of action potentialsin response to a high intensity depolarizing current injection in aCA3pc. Bottom left: voltage changes in response to low intensitydepolarizing and hyperpolarizing current injections in the sameCA3pc. Right: I–V curve measured from the same CA3pc showingoutward and inward rectification. (d) Representative AMPA andNMDA subthreshold EPSPs (top left and right) and EPSCs (bottomleft and right) for A/C and PP inputs
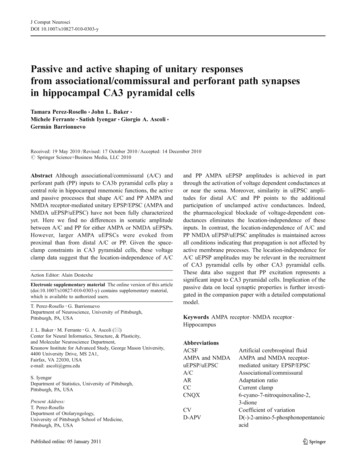
J Comput Neurosci(range: 30–90 μV) and 1.6 0.8 pA (range: 0.1–4.2 pA) inCC and VC recording modes, respectively. The low baselinenoise made possible to detect unitary responses as small as0.03 mV or 1.8 pA.2.3 Minimal stimulation techniquesEPSPs and EPSCs were evoked by minimal stimulation(Dobrunz et al. 1997; Raastad 1995) using extracellularstimulating electrodes (concentric bipolar CBAPB125;FHC, Inc., ME, USA). Brief (50–100 μs) stimulationpulses with intensities of 10 to 30 μA and 80 to 120 μAfor A/C and PP respectively, were delivered at 0.2 Hz.The stimulation intensity was increased until minimalEPSPs/EPSCs were evoked at reliable failure rates of 40to 60%. At these failure rates, the average amplitude ofEPSPs/EPSCs (excluding failures) did not change by smallchanges in the stimulation intensity. Experiments withlower failure rate were rejected. Further criteria forrecording of minimal responses were limited latency( 10 ms), and monoexponential EPSP decay. AMPA andNMDA uEPSP/uEPSC were evoked using similar strengthof stimulation intensities. Supplementary Figure 1 illustrates the peak value (PV), dependency of individual A/Cand PP AMPA and NMDA uEPSP from the stimulationintensity in four different cells showing a clear gap betweenfailures and minimal responses. The stimulation sites werelocalized in CA3 str. radiatum, and in str. lacunosummoleculare on the border of the subiculum and area CA1, toactivate A/C and PP fibers, respectively (Fig. 1a, b). In thestr. radiatum, A/C responses were evoked from stimulationsin proximal, medial, and distal locations (150–200 μm,200–250 μm, and 250–300 μm from str. pyramidale,respectively; Fig. 1a, b).2008) for processing. The response parameters (Fig. 2)were extracted using a combination of automatic andmanual procedures. Here we provide a comprehensivedescription of this analysis, but the more pedantic detailsof this procedure and the related numerical parameters arereported at the end of the paper in the Appendix andTable 1, respectively. To ensure full reproducibility andfurther applications and extensions, we are also distributingthe R source code freely upon request.Processing of each data sweep was performed asfollows. 1) The stimulus artifact was identified by searchinga time interval around the expected time of stimulation anddetermining the largest magnitude second derivative of thesignal; 2) The stimulus artifact was removed within a smalltime window around the time of stimulation and replacedwith a linear interpolation spanning the period immediatelybefore and after the stimulation; 3) The resting potentialwas estimated using a trimmed mean of values over aninterval preceding the stimulation; 4) Noise reduction wasapplied by smoothing the response with a finite-impulseresponse digital filter of minimal window size (one cyclebefore and after the smoothing point) and a smoothingcutoff frequency (Table 1) determined by the type of dataanalyzed; 5) Latency, rise-time, time-to-peak (TTP), peaktime, peak value, half-height width (HHW), and decay timeconstant parameters were estimated from the smoothedresponse; 6) The sweep was categorized as either rejected,failure, single-peak response, multi-peak response or anundetermined response type; 7) Finally, unitary responseswere identified from among the single-peak responsesbased on the failure rate in the binomial approximation.estimation interval80%2.4 Drugswidth( )-bicuculline methobromide (GABAA receptor antagonist, 10 μM); D( )-2-amino-5-phosphonopentanoic acid(D-AP5, NMDA receptor antagonist, 50 μM), 6-cyano7-nitroquinoxaline-2,3-dione (CNQX, an AMPA/kainatereceptor antagonist, 10 μM); CGP35348 (500 μM) and 2hydroxysaclofen (200 μM) (GABAB receptor antagonists);QX314 (blocker of Na , K , Ca2 , and Ih currents), were allpurchased from Tocris, UK. NiCl2 (blocker of Ca2 current)was from Sigma- Aldrich.2.5 Analysis of stimulation-evoked EPSC and EPSPEPSPs/EPSCs were recorded at 10 KHz. Consecutive datasweeps with representative data identified by the experimenter were converted into comma-separated-variables fileformat and loaded into R (R Development Core Teampeakvalue50%20%rise timetime to peakrest estimated from meanof trace before stimulusresponse onset estimated by extrapolatingFig. 2 Data analysis schematics. Schematic diagram of parameterextraction (see Section 2). Rest is estimated from the mean of unsmoothed data prior to the stimulus artifact. Response onset isestimated from the rising 20% and 80% times and values. Latency isthe difference between onset and stimulation times. Peak value is thedifference between the actual peak of the smoothed response and rest.Time to peak is the interval between response onset and the peak.Half-height width is the time between the rising and falling 50%times. The decay time constant is estimated over the final 80% of theinterval between the peak time and the falling 50% crossing point
J Comput NeurosciTable 1 Data analysisparameters and thresholdsParameter or thresholdCCPre-stimulation test window (ms)Maximum trend (mV ms 1 or pA ms 1)Minimum peak value (mV or negative pA)Allowed latency (ms)Allowed peak time (ms)Minimum fitting window (ms)Maximum fit error (non-dimensional)Smoothing cutoff frequency (Hz)Maximum half-height width (ms)τm assumed for fitting (ms)These steps, explained in more detail below, are illustratedin Fig. 2 and Supplementary Figures 2 and 3.Latency was first estimated directly from sweep data bylinearly extrapolating the signal change from 20% to 80%of the peak back to the initial deviation from rest (Fig. 2).Latency was also derived as a parameter of the dualexponential fitting procedure used to identify single-peakresponses (see Appendix). Rise-time was defined as thetime from 20% to 80% of peak (Fig. 2). Peak time is thetime from stimulus artifact to actual response peak, whereastime-to-peak is defined here as the peak time minus thepositive part of any estimated latency (Fig. 2). Half-heightwidth is the time from the latest crossing of the half-peakamplitude prior to the peak to the earliest half-peak crossingfollowing the peak (Fig. 2). Because of the samplinginterval granularity (0.1 ms), crossing times were estimatedby linear interpolation. The decay time constant wasestimated using response values from the last 80% of thetime interval from the peak to the falling half-heightcrossing (see Appendix for further details).Sweeps were categorized as rejected, failure, single-peakresponse, multi-peak response, or undetermined based onseveral parameters, whose definition and numerical valuesare specified in the Appendix and in Table 1, respectively(see also Supplementary Figure 3). Other cases weregenerally categorized as undetermined, although the readeris referred to the Appendix for a comprehensive descriptionof this procedure. Among the 16 experimental combinations of CC vs. VC, A/C vs. PP, and synaptic receptorblockers, the mean percentages of sweeps by category priorto the application of any manual category overrides were12 1%, 8 1%, 31 3%, 19 1%, and 30 3% for rejected,undetermined, failure, multi-peak, and single-peak categories, respectively.For sweeps categorized as single-peak responses, theresponse may arise from unitary synaptic activations orfrom multiple concurrent synaptic activations. After allVCAMPANMDAAMPANMDA150.010.10 5–155–40400.106010020150.010.10 5–155–60400.106020020100.52.0 5–105–40300.10180500100.52.0 5–105–60300.151001500sweeps in a consecutive group had been categorized,putative unitary sweeps in this group were identifiedbased on a probability model of responses. Assumptionsof the model are: 1) multiple synapses are potentiallystimulated; 2) each synapse has an unchanging and equalprobability of stimulation; 3) activated synapses havesimilar peak responses; and 4) peak values from multipleactivations are approximately additive. For a fixednumber of potentially stimulated synapses, the numberactivated would form a binomial distribution. Becausethe number of potential synapses is unknown, a Poissonlimit was used to estimate the number of singleactivations given an observed failure rate. The failurerate was estimated as the number of categorized failuresdivided by the sum of the failures, single-peak responses,and multi-peak responses. Rejected sweeps and those ofundetermined category were not used in estimating thenumber of single activations. For an estimated failurerate p, the number of expected unitary activations u isgiven by the formula:u ¼ logðpÞpn1 pwhere n is the number of identified single-peak responses.Using the estimated number of unitary activations,putative unitary sweeps were identified by ranking peakamplitudes from single-peak responses and taking theunitary sweeps from sweeps with the lowest peak valuemagnitudes (Supplementary Figure 2b). Response parameters of putative unitary sweeps are then summarized interms of sample mean and s.d. and individually identifiedfor further statistical analysis. This method to selectunitary inputs was validated with a post-hoc analysis ofsimulated passive conditions using a computational modelconstrained by the experimental results, described inthe companion paper (Baker et al. 2010). In terms of theoverall fraction of unitary sweeps by experiment type, the
J Comput Neuroscilowest fraction of unitary sweeps after application of anymanual overrides was in CC A/C NMDA experiments(7%) and the highest fraction was in CC A/C AMPAexperiments (17%). Across all experimental types, themean percentage of unitary sweeps was 13% 1%.2.6 Additional statistical analysisThe statistical analyses on the unitary responses aftersweep categorization and selection were carried out usingthe MINITAB (Minitab Inc, State College, PA, USA) andSAS packages (SAS Institute Inc, Cary, NC, USA). Themain summaries are given as mean s.d., coefficient ofvariation, CV (CV s.d./mean), and correlation (r). Forcomparison of various outcomes (e.g., PV, TTP, HHW)between pathways (e.g., A/C vs. PP) and betweenrecording conditions (VC vs. passive VC) we used arandom effects model to account for potential heterogeneity among the cells:Y ¼ m þ EP þ EC þ I þ eSpecifically, we regard the pathway as a fixed effect (EP)and the cell itself as a random effect (EC); we included aterm to model (also as a random effect) the potentialinteraction (I) between these main effects. Y is the outcome,m is the grand mean of the outcome across the data set, ande is the unexplained variation. For comparison of pathswithin a particular cell, we used a simpler fixed effectsmodel.3 ResultsTo study the active and passive dendritic propagation ofAMPA and NMDA uEPSP/uEPSC in CA3 pyramidal cells,we compared the amplitudes and kinetics of EPSP/EPSCsevoked from stimulation sites in the str. radiatum of CA3(for A/C responses), and from the str. lacunosummoleculare (for PP responses) (Fig. 1a, b). Although mostof the kinetic analyses are based on TTP and HHW, we alsomeasured the rise-time and decay time constant (see Tables2, 3 and 4). The majority of unitary synaptic responses wereobtained in CC and VC recording conditions. In severalexperiments, we also compared unitary responses recordedin VC vs. passive VC conditions (see Section 2) todetermine whether conductances located near the somashape A/C and PP synaptic responses. The comparison ofamplitude and kinetic parameters of uEPSC in VC vs.passive VC condition also gives information about conductances located distally from the soma that could beaffecting the propagation of subthreshold responses. Furthermore, recordings under passive VC condition wouldalso allow the construction of an adequately constrainedpassive computational model, which is described in thecompanion paper (Baker et al. 2010).AMPA and NMDA uEPSP/uEPSC from A/C and PPsynapses were obtained from 76 CA3 pyramidal cells.Most of the cells exhibited a strongly adapting train ofaction potentials in response to a depolarizing currentinjection (adaptation ratio: 0.46 0.22 (N 60); Fig. 1c;top trace). Overall, weakly-adapting cells comprised 30%of the data set whereas 55% of cells were stronglyadapting. The remaining 15% of cells presented burstfiring (Hemond et al. 2008). The properties of actionpotential waveforms were similar to those reported inprevious studies (amplitude: 70.3 8.1 mV; half-width:1.2 0.2 ms; N 15) (Buckmaster and Amaral 2001; Hemondet al. 2008). I–V curve showed an outward and inwardrectification in the majority of the cells (Fig. 1c). Meanvalues for τm and RN were 43 13.1 ms and 148 69 MΩ,respectively (N 25), consistent with previous measurementsof the passive properties of CA3 pyramidal cells (Sprustonand Johnston 1992; Hemond et al. 2009). The AMPAR- andNMDAR-mediated subthreshold EPSPs/EPSCs (Fig. 1d)had similar kinetics to those reported previously (Debanneet al. 1998; Williams and Johnston 1991; Weisskopf andNicoll 1995).3.1 Characterization of isolated A/C AMPA uEPSP/uEPSCCA3 pyramidal cells receive input from other CA3pyramidal cells via the A/C axons making synaptic contactsonto the apical dendrites in the str. radiatum, and basaldendrites in the str. oriens. A/C synapses on the apicaldendrites are positioned throughout the entire str. radiatum(Ishizuka et al. 1990; Li et al. 1994). We took advantage ofthe widespread dendritic location of A/C synapses toevaluate propagation of synaptic responses along the apicaldendrites by comparing the amplitude and kinetic parameters of the isolated AMPA
responses is controlled, in part, by the passive cable properties of the cell’s membrane (Jack et al. 1971; Rall 1967), which attenuate the amplitude and prolong the time course of the synaptic waveforms. In principle, synaptic responses generated closer to the soma would have a larger