Transcription
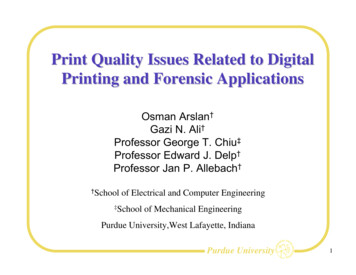
Print Quality Issues Related to DigitalPrinting and Forensic ApplicationsOsman Arslan†Gazi N. Ali†Professor George T. Chiu‡Professor Edward J. Delp†Professor Jan P. Allebach††Schoolof Electrical and Computer Engineering‡Schoolof Mechanical EngineeringPurdue University,West Lafayette, IndianaPurdue University1
Introduction Research activities in Purdue universityImaging pipelineEP and inkjet printing basicsApplication examplesPurdue University2
Digital Print Systems (DPS)program at Purdue Started in 1986 by Jan Allebach with funding from MeadImaging Focus on imaging systems rather than image processing per se Today the DPS program supports approximately 30 half-timegraduate research assistants and 8 faculty members in fivedifferent academic units at PurdueMajor growth in 1992 with funding by HP and Kodak andparticipation by Charles BoumanPurdue University3
Need for multidisciplinary approachesImagingpipelineMedia (paper)and rdue University4
Interdisciplinary natureof the research ECEME Jan Allebach George Chiu Charlie Bouman 5 students Ed Delp Sam Midkiff 18 students IE Psychology Zygmunt Pizlo Summary 4 departments Mark Lehto 8 faculty members Yuehwern Yih 26 students 3 students 34 researchersPurdue University5
Who is sponsoring the research? Curent sponsors Previous sponsors HP Apple Computer Samsung Color Savvy Systems Xerox Eastman Kodak National ScienceFoundation withguidance from U.S.Secret Service LG Electronics Mead Imaging DuPontPurdue University6
Imaging pipeline is complexPurdue University7
Printing TechnologyPrintingTechnologyImpactNon ImpactDot MatrixCharacterInkjetLaserSolid InkDye SublimationThermal AutochromeThermal Wax8Purdue University
Electrophotographic (laser) printing processDiode LaserRotatingPolygonMirrorCharge FuserREPAPCleaningTonerSupplyOP CD ru mTransferRollerPurdue University9
Six Steps of ElectrophotographyPurdue University10
Inkjet Printer MechanismBubblejet/ ThermalPiezoelectricPurdue University11
Commercial presses are based on “impact”printing technologies Letterpress and flexographyOffset lithographyGravureIntaglioHeidelberg Speedmaster SM 74 offset press20”x29”, 2-color, 10K sheets/hr.Purdue University12
Digital halftoning:rendering gray levels The perception of levels of gray intermediate to black or white dependson a local average of the binary texture.Purdue University13
Digital halftoning:rendering detail Detail is rendered by local modulation of this texture.Purdue University14
Halftoning algorithms Point processes - screeningNeighborhood processes - error diffusionIterative processes - direct binary search (DBS)DiDBS screenError diffusionDBSIncreasing complexityIncreasing qualityPurdue University15
Impact of the research: use in products andmedia coverage Resolution synthesis algorithm in the drivers for 10’s of millions ofunits of inkjet printers Tone-dependent error diffusion in the hardware for 10’s of millions ofunits of inkjet printers AM/FM halftoning in firmware for midrange laser MFP products Printer forensics research reported in over 24 media outlets, includingthe BBC, The Economist, EE Times, and Forbes (seehttp://shay.ecn.purdue.edu/ prints for complete set of articles)Print quality defect diagnostics website on-line for midrange color laserproductsPurdue University16
Resolution synthesis yields sharper images(4X scaling results) for inkjet productsPhotoshop Bicubic InterpolationTree-Based Resolution SynthesisPurdue University17
Tone-dependent error diffusion improveshalftone quality for inkjet productsFloyd-SteinbergTDEDPurdue University18
AMFM halftoning suppresses moire in scan-to-printapplications for laser MFP products120 line frequency bar160 line frequency barAM/FM halftoningFloyd-Steinbergerror diffusionPhotoTonePurdue University19
The hybrid screen provides superiorquality at low-bit depthsDispersed dotsa 1/52Periodic clustered dotsa 1/13a 2/13a 3/13a 4/13130x130, 34-degree screen (a: absorptance level)Purdue University20
Laser printer test pages provide advancedfeatures for diagnosis of print quality defectsRulersCPR testblockGhostingtest barDividedsectionsPagenumberConstant tonebackgroundPurdue University21
Printer Defects and Objective Metrics forPrint QualityPurdue University22
Outline Print quality defectsOne of the most serious print defects: BandingPrint quality test pageObjective metrics for print quality Method of computing objective metrics Line metrics: An examplePurdue University23
Print Quality Defects Defects are often introduced into the images because of mechanicalor material problems during imaging The defects may be introduced due to Rendering technique and mechanical design of the printing device Equipment failurePurdue University24
Classification of Print Quality Defects Group 1: Defects of uniformity Banding, streaks, second side discharge marks Group 2: Random marks and repetitive artifact Randomly scattered white specks, repetitive marks, repetitive lines,ghosting, leaked toner, tone bubbles, tone scatter Group 3: Color defects Color plane registration, color consistencyPurdue University25
Print Quality Defects Defects of uniformityPaper processdirectionBandingStreaksPurdue University26
Print Quality Defects Random marks or repetitive artifactsRandomlyscattered whitespecksRepetitivemarksGhostingPurdue University27
Illustration of Banding}bandingPurdue University28
Origins of BandingAn artifact affecting image macro/micro uniformity Periodic or random – periodic is most objectionable Gear transmission error is one of the major contributors» Eccentricity and tooth profile error cause scan line spacing variation8Spectrum1000071938000signal power ( H 2) 560004362244000m200001m050100150200frequency (c ycles/rev)2503001423Purdue University529
Banding Frequency Determination Vertical line patterns eliminate the effect of halftone Vary the line spacing to control gray level1-D horizontal projection(printed and scanned page)Purdue University30
Sample Banding SpectraMinolta 1250absorptanceabsorptanceBrother 1440cycles/incycles/inPurdue University31
Sample Banding SpectraSpectra of projected absorptance for LJ 1000Spectra of projected absorptance for LJ 4050Spectra of projected absorptance for LJ 1200Spectra of projected absorptance for ML-1450Purdue University32
Banding Frequencies forVarious EP PrintersPrinter ModelBanding Frequencies(cycles/inch)Minolta LaserJet 125017Brother LaserJet 144030, 73, 78HP LaserJet 100027, 69HP LaserJet 120069HP LaserJet 405051, 100Samsung ML-145016, 32, 100, 106Purdue University33
Print Quality Test PageRulersCPR testblockGhostingtest barDividedsectionsPagenumberConstant tonebackgroundPurdue University34
Feature : Ghosting Test Block Dark test bar generates visible ghosting on light backgroundzStructured test bar Distinct from a vertical line defect Measure of ghosting strengthTest barGhostingStructuredTest on(a)(b)Purdue University35
Distance informationfor ghostingFeature : Ruler Information provided by rulers Distance information Location informationTestbarsGhostingimage Label differentiation Horizontal: numbers Vertical: alphabetical charactersGhosting on the test pagecontaining rulersPurdue University36
Print Quality Metric We have to define the attributes that will tell us about print quality ISO/IEC has already provided guidelines on hardcopy print qualityassessmentWe also need to come up with objective quantitative metrics to evaluatethese attributesPurdue University37
Objective Metrics for Print QualityTint SolidMetricsLine MetricsSolid-FillMetricsBlurrinessOverall darknessOverall darknessStroke widthMottleRaggednessContrastLarge area densityvariation (LADV)Large area densityvariation (LADV)FillVoidsBackground ityGranularityDarknessExtraneous marksBackground hazePurdue University38
ISO/IEC Metric DefinitionPurdue University39
Method of Computing Objective MetricsTest Target (File)PrinterPrinted TargetSpot Sold AreaDarkness 0.6051Mottle 0.0134LADV 0.084ScannerWorkstation/PCMetric ValuesPurdue University40
Output Variation Due to Technology and MediaLaser Printer Using Coated PaperLaser Printer Using Cotton BondPurdue University41
Output Variation Due to Technology and MediaInk-jet printer using standard paperInk-jet printer using special ink-jet paperPurdue University42
Line Metrics: An ExamplePurdue University43
Line Metrics: An ExamplePurdue University44
Intrinsic and Extrinsic Features for PrinterIdentificationPurdue University45
Outline Intrinsic and extrinsic featuresPrincipal component analysis for feature extractionGaussian mixture model for classificationLaser exposure modulation for embedding extrinsic signaturePurdue University46
Intrinsic and Extrinsic Features Use intrinsic signature of printer to identify as much information as possiblefrom printed document about printer that produced it Embed auxiliary information in document at time of printing via extrinsicsignature Intrinsic and extrinsic signatures are based on extraction and modulation ofphysical characteristics of printer mechanismPurdue University47
Intrinsic Signature Analysis Most signature features are stable from page to page and acrossdifferent printer cartridges Some signature features do vary from page to page, and maydepend on the cartridge too Measurements need to be made over large number of samples to show arobust signature Need to develop database for all possible intrinsic signature patternsPurdue University48
Test Bed for Printer Analysis 20 different printer models 5 inkjet, 2 multifunction and13 electrophotographic(laser and LED) 8 different manufacturers At least 2 of each model 5 image capture systems Saphir Ultra2 (1200 dpi) HP Scanjet 4570C (2400dpi) HP Scanjet 8250 (4800 dpi) AZTEK Premier (8000 dpi) QEA IAS 1000 systemPurdue University49
Intrinsic Signature –Fine Pitch Banding Caused by quasiperiodic fluctuations in speed of rotatingcomponentsFor EP (laser or LED) printers, fluctuations in speed of rotationof optical photo-conductor is major sourceThis artifact appears as cyclic light and dark bands perpendicularto the print process direction with relatively short periodEffect is most prominent in midtone regionsPurdue University50
Principal Components Analysis (PCA) Classical PCA is a linear transform that maps the data into alower dimensional space by preserving as much data variance aspossible Principal components are the features that can be used by theclassifierPurdue University51
Dimension Reduction by PCA Projection data is high dimensional. Dimension is reduced by PCA Each projection is mean subtracted and normalizedAll experimental data to be reported today is based on scans of the character "I"For each printer, we obtain 40-100 projections from different repetitions of thecharacter "I"For PCA, singular value decomposition is usedPCAPurdue University52
PCA for Five Printer Models The class separation is NOT suitable for classification PCA needs to be modified for better class separationPurdue University53
Modified PCA 1Covariance matrix of a class c, Σc NcN tT(x-μ)(x-μ), t cn class labelcnccn 1NcΣcc 1 NBetween-class scatter matrix, SB Σ-S W , Σ covariance matrix of the dataCWithin-class scatter matrix, S W The eigenvectors can be determined using the within class scatter matrix andbetween class scatter matrixSW 1SB φ λφ The generalized eigenvectors of SB and SW maximize the ratio of between-classscatter and to the within-class scatter SW is generally not invertible for real dataPurdue University54
Improvement Using Modified PCAOriginal PCAModified PCAPurdue University55
Gaussian Mixture Model (GMM) PCA gives the features butPCA is not a classifier Classification can be doneby using Gaussian mixturemodelPurdue University56
GMM Parameter Estimation A model with M component is,Mp( z ) P ( j )p( z j ), where P(j) are the mixing coefficients,j 1M number of different printer models The component density function is,p( z j ) 12jd(2πσ )2 z μj exp 22σj 2 Initialization by K-means algorithm, 7 iterations. Training by EM algorithm, 25iterationsPurdue University57
Unknown Printer Identification Using PCA andGMMClassifier OutputLJ4050LJ1200LJ100014eML1450 MajorityTest ectly ClassifiedIncorrectly ClassifiedPurdue University58
Embedding Extrinsic Signature Modulating laser exposure to generate banding signals Modulation should keep below human visual contrast sensitivitythreshold but still be detectable from the scannerThese banding frequencies should be different from the intrinsicfeatures of the printersPurdue University59
Laser Exposure ModulationReferenceVoltageLaserLaser IntensityExposurePrintoutDot Size(Contrast)OPC VoltagePeriodic SignalVoltagePurdue University60
Synchronizing the Exposure Modulationwith Scan Line Extrinsic signature exposure modulation changes from scan line to scanline Require synchronizing the laser exposure modulation and beam detectsignalPurdue University61
Test Target for Dot Size MeasurementScan line1234Hardware ready 00000000000FFFFScan line12341.7VReference voltage1.7V1.5V1.3V1.1VPrint out1.5V1.3V1.1VPurdue University62
Analysis of Dot Size Modulation Modulation result for single dot¾ Developed dot sizes are measured based on 8000 dpi scan¾ Dot size number of pixels with absorptance 0.1¾ Average the dot size of 16 dots in a single linedot size stochastic14001.1V1.3V1.5V1.7VDot size (number of pixel)Referencevoltage12001000Laserspot profile800600400Developeddot profile200011.21.41.61.82modulation voltage (volt)Purdue University63
Embedding and Detecting an ExtrinsicSignaturePeriodic ReferencesignalvoltagePrint rdue University64
Experimental Result Without ation freq.with same ΔV3Intrinsicbanding1004FFT3With modulation55FFT 30000100120150100200300cycle/inPurdue University65
Printer Identification from PrintedDocuments Using Texture Based FeaturesPurdue University66
Outline Identification of EP Printers Process for printer identification Texture features» Gray-Level Co-occurrence Matrix (GLCM)» Pixel based Classification method Classification example Feature refinement Identification of Inkjet Printers Overview of Inkjet Printers Process for Printer Identification Classification examplePurdue University67
Process for Printer IdentificationPurdue University68
Test Character Test classifier using letter “e”, because it is the most common letterused in English.12pt. ‘e’ (Times Roman)Purdue University69
Selection Criteria for the Features Features should be robust to certain variations in theprinters. Feature : Average gray level of a character – mayheavily depend on the amount of colorant left in thecartridge. Features should not depend directly on the size or typeof font of the character. Feature : Length/width of a character – will directlydepend on the type and size of the font used in thatdocument.Purdue University70
Gray-Level Co-occurrence Matrix(GLCM) to Calculate Texture Features jFirst proposed by Robert M. Haralick et. al.in 1973†iImg(i,j)Each entry pglcm(n,m) of the GLCM givesthe frequency of occurrence of pairwisegraylevels, n and m, d pixels apart at anangle αα 135od 2† Robert M. Haralick, K. Shanmugam and Its’Hak Dinstein, Textural features for imageclassification, IEEE Transactions on Systems, Man, and Cybernetics, SMC-3, 610 (1973)Purdue University71
An Example of a Gray-LevelCo-occurrence Matrix1123023223213200111221222 1 1 2 3 20 2 2 3 2 1i\jP(i,j,d,45o)with d 2 will be01230 1 2 30300Purdue University32200191000472
Selection of (GLCM) Parameters Assume banding signal is primary source of texture in printed areasof document Choose α such that pixel pairs are chosen in the process direction(direction of banding signal) Vary distance, d between 1 to 10 and find the distance thatperforms the best separation between the classes.Purdue University73
Feature Set2σ ImgVariance of pixels in ROIρ nmhImgEntropy of pixels in ROIdiagcorrMean of marginal probabilitydensities of GLCMDenergy Energy of D(k) (Difference Histogram)μrμcσ r2σ c2Variance of marginalprobability densities of GLCMEnergy Energy of pglcmhxy1hxy 2hglcmEntropy measures of pglcmMaxProb Maximum entry in pglcmCorrelation of entries in pglcmDiagonal correlationhDEntropy of D(k)IDInertia of D(k)LDLocal homogeneity of D(k)Senergy Energy of S(k) (Sum Histogram)hSEntropy of S(k)σ S2Variance of S(k)ADCluster Shade of S(k)BDCluster prominence of S(k)Purdue University74
Printers Used in 0Purdue University75
Classification Results: d 5all features, 300 test vectorsTest PrinterClassifier eml1430hl1440 lj4050 e320lj1000 lj1200 lj5Mlj6MP 1250W 14eml1430 Majority Vote0110116216 hl144019757000000000 lj4050300000200131 e32024836400511745115266lj1000300141113129 lj1200991300117293052 lj5M601650141162829920 lj6MP301533302174203 1250W491810251223623 1250W741281009152130131761124 ml1430Correctly ClassifiedIncorrectly ClassifiedBold 2nd highest classificationPurdue University76
Feature Refinement Repeat classification with 4 manually chosen features that yielded gooddiscrimination based on observation (1) Variance of ROI pixel values (2) Entropy of ROI pixel values (3) Mean of marginal row probability of GLCM (7) Energy of GLCMPurdue University77
Feature Scatter PlotPurdue University78
Feature Scatter PlotPurdue University79
Classification Results: d 94 features, 300 test vectorsTest PrinterClassifier eml1430hl1440 lj4050 e320lj1000 lj1200 lj5Mlj6MP 1250W 14eml1430 Majority Vote00322612417 hl144014267000000000 lj405030000001040 e320283127002427803 lj10001518012012821403 lj1000140910168222400 lj5M5118832025454017025 lj6MP516537001321130 1250W10111503010013816 14e9711742011515139945133 ml1430Correctly ClassifiedIncorrectly ClassifiedBold 2nd highest classificationPurdue University80
Outline Identification of EP Printers Process for printer identification Texture features» Gray-Level Co-occurrence Matrix (GLCM)» Pixel based Classification method Classification example Feature refinement Identification of Inkjet Printers Overview of Inkjet Printers Process for Printer Identification Classification examplePurdue University81
Inkjet print mechanismPhotos courtesyHewlett-Packard Co.Purdue University82
Printhead nozzle geometrycyanmagentayellowFront viewIntended targetNozzlecolumnsDrop trajectoryNozzlecolumnsNozzle plateTop viewSiliconInk feed slotSiliconPurdue University83
Inkjet Printer Artifacts IJ printers do render dots having a nearly hard, ideal profile, andmuch more stable than those rendered by EP printers However, there exist artifacts, which are unique to or moresignificant in inkjet printing process Ink coalescence (firing adjacent nozzles simultaneously) Satellites (firing the nozzle at higher frequency than they canhandle) Random dot placement errorsPurdue University84
Samples Inkjet Printer DotsSingle DotDouble DotDouble Dot with a tailSatelliteTailPurdue University85
Multi-pass Printing and Print Mask Inkjet printers have different modes to produce different image quality andspeed. Single-pass and multi-pass modes Faster or slower print head speeds.Vertical positionof pen for the 1st pass10100101010110101010010101011010Pen aAdvanceDirectionVertical positionof pen for the 2nd pass Multiple-pass printing & print mask prevent artifacts such as the inkcoalescence and satellites, but NOT dot placement error.Purdue University86
Test pattern printing and scanningTest pattern (600x600)Printout (scanned) Segmentation mapevenoddevenodd* scanned@4000dpiPurdue University87
Calculation of dotdisplacement statisticsref. lineref. line* ref. line averaged centroid* displacement centroid - ref. linePurdue University88
Printer CharacteristicsHorizontal dot displacementsfor even rasterVertical dot displacementsfor even rasterHorizontal dot displacementsfor odd rasterVertical dot displacementsfor odd rasterPurdue University89
Process for Inkjet Printer on ofthe efeatureBADstability ofthe feature withina printermodelGOODDiscriminantanalysisSelected featureset forclassificationPurdue University90
Sample Test Characters Scanned at 2400 dpiCannon S330(High)Cannon S330(Standard)HP 3420(Best)HP 3420(Normal)Epson C62(BestPhoto)Purdue UniversityEpson C62(Text&Image)91
Printers Installed in the Printer dardPurdue University92
Feature Scatter PlotHP 3420HP 3650HP psc1315Lexmark Z25Lexmark Z2250Canon S3303.4oEntrophy (θ 90 , d .550.6Max. Correlation Coeff. (θ 90o, d 16)Purdue University93
Feature Scatter PlotMax. Correlation Coeff. (θ 90o, d 1)0.940.930.920.910.90.89HP 3420HP 36500.88HP psc13150.87Lexmark Z25Lexmark Z22500.86Canon S3300.85123456oContrast (θ 90 , d 2)789oContrast ( 90 , d 2)Purdue University94
Thanks for your attention.Osman Arslanarslan@ecn.purdue.eduGazi Naser Alialig@purdue.eduGeorge T.-C. Chiugchiu@purdue.eduEdward J. Delpace@ecn.purdue.eduJan P. due.edu/ printsPurdue University95
References J. Grice and J. P. Allebach, “The Print Quality Toolkit: An Integrated Print-Quality Assessment Tool,”Journal of Imaging Science and Technology, Vol. 43, pp. 187-199, March/April 1999. D. Kacker, T. Camis, and J. P. Allebach, “Electrophotographic Process Embedded in Direct Binary Search,”IEEE Trans. on Image Processing, Vol. 11, pp. 234-257, March 2002. G. Y. Lin, J. M. Grice, J. P. Allebach, G. T. C. Chiu, W. Bradburn, and J. Weaver, “Banding ArtifactReduction in Electrophotographic Printers by Using Pulse Width Modulation,” Journal of Imaging Scienceand Technology, Vol. 46, pp. 326-337, July/August 2002. M. T. S. Ewe, J. M. Grice, G. T. C. Chiu, and J. P. Allebach, C. S. Chan, W. Foote, “Banding ArtifactReduction in Electrophotographic Processes Using a Piezoelectric Actuated Laser Beam DeflectionDevice,” Journal of Imaging Science and Technology, Vol. 46, pp. 433-442, September/October 2002. C-L. Chen, G. T. C. Chiu, and J. P. Allebach, “Banding Reduction in Electrophotographic Processes UsingHuman Contrast Sensitivity Function Shaped Photoreceptor Velocity Control,” Journal of Imaging Scienceand Technology, Vol. 47, pp. 209-223, May/June 2003. G. N. Ali, A. K. Mikkilineni, P. J. Chiang, J. P. Allebach, George T. Chiu, and E. J. Delp, “Intrinsic andExtrinsic Signatures for Information Hiding and Secure Printing with Electrophotographic Devices,”Proceedings of IS&T’s NIP 19: International Conference on Digital Printing Technologies, New Orleans,LA, 28 September – 3 October 2003.pp. 511-515. Y. Bang, Z. Pizlo, N. Burningham, and J. P. Allebach, “Discrimination Based Banding Assessment,”Proceedings of IS&T’s NIP 19: International Conference on Digital Printing Technologies, New Orleans,LA, 28 September – 3 October 2003.Purdue University96
References A. K. Mikkilineni, G. N. Ali, P. Chiang, G. T. C. Chiu, J. P. Allebach, and E. J. Delp, “Signature-Embedding inPrinted Documents for Security and Forensic Applications,” Security, Steganography, and Watermarking ofMultimedia Contents IV, E. J. Delp and P. W. Wong, eds, SPIE Vol. 5306, San Jose, CA, 18-22 January 2004, pp. 455466. W. Jang, M. C. Chen, J. P. Allebach, and G. T. C. Chiu, “Print Quality Test Page,” Journal of Imaging Science andTechnology, Vol. 48, pp. 432-446, Sept./Oct. 2004. P. Chiang, G. N. Ali, A. K. Mikkilineni, G. T. C. Chiu, J. P. Allebach, and E. J. Delp, “Extrinsic SignaturesEmbedding Using Exposure Modulation for Information Hiding and Secure Printing in Electrophotographic Devices,”Proceedings of IS&T’s NIP 20: International Conference on Digital Printing Technologies (Invited paper), Salt LakeCity, UT, 31 October – 5 November 2004. G. N. Ali, A. K. Mikkilineni, P. Chiang, J. P. Allebach, G. T. C. Chiu, and E. J. Delp, “Application of PrincipalComponents Analysis and Gaussian Mixture Models to Printer Identification,” Proceedings of IS&T’s NIP 20:International Conference on Digital Printing Technologies (Invited paper), Salt Lake City, UT, 31 October – 5November 2004. A. K. Mikkilineni, G. N. Ali, P. Chiang, G. T. C. Chiu, J. P. Allebach, and E. J. Delp, “Printer Identification Based onTextural Features,” Proceedings of IS&T’s NIP 20: International Conference on Digital Printing Technologies, SaltLake City, UT, 31 October – 5 November 2004. O. Arslan, J. P. Allebach, and Z. Pizlo, “Softcopy Banding Visibility Assessment,” Image Quality and SystemPerformance II, R. Rasmussen and Y. Miyake, eds, SPIE Vol. 5668, San Jose, CA, 16-20 January 2005. A. K. Mikkilineni, P. Chiang, G. N. Ali, G. T. C. Chiu, J. P. Allebach, and E. J. Delp, “Printer Identification Based onGraylevel Co-Occurrence Features for Security and Forensic Applications,” Security, Steganography, andWatermarking of Multimedia Contents VII, E. J. Delp and P. W. Wong, eds, SPIE Vol. 5681, San Jose, CA, 16-20January 2005. W. Jang and J. P. Allebach, “Simulation of Print Quality Defects,” (Feature Article) Journal of Imaging Science andTechnology, Vol. 49, pp. 1-18, Jan./Feb. 2005. J. H. Lee and J. P. Allebach, “Inkjet Printer Model-Based Halftoning,” IEEE Trans. on Image Processing, Vol. 14, pp.674-689, May 2005.Purdue University97
Introduction Research . Psychology Zygmunt Pizlo . 14e ML1450 LJ1200 0 25 15 0 0 LJ1000 0 35 5