Transcription
The Universal Sports DatabaseLawrence ChangAdvisor: David MartinPage 1 of 23
Table of ContentsAbstract . 3Introduction . 4System Overview . 6Schema . 6Implementation . 12Data scraping . 15Engineering . 17Interface . 19Problems . 20Future Work . 22References . 23Page 2 of 23
AbstractWith vast amounts of data in the world, organization becomes a challenge. The successof data driven web services (IMDb, YouTube, Google Maps, Wikipedia, et cetera) all hinge ontheir ability to present information in an intuitive manner with user friendly interfaces. One areathat fails to have such a service is sports statistics. With the ubiquitous appeal of sports, having asolution to this problem can be universally beneficial. Many sites exist that have statistics ofdifferent sports, but there are limitations to all of them. Since there is very little continuityamong all sports, statistics are represented disparately.There are several problems with this approach. Any time there needs to be a change tothe informational structure, the entire database and interface need to change. In addition, therecan never be a single interface if there are different schemas for different sports, leading to a userunfriendly interface.My system uses a unique schema that is capable of representing statistics from any sport,no matter how unique. Adding new statistics to a sport to reflect rule changes or adding a newsport altogether are seamless. In addition, the web interface is structured by Rails, whichchanges automatically with the schema.Challenges included developing a universal sports schema and testing it sufficientlyenough to prove its generality. Finding and extracting the data to populate the database alsopresented difficulties.Page 3 of 23
IntroductionAs an avid fan of sports, it seemed fitting to write a thesis that incorporated technologywith my interests. One thing that sports fans care a great deal about are statistics. Thesenumbers, when put into context, are able to give objective information about a sporting event:results that are undeniable and real. As a result, not only are there mainstream sports sites wheremost people obtain information on current sporting events, but numerous sports statisticsdatabase services as well.After exploring the sports data services available, it became apparent that every sport waspresented in its own way. Databasesports.com, a “comprehensive” service that providesinformation on multiple sports, is subdivided by sport. One could easily find who had scored themost points in basketball (NBA and ABA), but anything that crossed sport boundaries wasimpossible. For instance, someone may be curious to know who had the most number of stolenbases, whether it was from Major League Baseball, Dominican League, or Japanese League.This person would be forced to find the leader from each respective league and manually figureout the answer. Another individual may wish to know the most number of interceptions in anAmerican football game, including the National Football League, Arena Football League, XFLand the Canadian Football League. Once again, since these are considered different sports(different rules, regulations, teams), the information could only be found by manual compilation.Finally, if one wanted to find out who was the oldest active professional athlete in any sport: thatwould be a task for the ages.The problem is that there is no clear way to represent sports statistics in a unified way.Aside from the aforementioned examples where the sports are essentially the same, the majorityof sports are vastly different from one another. Every sport needs to be put in its own databasePage 4 of 23
schema as well as have its own interface. As a result, there is no singular database scheme andno single interface.This project sets out to resolve this limitation. The task was divided into three mainparts: 1) create the universal sports schema, 2) implement the schema using at least threesufficiently different sports, and 3) populate the database with relevant data to prove the concept.Much of the inspiration came from the Internet Movie Database service, or IMDb. Thisweb site offers information about the entire American entertainment industry, from movies,actors, directors, and television shows. It is the ultimate resource for all things Hollywood. Thebest feature about IMDb is that its data is organized in a perfectly intuitive way. Say one werecurious to know who played the mother of the leading actress in the newest Peter Jackson movie.One could simply search Peter Jackson and find a list of all his works; from these, select thecorrect film; and finally, look on the list to see the actress. This project attempts to bring asimilar ease to finding anything sports data. The ultimate goal is to have the “IMDb of Sports.”Page 5 of 23
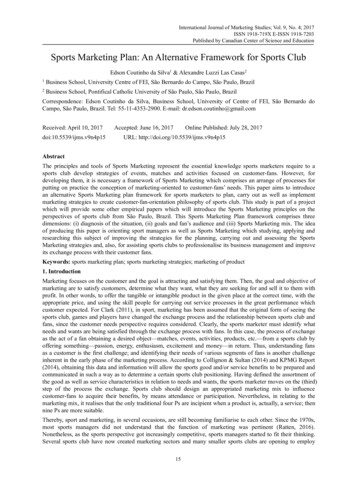
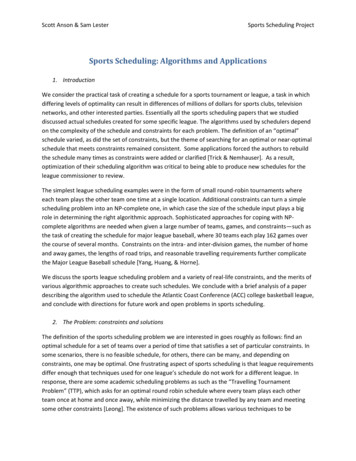
System OverviewDatabase: SQLiteInterface: Ruby on RailsAutomation: RubyData scraping: Hpricot, FirebugSchemaa. Current schema organizationsCertain forms of data naturally span all sports, namely those that are unrelated to sports at all.These include information like an athlete’s name, birth date, birth place, height and portrait. It isthe more specific statistic types that cause problems with unification.Based on existing sports database interfaces, it is not too difficult to see how their data isorganized. On a basketball player’s page, one sees a list of seasons played. For each seasonthere are a number of statistics (total points, total rebounds, games played, minutes, et cetera).For each season there are corresponding links to the team and the league (Los Angeles Lakers2001, NBA 1993, etc). Figure 1 shows a sample player’s page. From this information one canmake a reasonable assumption about the database organization employed by this service.The main tables are player, team by year, and league by year. These tables would be in adatabase named basketball. Statistics can be recorded in a variety of ways. Giving currentlyavailable services the benefit of the doubt, let us assume their data is organized to not haveredundancy. For example, only data from individual games are recorded. Then, cumulative orcomputed statistics are figured out on the fly (assists in a particular game versus assists in aseason). In this scenario, there needs to be a table corresponding to a game and onecorresponding to a statistic such as points, rebounds, and assists. Figure 2 shows a schemarepresentation of such an organization.Page 6 of 23
Figure 1Figure 2Page 7 of 23
b. Proposed schema organizationSuch existing models work fine when dealing with a single sport. However, imagine if theservice wished to provide information on another sport, such as tennis. The programmers wouldhave to create an entirely new database with new tables and a different organizational structure.In basketball, all games are played by two teams. In tennis, there are both singles and doublesmatches. Would this lead to having two different tables representing a tennis match, perhapssingles match and doubles match? And what of the teams? Singles matches are one on one,where as doubles are two on two. How should games and teams and individuals be organized?There are numerous differences between the sports that create difficulty in terms of coherent dataorganization. How would this service deal with representing marathons, stock car racing orhorse racing? The more varied sports become, the greater the difficulty of sustaining a sportsdatabase service.Approaching this problem from the standpoint of database schema design, it lends itself tohave a table representing a person or player. A team table is needed. A team, by definition, canhave one or more players. Therefore, my schema could enforce the rule that all games arebetween teams. If a team represents an individual, conventions can be implemented to accountfor this, such as having a team with the same name as an individual or having a team with a null(nil in Ruby) name. Since a team can have multiple players, and a player can be a part ofmultiple teams (different seasons), an intermediary table needs to exist, perhaps called rosterspot.Teams can be associated with leagues (Los Angeles Lakers as a member of the NBA), but forsimplicity I chose to neglect different leagues and assume all teams to be part of their respectivesports (Los Angeles Lakers as a member of sport Basketball).Page 8 of 23
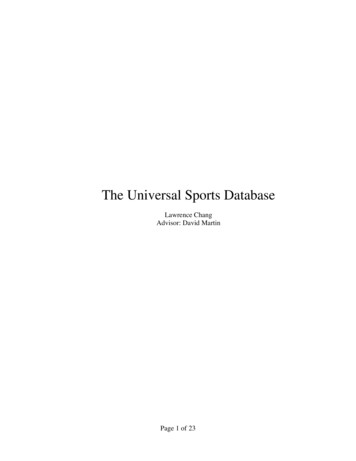
Dealing with the organization of personnel and sports and teams is not very difficult. Tocreate the aforementioned scheme only one level of abstraction is needed: by having individualsas their own “teams”. The problem becomes significantly more difficult when dealing withstatistics from different types of sports. For Americans, the traditional sports involve scoringmore points than the opponent. Then there are the sports where the time is the most importantfactor. And in others, placement determines the winners.After much deliberation between my advisor and myself, the schema was produced providesenough abstraction to account for any sports statistic. The highest level abstraction is an objectcalled unit. The unit table is used to describe what kind of statistic something is. The unit willdenote how to compare other things of the same type. The most basic unit is count. A countdenotes a statistic that is simply an accumulation. In American sports the most notable statisticsare ones that are counted, such as home runs, touchdowns, and points. To encompass this unitwith something that more accurately describes the statistic, we create the statconcept. Astatconcept is an object that ties together a unit and sport. Home runs, goals, and yards are allexamples of statconcepts. In traditional database terms, a statconcept has the foreign key to aunit. Finally, an actual statistic, which we will call stat, will record the value. A stat object willreference a statconcept object, a game object, and a player object. Figure 3 shows theserelationships.Page 9 of 23
Figure 3Using this schema, any numerical value can be recorded and reflected as a sport statistic.Counts are obvious and trivial. With times, the units can be in seconds: minutes and hours canbe computed on the fly from this data. Placement is similar to count except lower numbers arebetter.Figure 4 shows the entire schema.Page 10 of 23
Figure 4Page 11 of 23
ImplementationTo ensure the schema’s universality, statistics were implemented for the sports basketball,tennis, and stock car racing. Stats composed of two or more other stats, or ‘derived stats’, arediscussed at the end of this section.Basketball is the more traditional among the three chosen sports in terms of statistics. Themost common statistics associated with basketball are: points, minutes, field goals made, fieldgoals attempted, free throws made, free throws attempted, three pointers made, three pointersattempted, offensive rebounds, defensive rebounds, assists, blocks, turn over’s, and personalfouls. All of these statistics can be classified by the unit “count” since they are measured bycounting the number of occurrences and compared strictly numerically. Statistics of these typescan be associated with Statconcept’s identified simply by the name. There is a Stat with thevalue ‘81’, Player named ‘Kobe Bryant’, and Statconcept named ‘points’. The Statconcept‘points’ would be associated with sport ‘Basketball’ and Unit ‘count’.Attempting to create a statistical structure around the sport tennis poses several challenges.Like basketball, there are various aspects of the game that can be recorded by simply countingthe number of occurrences. These include serves, aces, double faults, winners, at-net wins, at-netattempts, et cetera. However, these statistics are less important to tennis fans and thus rarelyrecorded past the lifetime of the match (game means something different in tennis). What isrecorded are set scores and tie breaker scores.Using the same strategy as basketball statistics does not work. There is no singular numberto represent a set score for a match because there are varying numbers of sets. The method tosolve this problem is to add a level of abstraction by dividing a match into distinct sets bynumber. A tennis match has at least one set played and at most five sets. A set either has atiebreaker score or does not. Using these facts, all singles set scores can be represented using tenPage 12 of 23
Statconcept objects (five for set scores and five for tie breaker scores): SinglesSet1, SinglesSet2,etc, SinglesSetTie1, SinglesSetTie2, etc. These would correspond to unit object ‘count’.Another ten would take care of doubles matches as well. Let us take a recent match betweenRafael Nadal and Nikolay Davydenko at the Monte-Carlo semifinals as an example. Nadal wonthe best-of-three match in two sets with scores of 6-3 and 6-2. Each match is given a uniquegameid, so we will use this as the name of the match (Game). The Stat’s corresponding to thefirst set would be: Stat(1).player Nadal, Stat(1).value 6, Stat(1).Statconcept SinglesSet1,Stat(2).player Davydenko, Stat(2).value 3, Stat(2).Statconcept SinglesSet1. The second setis trivial: Stat(3).value 6, Stat(3).Statconcept SinglesSet2, etc. Both Stat objects would sharethe same ‘game’, perhaps Stat(1).game Game.find by name(g), where g is the name of thematch. If there had been a tiebreaker in the second set with score 7-4, there would be additionalStat objects to represent the data: Stat(4).Statconcept SinglesSetTie2, Stat(4).value 7,Stat(4).game Game.find by name(g), Stat(5).Statconcept SinglesSetTie2, Stat(5).value 4.Stock car racing’s main body is the National Association for Stock Car Auto Racing, orNASCAR. There are various NASCAR racing series, the biggest being the Sprint Cup Series.During each race, a driver accumulates points that go toward winning the cup, as well as prizemoney. Times are not important; only the final position matters. Several statistics are numericaland can be ‘count’ stats. These include laps, money, points, laps led, bonus, and penalty. Thenthere are the statistics of position. We introduce a new Unit called ‘position’. These stats arefinal position and starting position. Finally, various non-competitive “statistics” exist inNASCAR due to the nature of the sport and sponsorships. These are car number and carmanufacturer. Another new Unit to account for these can introduced called ‘non-competitive’.Page 13 of 23
It is trivial to understand how to implement the countable NASCAR statistics. Using unit‘position’ define Statconcept objects ‘start position’ and ‘final position’. At the 2008 Talladega499 race, Dale Earnhardt Jr. started in pole position 9 and finished in final position 10. The Statobjects associated with these are: Stat(1).start position 9, Stat(2).final position 10. Inaddition, Earnhardt Jr. drives the number 88 race car made by Chevrolet. Using Unit ‘noncompetitive’, we define Statconcepts ‘car number’ and ‘car make’. The corresponding stats canbe Stat(3).car number 88, Stat(4).car make ‘Chevrolet’. All of these Stat objects would betied to a Game object named for the event such as ‘Talladega 499’.Even with significantly different types of data, this schema is able to represent allstatistics effectively. As previously mentioned, this schema has not yet handled statistics basedon combinations of multiple statistics. These include common statistics such as a baseballplayer’s batting average, basketball player’s shooting percentage, or the ever useful baseballpitcher stat WHIP, which stands for Walks plus Hits per Inning Pitched. In staying with thespirit of not duplicating any data, these statistics must be derived from already existing data.Statconcepts that are of this form have another Unit type, thus we introduce ‘derived’. However,this new unit does not tell a machine how to compute a derived stat. The name of theStatconcept should remain something humanly intelligible (‘Batting average’, ‘WHIP’, etc). Tohave a machine-intelligible representation of derived statistics, we create two new models:Formula and Formula SC, which acts as a join table. Formula will have a string representationof a mathematical formula. Given a derived stat defined by three variables a,b,c and formula(a b)/c, this can be translated to the string “. . . /”, a postfix representation. The dotscorrespond to the variables. The order in which to use the variables lies in the Formula SCmodel. These objects are defined as “acts as list” in the model. Using the current example,Page 14 of 23
variable a is be defined as first, b as second, and c as third. When computing the derived stat, thecorresponding Formula SC object would be referenced whenever a ‘.’ was encountered in theFormula’s string field. Methods used would include move to top, which goes to the first of theordered objects, and increment position to move to the next object.Let us take the WHIP statistic as an example. The Statconcept objects necessary areWalksAllowed, HitsAllowed, and InningsPitched. The Formula can be defined as ‘WHIP’ andhave a string field that holds “. . . /”. The Formula SC objects all have formula id Formula.find by name(‘WHIP’). The first object has statconcept id Statconcept.find by name(‘WalksAllowed’), the second by ‘HitsAllowed’ and third by‘InningsPitched’. These objects can be put into the proper order using the insert at method.Data scrapingTo thoroughly test the schema it is crucial to use large data sets. To do this the schema wasapplied to three sufficiently varied sports’ statistics. The three chosen were basketball, tennis,and stock car racing (NASCAR). (At the time of writing this I have only completed data entryfor basketball and tennis.)Several sources were reviewed for possible data collection. Most obvious were the existingdatabase services on the web. However, many were limited to certain sports like basketball,football, baseball and hockey. There was also no guarantee about the accuracy of their data northe timeliness of their updates. For accuracy, professional services like the Elias Sports Bureauwere considered. ESB turns out to be too professional; their services are not freely available tothe public. The third and eventual choice was ESPN.com. ESPN is renowned for their up todate and accurate sports information (they get their statistics from ESB). Another feature is thePage 15 of 23
breadth of their coverage, providing information on all the world’s most popular sports. It wasthe best place to get the necessary information.It was clear that an automated system was needed to collect new data while going back toolder records for past data. One convenient feature about ESPN’s stat pages is that they havelinks to navigate forward or backward one day. With this knowledge in hand, it was only amatter of writing a logical program flow that extracted data, inserted into my database, thenmoved to a different day. Figure 5 shows an example of a working script.Figure 5Data was extracted from web pages using Ruby’s Hpricot library. The required libraries arerubygems, hpricot, and open-uri. An XML page is pulled from the designated URL and brokeninto the underlying tree structures. With this, XPath’s (XML Path Language) can be specified toPage 16 of 23
reach specific parts of the XML tree. Because each statistics page is generally composedidentically, noting the XPath values on one page will usually correspond to the same data fieldson another page. The XPath’s were figured out using a Firefox plug-in named FireBug. FireBugbreaks XML into a directory tree structure that shows where certain data is located.Because Rails is used as the web application framework, coupled with the existence ofHpricot, the scripts are written in Ruby. Very similar to the free flowing nature and simplicity ofMatLab, concepts can quickly be translated to code. Parts of the script pull and analyze theHTML pages where data lie. The data (statistics) collected are then put into an XML file withspecifically chosen structures. Finally, another script is called and piped into the Ruby consoleto read this file and input the data into the Rails database. This other script uses Rails commandsto create or edit the necessary data fields, as shown in Figure 6.Figure 6EngineeringSeveral requirements had to be met to produce a viable automated system:1. The script can start at any time and not produce false data.2. The script can be run over and over without issue.3. The script can be stopped at any time.To ensure that any automated script could start at any time, the initial starting URL is hardcoded into the program. In my master tennis script.rb program, the default starting URL isESPN’s daily scores page lts). Starting on thecurrent day, the script then moves backwards in time to all previous days. The URL for theprevious day would look something like dailyResults?date 20080426, which would make thecurrent day URL equivalent to dailyResults?date 20080427 (notice the date at the end). OncePage 17 of 23
the data from a day has been recorded, the date itself is saved into a text file. The script uses thistext file to determine whether a date has been seen or not. By using system(command), the scriptcan easily call grep –q to determine whether a string exists in the file or not. The –q optionreturns a true or false result to the script.There are various methods databases employ to validate data. Traditionally the checks areperformed either by the interface code or internally within the database. Both methods arecumbersome and impractical. If the validation lives in the interface, business logic becomespublic. If it lives in the database, any changes to business logic would require manually updatingthe database using SQL. Using Rails’ MVC (Model-View-Controller) architectural pattern, allbusiness logic can exist within the model, thus hiding it from people who should not have accessto it while making it easy to edit if need be. With these safe guards in place inside the models,running the same script over and over will not result in duplicate data being saved to thedatabase. Of course, this relies on the correctness of the logic. A good example of this logic canbe shown through the Stat model. Individual statistics are data that have the greatest risk ofduplication. If a script is run to capture last week’s data, then run again to capture all datastarting from this week, would last week’s information not get doubled in the process? Figure 7shows the code for the Stat model.Figure 7A Stat object must tie in three different objects: player, game, and statconcept. This isaccomplished by validating their existence whenever a Stat object is created. It also verifies thatthere exists a value because having a statistic without a value makes no sense. Using the threePage 18 of 23
other objects, the ‘validates uniqueness of’ line guarantees that no other stat object will have thesame combination of sport, statconcept and game. The line literally states that there can be onlyone statconcept for a player in a given game. For example, a basketball player can not have twodifferent point totals for the same game. These validations will prevent any duplicate data frombeing entered into the database, thus ensuring that the script can run over the same data multipletimes and will input only unique data.The issue of stopping the script is minimal but necessary to maintain an accurate database. Ifa certain day has been processed but the script is killed before the date is recorded, then the daywill get processed again. This is not incorrect behavior since the Stat validations will maintaindata integrity. If the program is killed during the Rails console data input, the behavior is stillcorrect because re-running the script would get any missed data. The only problem that mayarise is if a day is recorded as processed but the script is killed before it actually is. All that isneeded to prevent such behavior is to always perform the action before recording it.InterfaceThe interface is a web based tool that creates dynamic web pages using the database. This isall done by Rails. With the object oriented nature of Rails, the code to find specific data fordisplay becomes trivial. Figure 8 gives some examples of using Rails objects to get specific datavalues:To get a player’s birthday: Player.find by name(“Bryant, Kobe”).bdayTo get all stat’s of a player:Stat.find all by player id(Player.find by name(“Armstrong, Lance”).id))Figure 8Page 19 of 23
These methods can be called directly by the controller. The view corresponding to thecontroller then has access to all of its variables. The views themselves are able to execute rubycode, much like embedding PHP into standard HTML. Using standard for-each loops, a viewcan loop through and display a data from any list.Problemsa. Hpricot and Firefox/Firebug normalizationOne of the things that the Firefox browser does is perform HTML normalization. Thisprocess is necessary because not all web pages are formed correctly, thus Firefox compensatesby inserting additional structure into the XML tree. Firebug, which is a plug-in for Firefox, thenuses this normalized HTML to compute the XPaths.The problem with this is that Hpricot does no such normalization. Instead it pulls pagesdirectly from the server and uses them unaltered. Therefore, not all XPaths derived usingFirebug will work in Hpricot. This issue threw me off for a while. I was also unclear on XPathdefinitions such as div classes being defined by div.classname, while div id’s were defined bydiv#idname. After some helpful assistance from my advisor I was able to get Hpricot to workwithout using Firebug’s auto generated XPaths but by manually looking at the tree structure tofind the data I needed.b. ESPN versus other sourcesAlthough ESPN is the most comprehensive site I found in terms of breadth, they are not thebest source when needing to collect data older than a few years. For basketball game scores, ifthe URL has a date that was not recorded (?date 19980809) the page automatically redirects tothe current day’s page. If I chose to use a more data oriented web site I would lose out on thebreadth of sports.Page 20 of 23
c. Learning Rails on RubyEveryone knows that Ruby on Rails is the new way to develop data driven web services.People even go so far as to say that the days of PHP and MySQL embedded into HTML are over.What they fail to realize about Rails is that it is not the easiest thing to learn to use. Anyprogrammer can easily pick up PHP and SQL to start pumping out web pages. With Rails, thereis an enormous amount of structure and behind-the-scenes activity. Rails provides a great toolset to create, but learning to use the tools comes with a steep learning curve.To start using Rails I followed numerous tutorials found online and in books. These havelimited value. They are great to learn how to build simple applications that are similar to thetutorials, but do not provide enough information for someone to truly develop independently.That was the problem I faced. I could probably build a cookbook/recipe site with my eyesclosed, but what I wanted to do was make a user friendly sports database.After struggling to produce a few tangible results with Rails, most of which were basicallyenormous hacks, I shifted gears and began the data import/export process. During this time I hadto become very familiar with Ruby since I was writing scripts and using Hpricot. Much of mywork was done in the Ruby console, an environment very similar to a MatLab command line.After becoming comfortable with Ruby I found it much easier to start solving problems usingRails. The one advice I have for anyone attempting to learn Ruby on Rails is to start with Ruby.I do not think it is enough to just understand the syntax and loop structures of Ruby; one shouldbe very comfortable with it.d. The novelty of Ruby on RailsBecause Rails is still relatively new, significant changes are made to it by its core teamfrequently. This results in several obstacles for a beginner. First, there are fewer sources onlinePage 21 of 23
on particular bugs or problems. Second, tutorials get out of date quickly, thus the learning curvebecomes steeper than it already is. Finally, there are not many people around who are experts onit, making it that much more difficult to learn.Future WorkIn order to have a convincing result about the capability of my univ
parts: 1) create the universal sports schema, 2) implement the schema using at least three sufficiently different sports, and 3) populate the database with relevant data to prove the concept. Much of the inspiratio