Transcription
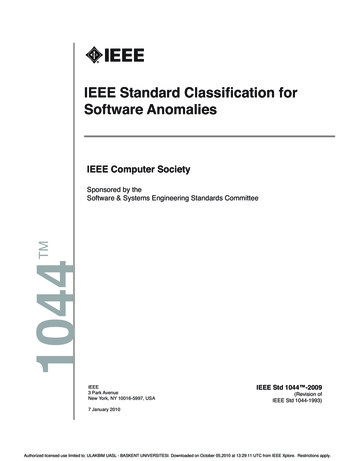
A Method to Apply IEEE Std. 80 Safe Touch and StepPotentials to Relay CoordinationDr. Lance Grainger, P. Eng. & Mr. Richard Boulton, P. Eng.October 29, 20051IntroductionThe purpose of this paper is to outline a method of integrating protection & control designpractices and grounding design practices. We will show how to relate body current to thesubstation ground fault current and use this to develop a “Human Tolerance Curve” which can beplaced on a relaying time current coordination curve. We will then show a method to coordinatethis with protective relaying, giving an example of a re-closer application. We will also give anexample of a bus fault fed from multiple sources and show how to check whether or not theground grid is safe for the sequentially cleared fault.IEEE Std. 80 is widely followed as the basis for designing substation grounding. The standarddefines, in general terms, parameters that should be used and/or considered in the substation griddesign. Several of these parameters directly relate to protection & control including, thefollowing:1. Fault magnitude2. Fault duration (primary & backup)3. Impact of auto-reclosingThe ground grid is designed to limit the flow of body current in personnel working in or near tothe substation. Biegelmeier and Lee (in their paper “New considerations on the threshold ofventricular fibrillation for AC shocks at 50-60 Hz” in Proceedings of the IEEE Vol. 127, pp 10310, 1980) indicate the maximum allowed body current which is on the threshold of fibrillation ofIEEE Std. 80 Threshold for Human Body Current1000FIBRILLATION LIKELY100Current(mA)FIBRILLATION UNLIKELY10110100100010000100000Time (ms)70 kg (154 lb) Minimum Weight.Page 1of 13500 mA50 mAFigure 1 – Biegelmeier and Lee Limits on IEEE Std. 80 Curve
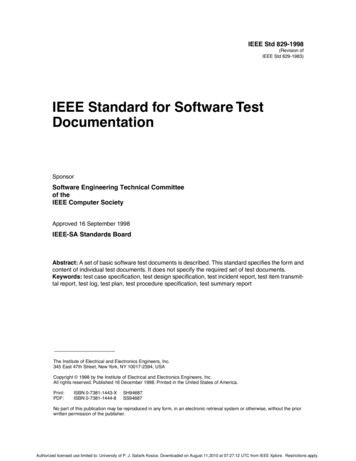
the heart muscles is 500 milliAmp. They also indicate that a body current of 50 milliAmp can besustained for very long periods. The safe current between those two limits is described in IEEEStd. 80 to be proportional to the square root of the time of duration of the shock. In Figure 1 wehave combined the Biegelmeier & Lee limits with the I t curve.For a 70-kg human the knee points of the curve occur at 0.0986 seconds and 9.86 seconds. For a50-kg human the knee points occur at 0.0538 seconds and 5.38 seconds.Inter-changing the time and current axes, we obtain a diagram similar to those used for relaycoordination. This curve is of the correct form, but to be useful it must be expressed in terms ofsubstation ground fault current as opposed to human body current. This relationship isdeveloped in the next section.IEEE Std. 80 Threshold for Human Body CurrentAxes Interchanged100000FIBRILLATION LIKELY10000time(ms) 1000FIBRILLATION UNLIKELY100101101001000Current (mA)70 kgDangerSafeFigure 2 – IEEE Std. 80 Curve With Time & Current Axes InterchangedPage 2of 13
2Relating Human Body Current to Substation Ground Fault Current2.1Development of Equations2.1.1Equations taken from the StandardThe following equations are taken from IEEE Std. 80-2000 “IEEE Guide for Safety in ACSubstation Grounding”. The equation numbers used in this paper refer to the numbers used inthat standard for ease of cross-referencing. For equations that we derive, a lettering scheme isused.For a 70 kg personE step 70 (1000 6 C s ρ s ) 0.157(30)tE touch70 (1000 1.5 C s ρ s ) 0.157t(33)Estep is the step voltage safe limit in voltsEtouch is the touch voltage safe limit in voltst is the duration of the shock current in secondss is the resistivity of the surface layer in ohm-metersCs is a calculated parameterIG D f I gwhereis the frequency in radians per second ( 2 60 in North America)IG is asymmetrical grid ground current in ampsIg is symmetrical grid ground current in ampsDf is the asymmetrical factor that depends upon the X/R ratio of the fault 2tTa1 e TD f 1 atsubstituting T a D f 1 Page 3of 13XωRt(64)(79)Xinto (79) we arrive atωR1 e 2ωRtX(a)
The grid ground current is proportional to the line to ground fault current and is related by a splitfactor Sf . This paper will make the simplifying assumption that the ground grid and substationwill be designed based upon the assumption that all the line to ground current flows through theground grid, hence Sf 1 and Ig is equal to the line to ground current.When fault current flows from a grid into the earth, it creates Mesh Voltage and Step Voltage,either of which may drive current through the body of a person in the substation at the time ofthe fault.Em ρ Km Ki IG(80)LMρ K s Ki IGEs (92)LSEm is the mesh voltage in voltsEs is the step voltage in voltsis the resistivity of the soil in ohm-metersKm, Ki and Ks are factors calculated in IEEE Std. 80LM and LS are equivalent lengths of the conductor and rods buried in the grid2.1.2Development Of Useful RelationshipsIn any given design, the design may be limited by either step or touch considerations. For a safedesign where step is the limiting condition we may assume the allowed step potential Estep isequal to the fault induced step potential Es at the maximum design fault as one of the boundaryconditions of the design. At the boundary condition equating equation (30) to equation (92) wearrive at:ρ KsKiIGLS (1000 6 C s ρ s ) 0.157t(b)Re-arranging(c)I G t L S (1000 6 C s ρ s ) 0.157 ( ρK s K i)Similarly for a safe design where touch is the limiting condition we may assume the allowedtouch potential Etouch is equal to the fault induced mesh potential Em. at the maximum design faultas one of the boundary conditions of the design.At the boundary condition equating equation (33) to equation (80) we arrive at:Page 4of 13
ρ KmKiIGLM (1000 1.5 C s ρ s ) 0.157t(d)Re-arrangingI G t L M (1000 1.5 C s ρ s) 0.157 ( ρK m K i)(e)Once the design is completed, many of the design parameters become fixed and can then betreated as constants. This is because they depend upon the material used in the design, the soiland surface gravel resistivities, and the lay out of the grid and these items do not change oncethey are implemented by the design. These physical factors will be constant over some usefullife of the substation. This means that for either boundary condition, the product ofasymmetrical-ground-fault-current times the square root of fault-duration-time may practicallybe taken to be a constant for a given substation design.Thus we can re-write both equations (c) and (e) as:I G t Human Tolerance Constant2.1.3(f)“Human Tolerance Curve”Substituting equation (64) into equation (f) givesD f I g t Human Tolerance Constant(g)This equation becomes the basis for this paper. To calculate the constant one needs to know thedesign value of the maximum ground fault symmetrical current, the X to R ratio of the groundfault, and the duration of the fault assumed by the substation ground grid designer. Df can thenbe calculated from equation (a) for any selected time. Ig can be calculated at any given time bydividing the Human Tolerance Constant by Df and the square root of t. Calculating a series ofcurrents and plotting them against time, we have a time dependent curve applicable to aparticular substation. All that is left to do is to bound the curve with the Bigelmeier and Leelimits.When the curve is generated it is bounded by a vertical line on the left side at .09864 secondswhich corresponds to 50 milliamps flowing in the body of a 70 kg person, and on the right sideby a vertical line at 9.86 seconds, which corresponds to 500 milliamps flowing in the body of a70 kg person. The result is the “Human Tolerance Curve”.Page 5of 13
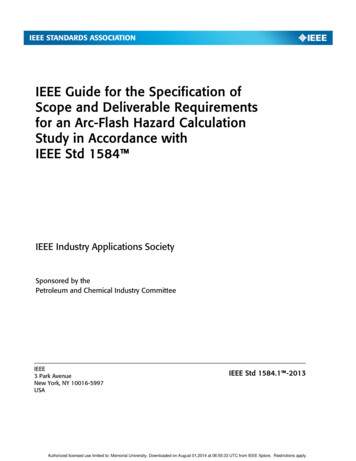
3Application to Relay Settings3.1Example 1 – Coordinating Relay Settings With a Ground Grid DesignAs an example let us assume a ground grid design has been made which is calculated to be safefor both step and touch conditions with a ground fault of 7500 amps lasting less than a durationof 0.5 seconds and an X to R ratio of 12.6. We know the secondary fault level is 4200 Amp(limited by a Peterson coil) and wish to confirm our re-closing scheme on the secondary feederswill not cause a hazard for personnel in the substation in the event of a fault which does not clearimmediately.Calculating the constant of equation (g) we must first determine the Df factor at 0.5 seconds.Df 1 12.6377*0.51 e 2*377*0.512.6Df 1.033 for 0.5 secondsFrom this we can calculate the Human Tolerance Constant for the substation:Human Tolerance Constant (1.033) (7500) (.707) 5478Next Df is calculated at selected times and is used in connection with the Human ToleranceConstant to calculate current at those times to generate a curve. To illustrate we calculate a pointon the curve at 2 secondsDf 1 12.6377*2.01 e 2*377*2.012.6Df 1.008 for 2.0 secondsIg 5478 38701.008 * 2.0By a like calculation other points on the curve can be established. Of particular interest are theBiegelmeier & Lee limits.t (sec)0.09869.86Df1.15561.0017Ig (Amp)150351735With this information the Human Tolerance Curve can be placed on the Time CurrentCoordination Curve (TCCC). See Figure 3.Page 6of 13
Human Tolerance vs Feeder Ground Relay1000100Human ToleranceTime, s1010.10.01100100010000100000Fault Level, AFigure 3 – Human Tolerance Curve Added to TCCCNext the fault levels for primary and secondary faults can be placed. For this particularsubstation the primary side ground fault governed the design, so the primary fault at 7500 Ampjust touches the curve at 0.5 seconds. For the substation to be safe both faults must be to the leftand below the tolerance curve. For this substation the designer was aware that relaying practicesin his company would ensure that the primary fault duration would be controlled to less than 0.5seconds even in the event of breaker and/or protection failure. The secondary fault durationneeds to be controlled to less than the time (1.65 seconds) where the secondary fault intersectsthe Human Tolerance curve. The secondary fault has intentionally been placed with a largeduration with the intention that it will have its duration controlled by the protective relays. Thisis shown in Figure 4.Page 7of 13
Human Tolerance vs Feeder Ground Relay1000Human Tolerance100LV Side FaultHV Side FaultTime, s1010.10.01100100010000100000Fault Level, AFigure 4 – Primary and Secondary Faults Added to TCCCNext, the time current curve for the feeder relay is placed on the TCCC.Human Tolerance vs Feeder GroundRelayHumanToleranceFeeder Initial Trip1000100LV Side FaultHV Side Fault10Time, s10.10.01100100010000100000Fault Level, AFigure 5 – Relay Curve Added to TCCCAs can be seen in Figure 5 the selected relay curve coordinates well with the Human ToleranceCurve. This particular relay has an instantaneous trip element for faults greater than 1440 Amps.The clearing time for Ig greater than 1440 Amp has been shown conservatively as 0.1 seconds torepresent the clearing time of the 5 cycle breaker plus an allowance for the reaction time of theprotective system. Note that this instantaneous relay element truncates the fault duration tomuch less than the 1.65 seconds where it formerly intersected the tolerance curve.Page 8of 13
However, should a re-closing scheme be applied, IEEE Std. 80 suggests the successive faultclearing times should be considered to be cumulative with respect to human tolerances. Addingtwo re-closures to the relaying results in Figure 6. The cumulative clearing time is just below theHuman Tolerance Curve. Note that in this particular design the instantaneous element is blockedduring re-closing. The times when the breaker is open between recloses are neglected.Human Tolerance vs Feeder GroundRelay1000HumanToleranceFeeder Initial TripLV Side Fault100Feeder After 1stRecloseFeeder After 2ndRecloseHV Side Fault10Time, s10.10.01100100010000100000Fault Level, AFigure 6 – Relay Reclosure Curves Added to TCCCTo complete the analysis, the feeder backup protection needs to be plotted. At this substation,feeders are backed up by the step-down transformer over-current protection. This curve has nowbeen added to the chart in Figure 7.Human Tolerance vs Feeder Ground RelayHuman ToleranceFeeder Initial Trip1000LV Side FaultFeeder After 1st Reclose100Feeder After 2nd RecloseHV Side FaultLV Backup ProtectionTime, s1010.10.01100100010000100000Fault Level, AFigure 7 – LV Backup Protection Curve Added to TCCCThe conclusion is that the re-closing protection scheme coordinates with the Human ToleranceCurve, hence the safety of the substation has not been compromised by the relay settings.Page 9of 13
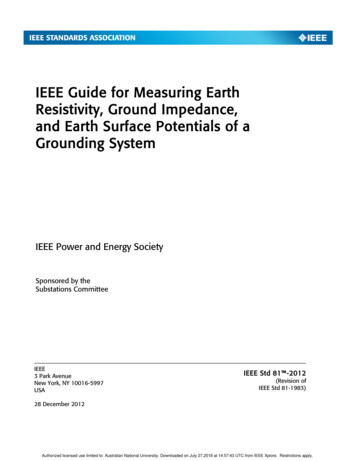
While the previous example has been worked from the viewpoint of fitting a protection curve toan existing substation design, the reverse procedure is also applicable. If the desired re-closescheme is known at the time of the substation’s functional specification, then the ground grid canbe designed to accommodate it.3.2Example 2 – Analyzing a Substation With Multiple Fault SourcesIn this example, a substation is fed from five sources. As there is no local bus protection, busfaults must be cleared by line protections at the remote-end of each line. As designed, eachsource is interrupted at a slightly different time. The clearing of a line-to-ground fault issummarized in the following table.ConditionFault occursSource 1 clearsSource 2 clearsSource 3 clearsSource 4 clearsSource 5 clearsLG Fault (A)42683774353111485100Clearing Time (msec)04508208409401250At this substation, the ground grid was designed to accommodate a ground fault of 6 kA for aduration of 0.5 seconds with an X/R 10. The designer needs to determine whether or not thedesign is safe with the existing relay settings for the sequential clearing of the fault sources. TheGround Fault X/R 3.7It is stated in IEEE Std. 80 - 2000 on pages 12 and 84 that the fibrillation threshold is related tothe energy absorbed by the human body. Body current is proportional to ground fault current.While energy cannot be calculated directly we know it is related to I2t. Our method is to firstdetermine the I2t value of each time segment of ground fault.50004000Figure 8 – Sequentially Cleared Fault3000If( t )200010000Page 10of 1300.25 0.5 0.75t11.25 1.5
We sum these to determine the total I2t contained by the fault, and then divide this by the squareof the maximum fault to arrive an equivalent time duration. Were the fault to be maintained atits maximum value for the equivalent time duration, it would contain the same energy as theactual sequentially cleared fault. This is plotted on a TCCC and compared to the HumanTolerance Curve for the substation ground grid design.First we establish the fault times of the five fault segmentst1 0.45I14268ta.45t1taI23744tb.82t2tbtat2 0.37I33531tc.84t3tctbt3 0.02I41148td.94t4tdtct4 0.1I5510te1.25t5tetdt5 0.31The times with alpha subscripts relate to the clearing times listed in the table. The times withnumeric subscripts describe the duration of each fault interval.Using software such as Mathcad we can define the decrement factor as a function of time.The decrement factor accounts for asymmetry in the fault current.D f (t ) 1 X1 e 2ωRtX(h)ωRtNext we calculate the Decrement Factor value for each fault segment. Note that the decrementfactor is based on elapsed times (with alpha subscripts) as the asymmetry decays over the courseof the fault. Df is calculated below for each of the clearing times.1.1Df( ta ) 1.011Df( tb ) 1.006Df( t ) 1.05Df( tc ) 1.006Df( td ) 1.005Df( te ) 1.004Page 11of 13100.51tFigure 9 – Decay in Df with time
The I2 Df2 t value is calculated for each fault segment and the result is summed. Note that thetimes with numeric subscripts are used for segment duration while times with alpha subscriptsare used to calculate the Decrement Factors.C122I1 . Df( ta ) . t1C222I2 . Df( tb ) . t2C322I3 . Df( tc ) . t3C422I4 . Df( td ) . t4C522I5 . Df( te ) . t56C1 8.371 106C2 5.247 105C3 2.522 105C4 1.331 104C5 8.125 10The sum of I2 Df2 t components is used to calculate an equivalent fault duration for a fault of aselected magnitude (in this case 4268 Amp). The equivalent time of 0.773 seconds adds aduration of 0.32 seconds to the 0.45 seconds of the 4268 Amp fault.7Csum C1 C2 C3 C4 C5Csum 1.408 10tequivCsum2I1tequiv 0.773A decrement factor was omitted in the denominator to give a more conservative result. In Figure10 this equivalent fault is plotted on a TCCC to see if it coordinates with the Human ToleranceCurve.Human Tolerance vs Equivalent Fault - Multiple Sources and Clearing Times1Design Safety iscompromisedAdded Duration0.32 secondsTime, sOriginal Duration0.45 secondsHuman ToleranceEquivalent FaultFault Magnitude4268 Amp0.1100010000Fault Level, AFigure 10 – Equivalent Fault vs. Human Tolerance Curve for Multiple SourcesPage 12of 13
Unfortunately, the equivalent fault intersects the Human Tolerance Curve as depicted in Figure10 and the safety of the substation design is compromised by the existing relay settings. Onesolution would be to add more copper and rods to the ground grid to increase its human tolerancevalue. Another solution would be to speed up fault clearing by adjusting settings or adding newrelays, thus reducing the cumulative I2 Df2 t value.4Observations and ConclusionsThe proposed method provides the substation ground grid designer and the protective relaydesigner a method to work together to confirm the safety performance of a ground grid designover a large range of conditions and current levels. It ensures that protective relay settings,which are often done at the end of a project, do not abrogate the design assumptions made by thegrid designer.It also provides the ground grid designer with a tool to validate that the ground grid will performto a pre-defined protective relaying functional specification.With the ability to compare fault clearing times and relay curves to the Human Tolerance Curve,deficiencies in substation grounding could be resolved through improved relaying rather thansimply placing more copper in the ground.Page 13of 13
IEEE Std. 80 is widely followed as the basis for designing substation grounding. The standard defines, in general terms, parameters that should be used and/or considered in the substation grid design. Several of these parameters directly relate to protection & control including, the fol