Transcription
Copyright 2010 Rob BookerCopy this book and give it to your friends. Print your own copies and sell them(really), and keep the money for yourself (really). Roll some weed into the pagesand smoke them, if you want. I don’t give a crap. I just want you to make surethat if you give away, print, copy, distribute, sell or do anything with this book,that you list me as the author because, like, hey, I wrote the damn thing, so I getthe credit.Other than that, I would like for as many people as possible to learn about theWallaby Trade — and perhaps, one day someone will make me a coat made ofwallaby leather. Please send said coat to Rob Booker, 1201 Main St., MezzanineLevel, Wheeling, WV, 26003.Oh, yeah, and I’m serious about the copying and distributing thing. Just go nutswith this. Do whatever you want. Once you read this information, it’s as muchyours as it is mine.Here’s where you can download the original publication file, so you can even addto the book, and then sell it or give it away as your own.www.WallabyTrade.comP.S. I apologize in advance for all the bad language in this book.ISBN: 1460957490ISBN-13: 978-1460957493Also by Rob BookerBooks:“Adventures of a Currency Trader”“The Currency Trader’s Handbook”eBooks:“Forex Strategy 10: Low Risk/High Return Currency Trading”
To all the Wallabies who follow me on Twitter, this is for you.Thanks for reading all the crap I’ve been writing.
Contents123456789IntroductionWhat the Hell is a Wallaby?What Can This Wallaby Do?Bearish DivergenceBullish DivergenceBending the Divergence RulesEntering a Wallaby TradeWallaby Trade SizingStop-Losses on the WallabyProfit Targets for the WallabyAppendicesFREE STUFFThe Wallaby Indicator is free and available here:http://www.WallabyTrade.comYou can follow Wallaby trades on Twitter 113125171195
INTRODUCTIONWHAT YOU GET WITH THIS BOOKI’m going to share every last detail about my favorite methodof short-term trading. And you can apply this method tolonger-term trading, too. This book is filled with charts, stepby step instructions, some stories, and quite a bit of offensivelanguage. It shouldn’t take you long to read the book, butI hope you come back to it again and again as you learn totrade the system.I’ve had the Wallaby indicator built for a number of chartingplatforms, and as mentioned a few pages ago, you can havethe indicator for free. In fact, as you’ll learn in chatper 1, youcan even trade the method without the indicator.Most of all, I look forward to hearing from you. Pleasecontact me on Twitter (preferred) or Facebook. This isn’tyour average trading book. But after all, you’re not theaverage trader. And I want to hear what you do with whatyou’ve learned.Let’s dive in. And be warned: It does get a bit sticky at times.
WHAT THE HELL IS A WALLABY?1
2The Wallaby TradeA few years ago, I was in Australia doing a seminar. Duringthese seminars I traded live. I showed hundreds of chartsand broke down every system I used into specific steps. Itwas the most exhausting work I’ve ever done. I met someof my best trading friends at these events — people I’mstill in touch with to this day.I generally invented something new to share with eachseminar group. Creating new systems was fun. I’d havesomething fresh and exciting to offer the traders. Theyknew they were getting the very best I had to give, as wellas the latest information. I had more fun. They had morefun. When we had more fun, we made more money. Youget the point.Well, at this Australia seminar I introduced the WallabyIndicator, which I built in the lobby of the hotel. I can’tremember the name of the hotel chain, but the beds werecrap. It felt like you were lying on Styrofoam. Nevertheless,the view of Darling Harbour from my room was awesome,and I spent a lot of time standing in front of the window,wondering what the hell time it was, and wondering why Icontinued to fly around the world.11. I am not making this up: When I flew on this trip from San Francisco toSydney, the gate agent realized that the name on my passport did not matchmy airline ticket. This was because some jackhole at the U.S. Passport officecould not spell, and because I had been too lazy to take the time to send it infor corrections. Because the gate agent was a little bit flirty, and because I waswilling to act a little bit gay, I got on the plane, anyway, and he even upgradedme to First Class. Fancy!
WHAT THE HELL IS A WALLABY?3Here is a picture I took from my hotel window:fig. 1-1: The view from my room in Sydney, Australia.While sitting in the lobby of the Novotel (wow! Iremembered the hotel name — see, I haven’t damagedevery last brain cell in my skull by flying millions of miles)for a few days, trying to force my body into submission toa 14-hour time change, it occurred to me that I’d like to seea bunch of Stochastic Oscillators on top of one another.No, this wasn’t some kind of kinky dream I’d had (for that,see Chapter 2), but rather, it was a sincere desire to seewhat would happen if I started overlapping indicators.Would these indicators get along? Would they mate?What would they produce?
4The Wallaby TradeOkay, maybe it did get a little bit kinky. I get that way abouttrading.Anyway, the next thing you know, I’m staying up late andwaking up early, and I’m furiously typing away on mylaptop, programming a new indicator. I took standardindicators and used them to do new things. Time passedwithout me even noticing. I skipped meals — even theyummy breakfast potatoes from the Novotel, which wereserved up by this really cute Czech girl.After a couple of days, the indicator was complete. I was inAustralia, so I called it the Wallaby.And now you ask again: What the hell is a Wallaby?Well, I’m glad you asked.The Wallaby Is an IndicatorBuilt From the Stochastic Oscillator.An oscillator is something (duh!) that “oscillates,” or swingsback and forth. When you place an oscillator on your chart,you’re attempting to get a feel for the swinging movement,back and forth, that a financial instrument makes.At the time I built the Wallaby, I’d already been usingoscillators in my everyday trading. You probably have,as well. From the Relative Strength Index (“RSI”) to the
WHAT THE HELL IS A WALLABY?5Commodity Channel Index (“CCI”) to the Stochastic,there are probably hundreds of oscillators out there. Andthey are meant to do just one thing, really: They tell youwhen a financial instrument is overbought or oversold.For the purposes of this book, I’ll use the letters “OB” torefer to overbought and “OS” to refer to oversold, and I’lluse these interchangeably, just to shake things up. By theway, I’ll also use the words stock, currency pair, futurescontract, security and financial instrument — all to referto the types of things you can trade with the Wallaby.A financial instrument is said to be overbought when it’sgone up so high that people/charts/astrologists thinkit’s coming back down again. Most oscillators have a setof lines that will show that this overbought exists. This ishard to describe with just words, so I thought I’d write apoem about it:There once was a stock named FordIt never moved, so people got boredIt went overboughtAnd I bought the stockAnd I can’t rhyme, so the end of this limerickmakes no sense.All right, it’s clear that the poem idea failed. You can besure that I will try it again later on, to see if I can make itany worse.
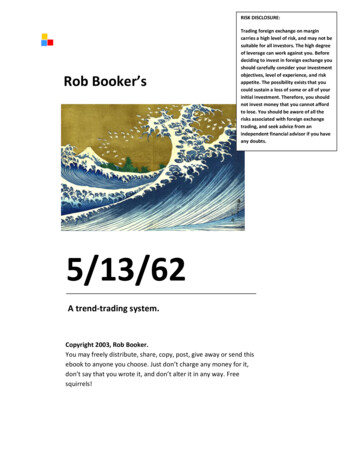
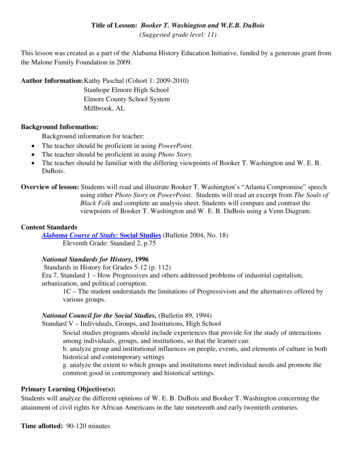
6The Wallaby TradeInstead of trying to work with a poem, let’s just moveonward and show you what an oscillator looks like whenyou plot it on a chart. Behold:fig. 1-2: Oversold!And also:fig. 1-3: Overbought!That’s the regular Stochastic Oscillator. The indicatorwill show two lines, one line that moves faster than theother. When the faster line goes above 80, we call that
WHAT THE HELL IS A WALLABY?7overbought, and when the faster line goes below 20, wecall that oversold. When both lines go above 80 or below20, we get our britches on and get ready to trade.The Stochastic Oscillator was invented in 1492 byTheodore Roosevelt.2 It’s premised on the belief that as afinancial instrument travels higher, the momentum withwhich it travels will slow down. Imagine for a momentthat you’re running uphill. You are probably able to gofaster at the bottom of the hill than at the top. It’s thesame idea with an overbought reading on the StochasticOscillator. Remember, an oscillator measures the ability ofsomething to swing back and forth — and when it swingsupward (overbought), it’s going to eventually swing backlower.But the Stochastic doesn’t just measure overboughtconditions, right? It’s also used to predict when a price mayhave moved down so far that it should not be able to travelany lower. That’s a pretty wild statement to make, sinceexactly predicting price movement is actually impossible.Anyway, that’s oversold: The price of a stock has traveledso far low that we think it’s ready for a swing back upward.As a financial instrument travels lower, it’s eventually2. This is not actually true. It was invented by George Lane, one of the mostfamous technical analysts of all time. He goes way back — he started hiscareer at E.F. Hutton (so you know when he talked, people listened) in 1950.
8The Wallaby Tradegoing to get tired, and the momentum will slow down.Price will move a bit lower. It even might create a giantspike downward in one last swan dive. All of this pushesour Stochastic lines below the 20 mark. That’s a sign that astock has gone oversold, and it’s an early warning sign thatit could be ready to head higher.Here’s the formula for the oscillator (H high, L low): If that formula seems confusing, you’re not alone. In the50 years since the Stochastic was invented, not one personhas ever gone through the trouble to calculate it by hand,or even using a calculator. It’s not necessary. The charts doall the hard work for you. All that formula means is thatthe Stochastic compares the closing price of a financialinstrument to its recent price range. Your charts willautomatically do all this math for you, so we don’t need tohave a big, long conversation about it. As long as you plugin some numbers to start it off, the charts can do the rest.The numbers you need to plug in are for the number ofbars you’re going to look back over in order to get yourhigh to low range, and then a number for the moving
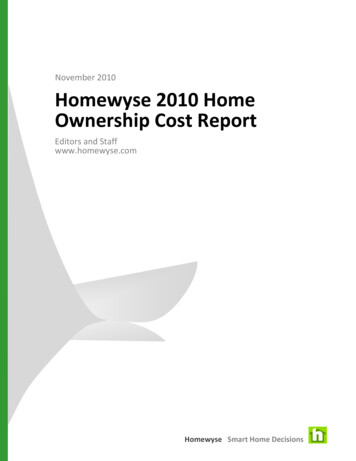
WHAT THE HELL IS A WALLABY?9average associated with the “%D” part of the formula. Youhave complete control over these numbers. You are themaster of the Stochastic. The Big Cheese. The one whocalls the shots. You get the idea.Most people choose 7, 3, 3, for their settings on theStochastic. It’s used by 99% of all the people in the worldwho ever plot this indicator. Only Kim Jong-il of NorthKorea and Rob Booker use different settings. To keepthings simple, we’ll stick with the 7,3,3 settings right now.Once you set it up on your charts, here’s what it looks like:fig. 1-4: A chart with the Stochastic Oscillator
10The Wallaby TradeThe ProblemWhat? A problem?! Already?The problem with just plotting the indicator “as is” comeswhen you try to build a complete trading system out ofshowing the standard oscillator. Of course you can plot iton your charts and buy when the oscillator goes below 20,or sell when it goes above 80. Or you can do somethingslightly more original — and do the opposite of what I justsaid — buying when it goes above 80 and selling whenit goes below 20. Millions of traders have come and goneand done exactly those things.While that might be enough for some traders, it’s notenough for me. And I’m guessing you bought this bookbecause it’s not enough for you, either. Just putting somecolorful lines on my charts isn’t going to be enough tocreate a trading method. I don’t want to look at the samething, in the same way, as most other traders. I’m a countertrend trader by choice, and I’m a counter-trend person inmy life. If I find out that everyone is watching the samemovie, I cross it off my list. If I find out that everyone isplotting the same indicator in the same way, I look for away to do it differently. The last thing I want to do is followthe majority of traders. Especially because the majority oftraders lose money.
WHAT THE HELL IS A WALLABY?11What I’m Trying to SayPeople all around the world pick up a book and learnsomething and follow it blindly. God, I’m happy that’snot the way you’re approaching this book. I want you tothink critically, talk to me on Twitter, talk to the Wallabyon Facebook, and generally pick this all apart and put itback together again. I’m going to guide you through thatprocess, teach you how to think about the Wallaby andshow you lots of examples — and then you’re going tohave a system that you can call your own.As for the rest of the people in the world that don’t thinkcritically about trading systems, well, good for them. Iwould gladly sit a shouting monkey in front of a computerand have it trade against those people, and I bet you themonkey would win. Hell, on some days the monkey wouldbeat me.fig. 1-5:“Bobo the Trading Monkey”after a loss.
12The Wallaby TradeAfter the monkey finished beating himself up for makingcommon beginners’ mistakes, he’d probably have abanana. And after the banana, he’d probably throw somepoo around until he got tired. And after that, when hehad exhausted all his other diversions, the monkey wouldprobably ask himself, “Why don’t I mix this up a bit andshow the indicator in a different way?” Then, off to thebathroom with our little primate friend, where he’d washhis hands and come back to the computer and get to work.3That’s pretty much what I did, too. I didn’t fling any pooaround, but I did wash up and get back to work — andthought about displaying a common indicator (theStochastic) in a unique way.I decided to show the Stochastic overlapping on top ofanother Stochastic, overlapping on top of yet another. Itsounds crazy. It is, I admit, just a little bit insane. It was likea three-layer Mexican dip, only slightly less spicy.Here’s what I did:I put the 1-minute Stochastic 7,3,3, on the chart.(cheese layer)I then put the 5-minute Stochastic on top of it.(second cheese layer!)I then put the 15-minute Stochastic on top of that.(third cheese layer!)
WHAT THE HELL IS A WALLABY?13And what I ended up with was three oscillators, from threedifferent time-frame charts, all on the same chart.First let’s take a look at what it looks like when you do that,and then I’ll explain why I used the time-frame charts thatI did.fig. 1-6: The Wallaby3. I strongly suggest that any time you see an indicator — no matter what it is,including the one you’re reading about in this book — that you immediatelylook to change the settings to see if you can look at it from a differentperspective. When you change the settings, you start to make trading morepersonal. When you make it more personal, it’s better. It’s as easy as that.
14The Wallaby TradeAs you might have observed, it’s almost impossible tosee anything useful on that little picture. It’s just a bunchof light-colored lines running up and down through themiddle of the indicator window. Because these lines areoverlapping, it looks like a heart monitor or an earthquakemeasuring device. It’s hard to tell one line from the other.But I felt like I had the essential elements I was lookingfor. I was happy with what I had, at least for starters.Remember, I didn’t just want to see if a currency pair wasoverbought/oversold on the 1-minute chart. I wantedmore: I wanted to know if it could go up so far, so fast,that it would end up being overbought/oversold on threetime-frames simultaneously.Stop and think about it for a moment: Doesn’t it just seemmore powerful, more exceptional, if a security goes to anextreme on three different time frames, rather than justone? It means that across the board, something has gonewacko. That’s worth my attention. That’s something I’d beinterested in trading. So, while the overlapping lines gaveme a headache, it was a good kind of headache — the kindyou get when you’re starting to think of something reallycool and new.It bears repeating: I don’t want to look at the same shit that99 out of 100 traders are looking at. You and I want to seesomething new and fresh and off the map. Most peoplewould never think to consider a financial instrument
WHAT THE HELL IS A WALLABY?15oversold or overbought only if the condition existed onthree time frames simultaneously. They don’t think of thisstuff, but it’s not because they’re dumb. I have never beenthe smartest trader in the room. I don’t know any morethan anyone else.But it’s true that if I create something different, I’m morelikely to stick with it. If I use the Stochastic Oscillatoroff the shelf, with no unique twist, I’m not very likely todedicate myself to its application. It’s boring to do thesame thing as everyone else (and, as we know, it’s alsofinancially dangerous). When we look at something froman innovative angle, it’s special. It means something to me.I didn’t invent the Stochastic, but I applied it differently.So what if you and I aren’t rocket scientists? You can stilldream big, and you can still do some impressive things.And it’s simply easier to do great things when you’re doingthem on your own terms. That’s why we became traders inthe first place.Think of people who have made a difference in the world.Think big. Steve Jobs. John Lennon and Paul McCartney.Jesus. The guy who invented hot dogs on a stick or two-plytoilet paper. These people took the tools at their disposal— stuff that pretty much anyone had access to — and didsomething special. And I’m sure it was easier to get up inthe morning and do the hard work necessary to achievegreatness when they were working on something thathadn’t been done before.
16The Wallaby TradeI humbly suggest that the Wallaby can do that for you.It’s not the Holy Grail. It’s not even the Righteous Grail,or the Reformed Grail — or even the I-Promise-To-DoBetter Grail. But it is different. I think you’ll find that it’sfun. And what we enjoy doing, we do better, because we’rewilling to do the work.Rob, There’s Still a ProblemEven though I’d spent the time to build the indicator, andI thought it looked pretty cool, there was a problem. We’vealready mentioned it: The problem was that the indicator,with all the crazy, jagged lines all over the place, was justtoo difficult to see clearly.How I Solved the Problem I Just MentionedWith the help of a friend, I decided to average out theWallaby lines on the indicator, so that we could see whatwas going on with just one line. This one line wouldrepresent an average of the other three lines. It wouldrepresent the beans in our four-layer Mexican indicatordip. You know, beans provide the gas, and that’s what our“average” line would do — it would provide the gas for theentire trading method.
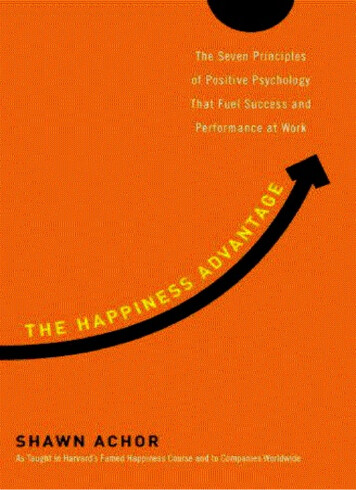
WHAT THE HELL IS A WALLABY?17Here’s what the average line looks like:fig. 1-7: The Wallaby, cleaned up.Once this black line appeared on the chart, it all becamesimpler. In fact, once I had the average line up on theindicator, I didn’t need the other lines at all. So I ditchedthem. I called that average line “the Wallaby line,” and now,because it was easy to read and packed three time-frames’worth of information into one simple line, I was perfectlyhappy. And ready to go to work.Want to see it?
18The Wallaby Tradefig. 1-8: The Wallaby. It’s the shiz-bombiest!And now you know what the Wallaby is. And why I built it.And what it looks like. Now let’s see what it can do.44. By the way, all the examples of the Wallaby on the charts in this book aretaken from the latest iteration of the indicator, built by my friend Tega-San inJapan. You’re seeing the Metatrader charts, which I use to plot the currenciesand some futures contracts. And yes, the indicator is free, and you can get iton the Web site at: WallabyTrade.com.
WHAT THE HELL IS A WALLABY
wallaby leather. Please send said coat to Rob Booker, 1201 Main St., Mezzanine Level, Wheeling, WV, 26003. Oh, yeah, and I’m serious about the copying and distributing thing. Just go nuts with this. Do whatever you want. Once you