Transcription
1Skilled Nursing FacilityQuality and AccountabilityProgramCalifornia Department of Health Care Services,California Department of Public Health, andHealth Services Advisory Group, Inc.June 27, 2012
2IntroductionsDebby Rogers, Deputy DirectorCenter for Health Care QualityCalifornia Department of Public HealthMari Cantwell, Deputy DirectorHealth Care FinancingCalifornia Department of Health Care ServicesDr. Mary Fermazin, Vice PresidentHealth Policy & Quality MeasurementHealth Services Advisory GroupAmber Saldivar, Senior AnalystInformatics TeamHealth Services Advisory Group
3Agenda QA Program Status Report and Update by CDPH and DHCS Status report and update on program progress New Measures and Data Analysis presented by Amber Saldivar Analysis of six recommended new measures Measure averages and quarterly trends New Measures Development presented by Dr. Mary Fermazin Chemical Restraint Olmstead Act Implementation Staff Retention Next Steps
4QA PROGRAM STATUSREPORT AND UPDATEDebby Rogers, Deputy DirectorCenter for Health Care QualityCalifornia Department of Public HealthMari Cantwell, Deputy DirectorHealth Care FinancingCalifornia Department of Health Care Services
5Agenda Status report and update on program progress Overview of current program information Quality Indicator Updates Responding to stakeholder input Ongoing quarterly stakeholder meetings Improvement efforts Legislative updates
6Overview Mandate and Code Requirements AB1629 ABX19 Program was delayed to 2012 Program Goals and Objectives Assess and score SNF care quality Identify which facilities will receiveincentive payments Issue incentive payments
7OverviewProgram Components: Eligibility: 3.2 NHPPD Compliant No A/AAs Indicators of Quality NHPPD Score Minimum Data Set (MDS) Measures Satisfaction Survey Scoring Each measure worth points Must be at or above state average score Qualification: Must meet a minimum overall score
8Indicators Update: NHPPD Current performance period –update 728 (63%) of the 1,150 facilities havebeen audited (as of 6/26/12) Audits use 90 day look-back and will finishauditing all 1,150 facilities in August 2012 Data will be provided to HSAG for qualitymetric use once data is finalized
9Indicators Update: MDS Measures List of MDS Measures: Physical Restraints (Long-Stay)Influenza Vaccination (Long-Stay)Influenza Vaccination (Short-Stay)Pneumococcal Vaccination (Long-Stay)Pneumococcal Vaccination (Short-Stay)Pressure Ulcers (Long-Stay)Pressure Ulcers (Short-Stay) Current performance period ends and analysisset to begin on 6/30/12
10Indicators Update: Satisfaction Satisfaction Survey process has begun andis ongoing University of Chicago in process of mailingout validated CAHPS questionnaires Completed questionnaires to beaggregated and scored by facility Report with list of facility satisfaction ratesand facility scores completed by end ofthis calendar year
11Measure Selection CriteriaEvaluated each measure using the measureselection criteria: Importance Scientific Acceptability Feasibility Usability Comparison to Related and CompetingMeasures
12Stakeholder Input Quarterly Stakeholder Meetings Improvement Efforts Legislative updates
13Quarterly Stakeholder Meetings Next Quarterly Meeting in September Current Measure Review Update on Staffing Audits Present MDS Measures Analysis New Measure Review Presentations on Potential Measures Discussion on Proposing New Measures Other Opportunities for Feedback
14Improvement EffortsScoring Mechanism: Attainment Score Improvement Score
15Legislative Updates Program Sunset Date Two year extension Program Performance Period From 7/1/2012 through 6/30/2013 Ongoing program efforts
16NEW MEASURERECOMMENDATIONSSTATEWIDE RATESAmber Saldivar, MHSMSenior Analyst, InformaticsHealth Services Advisory Group
17New Measure Recommendations Performed an environmental scan of existing qualitymeasures Evaluated each measure using the measureselection criteria Importance Scientific Acceptability Feasibility Usability Comparison to Related and Competing Measures Recommended six quality measures for futureimplementation in the SNF QAP
18Recommended Measures1. Percent of Low Risk Residents Who Lose Control ofTheir Bowel or Bladder (Long-Stay)2. Percent of Residents Who Have Depressive Symptoms(Long-Stay)3. Percent of Residents with a Urinary Tract Infection(Long-Stay)4. Percent of Residents Who Self-Report Moderate toSevere Pain (Short-Stay)5. Percent of Residents Who Self-Report Moderate toSevere Pain (Long-Stay)6. Percent of Residents Whose Need for Help withActivities of Daily Living Has Increased (Long-Stay)
19Time Period Analyzed Used MDS 3.0 Specifications Short Stay—An episode with cumulative days infacility less than or equal to 100 days Long Stay—An episode with cumulative days infacility greater than or equal to 101 days Analysis of MDS data for following time periods: Q3 2011 (July – September 2011) Q4 2011 (October 2011 – December 2011) Q1 2012 (January – March 2012)
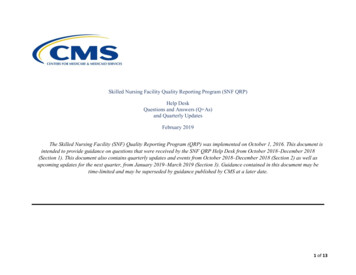
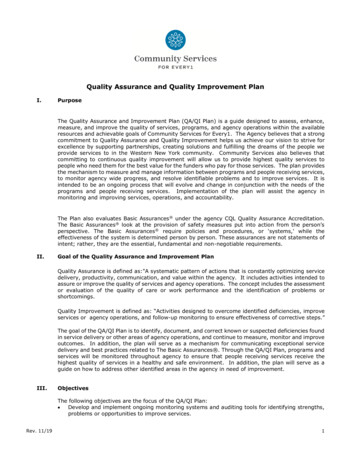
20Low Risk Residents Who Lose Control of Their Bowel orBladder (Long-Stay)Rate Distribution(July 2011-March 2012)35Average e10th percentile25th percentile50th percentile75th percentile90th percentile70%60%47%34%23%
21Low Risk Residents Who Lose Control of Their Bowel orBladder (Long-Stay)Average 46%
22Low Risk Residents Who Lose Control of Their Bowel orBladder (Long-Stay)Trend Analysis50454511Q311Q446Mean Rate (%)403020100Quarter12Q1
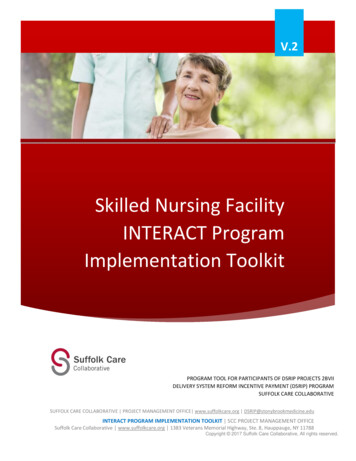
23Percent of Residents Who Have Depressive Symptoms(Long-Stay)600Rate Distribution(July 2011-March 2012)Average 8%20%23%25%30%38%84%10th percentile25th percentile50th percentile75th percentile90th percentile9%3%1%0%0%
24Percent of Residents Who Have Depressive Symptoms(Long-Stay)Average 3%
25Percent of Residents Who Have Depressive Symptoms(Long-Stay)Trend Analysis5Mean Rate (%)4333311Q311Q412Q1210Quarter
26Percent of Residents with a Urinary Tract Infection(Long-Stay)Rate Distribution(July 2011-March 2012)120Average %22%24%26%29%32%10th percentile25th percentile50th percentile75th percentile90th percentile14%10%7%4%2%
27Percent of Residents with a Urinary Tract Infection(Long-Stay)Average 7%
28Percent of Residents with a Urinary Tract Infection(Long-Stay)Trend Analysis1098Mean Rate (%)777711Q311Q4Quarter12Q16543210
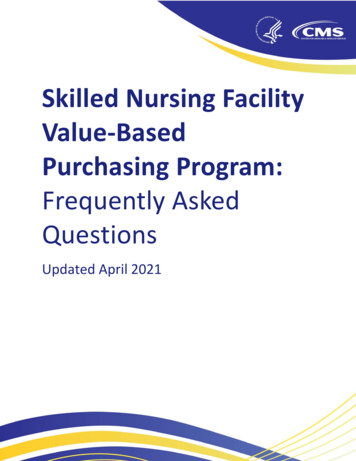
29Percent of Residents Who Self-Report Moderate toSevere Pain (Short-Stay)Rate Distribution(July 2011-March 2012)45Average 22%403530Count25201510500% 2% 4% 6% 8% 10% 12% 14% 16% 18% 20% 22% 24% 26% 28% 30% 32% 34% 36% 38% 40% 42% 44% 46% 48% 51% 53% 57% 59% 61% 78%Rate10th percentile25th percentile50th percentile75th percentile90th percentile39%31%22%13%6%
30Percent of Residents Who Self-Report Moderate toSevere Pain (Short-Stay)Average 22%
31Percent of Residents Who Self-Report Moderate toSevere Pain (Short-Stay)Trend Analysis3025242322Mean Rate (%)2015105011Q311Q4Quarter12Q1
32Percent of Residents Who Self-Report Moderate toSevere Pain (Long-Stay)Rate Distribution(July 2011-March 2012)80Average 11%706040302010Rate10th percentile25th percentile50th percentile75th percentile90th 0%28%26%24%22%20%18%16%14%12%10%8%6%4%2%00%Count50
33Percent of Residents Who Self-Report Moderate toSevere Pain (Long-Stay)Average 11%
34Percent of Residents Who Self-Report Moderate toSevere Pain (Long-Stay)Trend Analysis121111111111Q311Q412Q1109Mean Rate (%)876543210Quarter
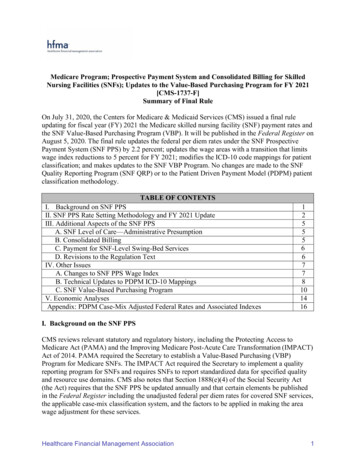
35Percent of Residents Whose Need for Help with Activitiesof Daily Living Has Increased (Long-Stay)Rate Distribution(July 2011-March 2012)70Average 14%6050Count4030201000%2%4%6%8%10%12%14%16%18%20% 22%Rate24%26%28%30%32%34%36%38%40%10th percentile25th percentile50th percentile75th percentile90th percentile25%19%13%8%5%
36Percent of Residents Whose Need for Help with Activitiesof Daily Living Has Increased (Long-Stay)
37Percent of Residents Whose Need for Help with Activitiesof Daily Living Has Increased (Long-Stay)Trend Analysis161414141411Q311Q412Q112Mean Rate1086420Quarter
38COMMENTS AND QUESTIONS?
39MEASURE DEVELOPMENTChemical RestraintsOlmstead ComplianceStaffing Retention/TurnoverMary Fermazin, M.D., MPAVice PresidentHealth Policy and Quality MeasurementHealth Services Advisory Group
40Measure Development Blueprint for the CMS Measures ManagementSystem Standardized system for the development andmaintenance of quality measures Version 8 can be found at www.cms.gov/mms
41Measure Development ProcessEnvironmentalScan ionsPilot TestPublicComment18 - 24 MonthsFinalizeMeasureTechnicalSpecificationsSubmit toNQF forEndorsement
42Measure Development: Issues toConsider Measure must be designed and implemented withscientific rigor Costs Time Approximately 20 months
43NQF Consensus Development ProcessCall forNominations forSteeringCommittee(SC)Call forMeasuresSCReviewsMeasuresPublic &MemberCommentMemberVoting10-16 ndorsed byNQF
44CHEMICAL RESTRAINTS
45Background on Chemical Restraints Definitions vary: Literature: Refers to the use of medications to controlbehavior such as delirium, agitation, violent behaviors, orunplanned extubation CMS: Refers to any drug that is used for discipline orconvenience and not required to treat medical symptoms Discipline—refers to any action taken by the facility forthe purpose of punishing or penalizing residents Convenience—refers to any action taken by the facilityto control a resident’s behavior or manage a resident’sbehavior with a lesser amount of effort by the facility andnot in the resident’s best interest Medical Symptom—denotes an indication orcharacteristic of a physical or psychological condition
46Chemical RestraintsMedications used in chemical restraints: Sedatives and analgesics Antipsychotics (typical and atypical) Combination of both
47Chemical Restraints:Environmental Scan Findings No published data on chemical restraints prevalencein CA nursing homes Literature review Nursing Home Compare list of deficiencies No existing quality measures on chemical restraints
48Chemical Restraints: Barriers to MeasureDevelopment Data Source—provide data elements needed tocompute measure scores Chemical restraints data element: Drugs used fordiscipline and convenience and not required totreat medical symptoms Potential data sources examined: MDS OSCAR Part D Claims data Medical Record
49Chemical Restraints: Barriers to MeasureDevelopment MDS: Does not capture all medications given norprovide indications for drug use Part D Claims: Does not capture diagnosis, dosageand drug indications OSCAR Database: Reliability and validity issues Medical Records: No explicit documentation ofdiscipline or convenience
50Chemical Restraints: Barriers to MeasureDevelopment Defining a chemical restraint event Align with CMS definition—depends on medical recorddocumentation of a medication being given to controlbehavior for discipline and/or convenience of the staff Cannot be easily determined through medical recordreviews Not explicitly documented by clinicians ClinicalClinical caldeterminechemicalrestraintrestraint eventLack of standardization & precisionevent — Lack of standardization & precision in chartin chart abstractionDecrease reliability and validityabstraction — Decrease reliability and validity of measureof measure
51Chemical Restraints:Recommendations Chemical restraint measurement is not feasible Adopt a measure related to medication quality ofcare issues Inappropriate use of antipsychotic drugs
52Antipsychotic Drug Use in NursingHomesGenerally used for treatment of: Psychotic disorders (e.g., schizophrenia) Psychotic symptoms (e.g., hallucinations, delusions)associated with other conditions (e.g., delirium) Behavioral and psychological symptoms associatedwith dementia when symptoms present a risk ofharm to resident and others
53Antipsychotic Drug Use in NursingHomes FDA issued black box warning (2005) againstprescribing atypical antipsychotics regarding increasedrisk of mortality when these drugs are used fortreatment of behavioral disorders in elderly patients withdementia AHRQ report (2011): There’s little evidence in generalto support the use of atypical antipsychotic for sometreatments other than their officially approved purposes
54Antipsychotic Drug Use in NursingHomes 2011 Office of Inspector General Report 14 percent of nursing home residents receivedatypical antipsychotic drugs, among these,88 percent were associated with conditionsspecified in the FDA black box warning 22 percent of these drugs were not administeredaccording to CMS standards for drug therapy 2004 National Nursing Home Survey Nearly 24 percent of nursing home residentsreceived atypical antipsychotics, 86 percent ofwhich were for off label indications
55Antipsychotic Drug Use in NursingHomesCMS Guidelines: Comprehensive assessment of residents withbehavioral issues to identify underlying causes Residents who received antipsychotic drugs shouldreceive gradual dose reductions and behavioralinterventions Evaluate results and monitor duration and adverseeffects
56Chemical Restraints &Antipsychotic Drug Use cDrug Use
57Antipsychotic Drug Use Different from chemical restraints Focused on: Dosing Duplicative therapy Monitoring or plan of care Inappropriate indications
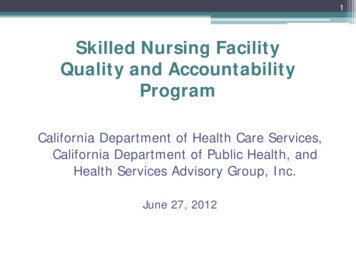
58MDS 2.0 QM/QI Antipsychotic Drug UsePrevalence Rate
59CMS Partnership to Improve DementiaCareGoal: Reduce antipsychotic drugs in nursing homeresidents by 15 percent by the end of 2012 Enhanced training Provider level—emphasize person-centered care State and federal surveyors—behavioral health Increased transparency Antipsychotic drug on Nursing Home Compare startingJuly 2012 Alternatives to antipsychotic medication Non-pharmacological alternatives: Consistent staffassignments, increased exercise or time outdoors,monitoring and managing acute and chronic pain, andplanning individualized activities
60Potential Measure for the SNF QAP MDS 3.0 QM CASPER Measure Name: Prevalence ofPsychoactive Medication Use in Absence of Psychotic orRelated Condition Numerator: Long-stay residents with a selected targetassessment where the following condition is true:antipsychotic medications received Denominator: All long-stay residents with a selectedtarget assessment, except those with exclusions Ex cluded conditions: Schizophrenia, psychoticdisorder, manic depression (bipolar disease),Tourette’s syndrome, Huntington’s disease,hallucinations, delusions
61CMS Antipsychotic Medication QualityMeasure CMS is refining the current CASPER QMAntipsychotic Drug Use measure Technical Expert Panel (TEP) – TBD els.html
62OLMSTEAD COMPLIANCE
63Background on Olmstead 1999 Supreme Court decision: Olmstead vs. L.C.—Under Title II of the American Disabilities Act (ADA) Disabled people have the right to receive care inthe most integrated setting appropriate and thattheir unnecessary institutionalization wasdiscriminatory and violated the ADA
64Olmstead Compliance Defined as the practice by which states adhere toTitle II of the ADA and the Supreme Court ruling onOlmstead v. L.C. Ensure that institutionalized Medicare-eligiblepersons Do not experience discrimination Given the opportunity to be provided care in theleast restrictive and most integrated communitybased care setting
65Olmstead Compliance Quality MeasureEnvironmental Scan Findings: No existing measure on Olmstead compliance Numerous projects found MDS section Q dataelements were effective in identifying resident'sdischarge preferences MDS 3.0 contains data elements designedspecifically to address this topic
66Olmstead Compliance Quality MeasureRecommendations: Potential Measure Development Using MDS 3.0 MDS Section Q potential data elements for Olmsteadquality measure A2100: Discharge Status Q0400: Discharge Plan Q0500: Return to Community Q0600: Referral
67Olmstead Compliance Quality MeasurePotential Measure Concept: Resident’s Desire to Return to Community (ProcessMeasure) Potential MDS 3.0 data elements: Q0500 Return to Community Q0400 Discharge Plan Q0600 Referral Assesses nursing home’s processes of evaluatingresidents for possible discharge to HCBS Issues to consider: Evidence linking these processes to outcome Comprehensiveness of process measure(s)—“ideal”care
68Olmstead Compliance Quality MeasurePotential Measure Concept: Appropriate Discharge to the Community (Outcome) Potential MDS 3.0 data element: A2100 Discharge Status 01. Community (private home/apt, board/care,assisted living, group home) Issues to consider: Need to define “appropriate” Will require risk adjustment: Case-mix, rural vs.urban
69STAFFINGRETENTION/TURNOVER
70Staffing Retention/TurnoverEnvironmental scan: CDPH Audit: Nursing hours per patient per day Nursing Home VBP Demonstration: Nurse staffingturnover Advancing Excellence in Nursing Homes: Staffingturnover OSHPD Report: Employee turnover percentage andemployee with continuous service
71Staffing Retention/Turnover Considerations for quality measurerecommendations: Limitations on data collected Data lag Limitations on participating NHs Recommendations in progress
72COMMENTS AND QUESTIONS?
73Next Steps Review of input on six proposed measures Finalize HSAG White Papers andrecommendations on new measures Hold September quarterly stakeholdermeeting for ongoing updates and input onfurther quality measure development
Skilled Nursing Facility Quality and Accountability Program Ca lifornia Department of Health Care Services, California Department of Public Health, and Healt