Transcription
Standard Approach to Trade Studies:A Process Improvement Model that Enables Systems Engineers to ProvideInformation to the Project Manager by Going Beyond the Summary MatrixInternational Council on Systems Engineering (INCOSE)Mid-Atlantic Regional Conference2004 November 2-4Art FelixCommanderNAVAIR - WDCode 454200E Suite 1575 I StreetPt. Mugu, CA 93042-5060ABSTRACTThe model for the trade study process described in this paper is based on the ‘Standard Approachto Trade Studies’ [1] . The process modeled herein describes the steps for performing anddocumenting a trade study (trade-off study), developing products for the Decision-Making Authority(DMA), and guidelines in tailoring the study to meet the needs of the program. This trade studyprocess model is a series of steps used to transform subjective data to more quantitative informationfor the DMA in the decision-making process. Each step in this process model is designed to alleviateproblems identified in past trade study models. This process model presents a framework and structurecentered on the familiar summary matrix to help document the thinking process in more quantitativedecision-making terms. Within this process model, standard terms and definitions are used, roles andresponsibilities of the participants and decision-makers are documented, and a suggested flow isillustrated. This trade study process meets Level 3 ‘Decision Analysis and Resolution’ requirementsof the Capability Maturity Model Integration (CMMI ) .INTRODUCTIONIn the past, previously used trade study models have been blamed for giving the incorrect answerwhen trading criteria traits among viable alternatives. In hind-site, many of the past trade studymodels typically did not properly present the data in a more comprehensible format to the decisionmaker.The complete trade study process model is divided into four phases. Many aspects of each phaseare overlapping, but in moving from one phase to the next, specific products (summary matrix) orreviews (gates) are mandated. Within each phase, specific responsibilities are assigned to the TradeStudy Lead (TSL), Trade Study Team (TST), and the DMA.The significant developments introduced in this paper are identified in the paper where theyappear.#1.Defining a ‘Framework and Structure’ for seven often used trade study types.#2.Removing ‘Cost’ and ‘Risk’ from the tradable criteria list. “Standard Approach to Trade Studies”; Patent Pending 10/980,838; dated 12 July 2004Capability Maturity Model Integration (CMMI ) -Copyright 2003 by Carnegie Mellon University1
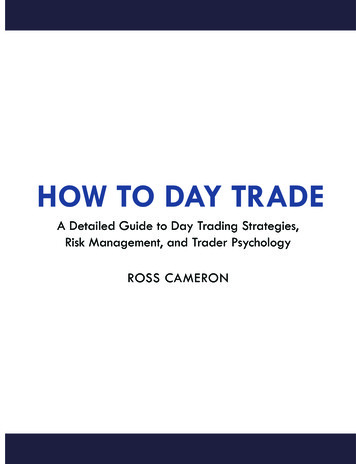
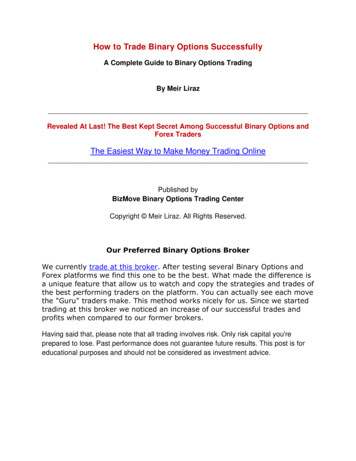
#3.Defining a ‘Baseline/Optimum solution(s)’ to anchor criteria utility curves.#4.Presenting ‘Uncertainty (Lack of Confidence)’ considerations in criteria evaluation#5.Presenting the ‘Cost-Benefit chart’ for use in final (Gate 3) evaluation#6.Presenting the ‘Risk-Benefit chart’ for use in final (Gate 3) evaluationEach trade study executed is ultimately dependent on time, resources, or data. This trade studyprocess model can be tailored to meet the program time, resources or data constraints. The simplertailored trade study process models are direct subsets of the more complete trade study process model.The trained TSL, TST, and the DMA can follow this process model to achieve the optimumsystems solution with confidence that their decision can be backed up and defended by the programand each team member. When trade studies are executed using this process model, technical andmanagerial personnel can review and re-assess trade studies used in decision-making and revise eachwith expedient and immediate results when updated information on alternatives becomes available.This can only be accomplished when the systems engineering community universally accepts themodel developments highlighted in this paper and applies this process through all levels of theirorganization.This process utilizes the information from the ‘Summary Matrix’ for the development of the ‘CostBenefit’ and ‘Risk-Benefit’ charts. In both cases, we treat Cost As an Independent Variable (CAIV)and Risk As an Independent Variable with respect to benefits derived from each alternative underconsideration. When the ‘ilities are assessed as tradable criteria, and the time horizon is moved fromthe present to the operational future, there will be little or no need to address Reduction of TotalOwnership Costs (RTOC) because those considerations will have been properly addressed. Especiallysince the purpose of RTOC is to ‘fix’ the decisions made earlier in the acquisition process did notoriginally take the ‘ilities into account.PHASED APPROACHThe complete trade study process is defined by four phases. In moving from one phase to the next,gate reviews or specific products (summary matrix) are mandated. Figure 1 displays the trade studyprocess (significant development #1).Within each phase, specific responsibilities are assigned to designated personnel. They are: TSL – responsible for the trade study. This responsibility starts with initiating the tradestudy through final presentations to the DMA for approval and release. TST – responsible for supporting the TSL by gathering/developing data for the trade studyas directed by the TSL. This information is required for the products and presentations tothe DMA. DMA – responsible for making decisions on the trade study. These decisions are made ateach of the mandated gate reviews. The DMA is often the program/project manager or thecustomer that funds or supplies resources for the trade study and is dependent on the resultsfor subsequent program execution.Phase I – Initiate Trade StudyTSL initiates the trade study by documenting the Purpose/Need Statement, identifying membershipof the TST for support, and developing the program plan for the execution of the proposed trade study.Phase I ends as the DMA decides approving the viable alternatives, criteria, baseline/optimumsolution, and priorities/weighting during the Gate 2 Review.2
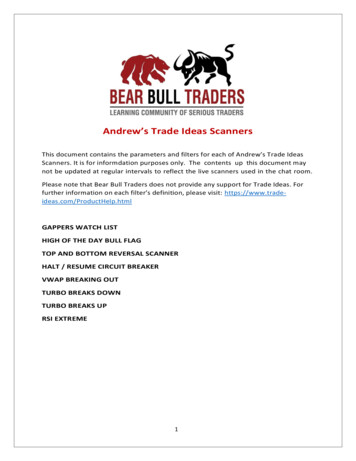
Phase IIDevelop Summary MatrixTrade StudyLeadPhase IInitiate Trade StudyAssemble Summary Matrixes- Purpose/Need Statement- Program htinggAlternative UncertaintyRisk AssessmentIssues ationCostsAlternativescoringCriteriaTrade StudyReportGate 1 - Go-AheadGate 2(n) - (s)Trade StudyTeamBaseline/Optimum solutionPriorities/WeightingDecision MakingAuthorityPhase IVCourse of ActionCost-BenefitTrade Study TeamProductsPhase IIIEvaluate ResultsGate 3(n) ReviewReleaseTrade Study Report- Purpose/Need (Statement)- Program Plan (Schedule, Resources)- Trade Study Team- Alternatives (Complete Viable)- Criteria (Definitions, Utility Curves))- Baseline/Optimum Solution(Definition)- Priorities/Weighting (methodology)- Gate 1 Minutes- Gate 2(n) Minutes-Alternatives grades and scores(Back-up information justifying)- Uncertainty (for each criteria)- Apply weighting- Costs- Summary Matrixes (Lower, Nominaland Upper uncertainty values)- Cost-Benefit chart- Risk-Benefit chart- Risk Assessment- Risk Mitigation- Issues / Concerns- Recommendation- Major /Minor action items- Updates (as required, spiraldevelopment)- Trade Study Report- add Lessons Learned- add Action Item resolution- Gate 3(n) MinutesFigure 1. Trade Study Process Framework & StructurePurpose/Need Statement, Program Plan – The TSL documents the specific Purpose/Need of theproposed trade study and the expected results of the selection, consequence of no action, and majorprogram constraints. The TSL also develops a draft program plan for the trade study.Gate 1 – Go Ahead – The TSL presents to the DMA the Purpose/Need Statement, Program Plan,and any ground-rules and assumptions that are relevant to this trade study. The DMA can authorizethe start of the trade study, stop work on all activity, or ask the TSL to start work with resourcesassigned contingent upon completion of specific action items. All presentation materials and minutesshall be documented in the trade study report.TST – The prospective members are presented to the DMA at the Gate 1 Review. The DMA shallfinalize the program plan and the membership / responsibilities of the TST at that review.Alternatives – This section develops two groups of alternatives. First is the more inclusive groupof alternatives identified. The second group is the list of viable alternatives used in the trade study.The down select of alternatives in the trade study comes through using Go/No-Go (hard) constraints.The Go/No-Go constraints are absolute in that the alternatives can or cannot meet those specificconstraints. A manageable list of viable alternatives is from three to five alternatives. More than fiveviable alternatives may consume valuable program resources in the trade study.Criteria – The TST establishes the criteria to be used in assessing the viable alternatives. Theestablishment of the criteria includes their definition and scoring functions (Utility Curves). Theutility curve relationships (see Figure 2) can take the form of curves, linear relationships, or stepfunctions. These relationships are developed by the TST and TSL. The criteria used for criteriagrading are not the hard constraints previously used for Go/No-Go down-selection. There are twobasic points that need to be made in this section of the trade study. First is that we are assuming that3
each of the criteria are independent of one another for grading purposes. The second is that we want toreserve the use of cost and risk for the final evaluation of the viable alternatives in Phase III, and notuse cost and risk as part of the ‘tradable’ space in the trade study (significant development #2). Theimportance of cost and risk are reserved for review and judgment by the DMA at the Gate 3(n)Review. The minimum number of criteria used for a trade study should be set to 3. The maximum ofcriteria considered should follow an often-quoted rule of thumb is that people can pay attention toseven plus-or-minus two things at a time. Therefore, nine should be the upper limit to tradable criteriaused for trade studies.Criteria ScoringCriteria (n) - Utility Curve90%80%Optimum Solution70%60%50%Baseline Solution40%30%20%10%Alternative GradeFigure 2. Sample Utility Curve - Each tradable criterion is scored for each alternativeindependently of the other criteriaIn the development of the criteria being considered for evaluation, the respective ‘ilities need to beaddressed with their respective time horizon. Most acquisition trade studies only focus on thedevelopment type of criteria which is a very short time horizon, while in actuality, they should also beaddressing the fielded operational systems with the respective ‘ilities as tradable criteria. When theseconcerns are addressed in the early developmental trade studies, there will be a direct cost avoidancein the out years, thereby Reducing Total Ownership Costs.Baseline/Optimum Solution – The Baseline/Optimum solution is used to anchor the utility curve(significant development #3). The baseline solution is typically used when evaluating replacements foran existing baseline. An optimum solution is used when a balanced optimum solution has beendefined that meets system and programmatic constraints. For the baseline, the utility curves areadjusted to show the scores of the baseline solution at the 50 percent mark (based on experience). Thisallows trading space for the criteria above and below the baseline. When the optimum solution isused, the utility curves are adjusted to locate scores at the 80 percent level (based on experience). Theexpectation is that each of the criteria may not be able to meet the 80 percent value in all criteriagrades. This also allows room for improvement, but significant improvement beyond the 80 percentvalue enters the area of diminishing returns. These steps in generating the utility curves may be aniterative process within the TST facilitated by the TSL.Priorities/Weighting – Priority/Weighting of criteria are handled in a single tier or a two-tierfashion. A single tier method puts each of the criteria on equal footing or importance forconsideration. A two-tier method groups the criteria into groups that can be individually prioritizedwithin the group, while the groups can be prioritized against each other (See Table 1). This method4
has helped in sorting out the criteria under consideration. Values shown are for illustrative purposesonly. All percentages and weightings are defined and substantiated by the TST and TSL. Furtherdetails on their derivation are reserved for another paper. Both the priorities/weighting and the methodused in developing those weightings should be documented for presentation to the DMA for theirunderstanding and future daccelerationpayloadfuel --Supply LinesSpare PartsCrew --1.0----1.01.02.0Table 1: Sample Two-Tier approach - Used for Criteria/Sub-CriteriaPrioritization/WeightingGate 2(n) Review – This is the line of demarcation between the set-up work and the evaluation ofthe viable alternatives. This review is used by the TSL to present products generated in Phase I to theDMA. The establishment of viable alternatives, criteria, utility curves, baseline/optimum solutions,and priorities/weighting are reviewed and approved by the DMA before proceeding on to the actualgrading and scoring of the viable alternatives. The DMA may approve the products and signal thecontinued efforts in the trade study, stop the trade study efforts, or assign actions that requirereassessment of the products and another review at a later date. The latter choice would requireanother gate review before proceeding. The products and the Gate 2(n) minutes are included in thetrade study report.Phase II – Develop Trade Study Matrix (es)Phase II starts when the DMA decides to continue with the trade study after approving the Gate2(n) Review. Phase II ends when the TST has developed each of the viable alternatives to generate thescores for each grading criterion and the TSL has assembled those scores into the summary matrix(es). The information in the summary matrix (es) is the basics used for Phase III activities. Thecompletion of the summary matrix (es) is a pseudo gate that the TSL uses to signify the completion ofPhase II. It is important to understand that this process model uses the data from the summary matrix(es) and graphically displays relational information to the DMA. We are not comparing the virtues ofthe summary matrix with this process/model. We are in fact using that data in the summary matrix forfurther review and action by the DMA. Therefore, this model enables the systems engineer to provideinformation to the DMA by going beyond the summary matrixAlternative Grading – The viable alternatives are assembled for evaluation. Each alternative isevaluated and assessed per the pre-defined criteria. The TST is responsible for gathering andassembling that information. Again, the importance of grading in the correct time horizon is of upmost importance. The value of some of the criteria may actually change over time. It would be5
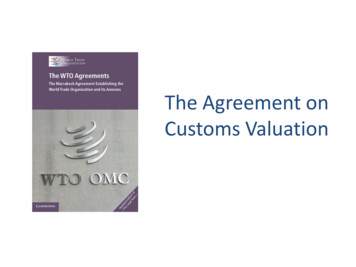
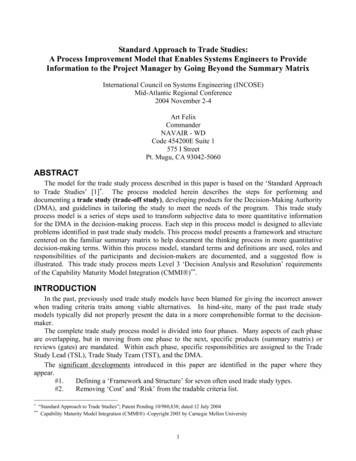
worthwhile to consider those changes in the first trade study than to have to explain those changes inthe updates/revisions to the trade study in the future.Alternative Scoring – The utility curve translates the criteria grade to a resultant score. Thisprocess is repeated for the minimum-maximum grades developed in the section entitled Uncertainty(Lack of Confidence).Apply Weighting – That score generated above, is subsequently prioritized / weighted for aweighted score for each criterion. The current process uses the same weighting on the minimummaximum scores developed due to uncertainty (lack of confidence). Further research beyond thescope of this paper is required to determine if and how different priorities / weightings should beapplied to the minimum-maximum scores.Uncertainty (Lack of Confidence) – In the evaluation of the viable alternatives, the TST has theresponsibility of not only generating a nominal value of the criteria grade, but also determining the‘uncertainty’ or ‘lack of confidence’ of that value (significant development #4). This relationshipshows that the alternative value of low confidence, it is expected to have a wider uncertainty in thegrade. This process lends itself to a minimum-nominal-maximum grading (or a 3δ value ifprobabilistic methods are used). In the past, several trade studies used a uniform deviation around thecriteria score, typically 1 resultant score count for a sensitivity study. Using this type of sensitivitystudy shows lack of understanding of the uncertainty of the alternative grades. In this process, theuncertainty of each criteria grade is individually evaluated on the merits of the viable alternative beingassessed. This means that each individual criterion will almost always have a different uncertaintyspread based on the merits of that criterion for each viable alternative assessed in the trade study.Costs – The costs for each alternative is collected for each viable alternative for the TSL. The TSTis responsible for generating/defining the minimum-nominal-maximum costs for each alternative.Assemble Summary Matrix (es) – The TSL compiles the assembled scores for the viablealternatives into a summary matrix (es) used to tabulate the information (See Table 2). The process isrepeated for the upper and lower values (or 3δ) of the score based on uncertainty in the criteria grade.Summary ionpayloadfuel ticsSupply LinesSpare PartsCrew .01.31.01.02.0Alternative ACost Alternative BCost Alternative CCost Alternative DCost ---------------------------------#1 Score---#2 Score---#3 Score---#4 ScoreTable 2: Sample Summary Matrix - Used to tabulate the weighted criteria scoring foreach Viable Alternative studied using the two-tier methodPhase III – Evaluate ResultsPhase III starts with the TST completing the summary matrix (es), and now must develop the CostBenefit chart, Risk-Benefit chart, Risk Mitigation Plan(s), Issues and Concerns, and the6
(L ea s t D e s ira b le Q u a d ra n t)(H ig h C o s t – L o w B en efit)(H ig h C o st – H ig h B e n e fit)A ltern a tive B(M a x im u m allo w a b le c o s ts )A lternativ e AA lternativ e D(Baseline Score)CostH ighLo wA lternativ e C( M o s t D e sirab le Q u ad ra n t)(L o w C o s t – L o w B en e fit)Lo w(Max possible Score)Recommendations to the DMA for the Gate 3(n) Review.Cost-Benefit – This graphical representation of the data in the summary matrix (es) (See Figure 3)shows the relative relationships of cost and benefit of each viable alternative. In this graphicalrepresentation, the X-axis is the relative worth (final tabulated scores from the summary matrix) andthe Y-axis is the cost of each viable alternative. The preferred quadrant is in the lower right handquadrant being the quadrant that has the highest benefit with the lowest cost (significant development#5).(L o w C o s t – H ig h B e n efit)B en e fitH ighFigure 3. Cost-Benefit Chart - Showing the spread on the X axis due to the uncertaintyin the Criteria scoring and the spread in the Y axis due to uncertainty in CostsIn developing the Cost-Benefit chart, cost is treated as an indepen
models typically did not properly present the data in a more comprehensible format to the decision-maker. . When trade studies are executed using this process model, technical and . originally take the ‘ilities into account. PHASED APPROACH The complete trade study process is defi