Transcription
2014 Taxicab Fact BookThe Taxicab Fact Book was last published in 2006 by Schaller Consulting. Since then, many changes have occurred, allowing us to take anew look at how yellow taxis operate in New York City. The largest change has been the introduction of the Taxi Passenger EnhancementProgram (TPEP), a technology initiative which introduced credit card readers to all taxis in 2008. Along with this came the collectionof electronic trip-sheet data, replacing handwritten paper trip -sheets with independent records including information on pick-up anddrop-off times and locations and itemized fare amounts. With the new TPEP data, we are able to take a look at taxi patterns from all taxiswithout having to rely on samples of trip-sheets.The 2014 Taxicab Fact Book is a quick look at the state of the yellow taxi industry (with a brief look at the other for-hire vehicle industries).This will be the first in a regular summary of taxi trends in New York City. Not only does the 2014 Fact Book contain updated statistics ontotal trips and fares, but it also provides unique looks at trip patterns by borough, shifts and taxi availability, and driver and passengerdemographics.
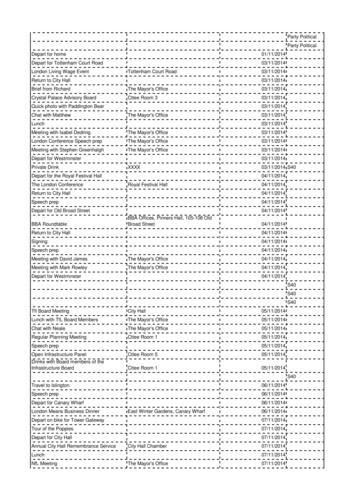
There are 13,437 medallions, the right to run a yellow taxiAirport TStreeYELLOW TAXISailstHStandaxiBORO TAXISAnywhereFor more on medallions, see p 12A typical taxi travels 70,000 miles per year, enough to travel around the world 2.8 timesThe average age of a taxi vehicle is 3.3 yearsBoro Taxis were created as a new class of licto provide legal, yellow-caliber taxi service tosince 94% of yellow taxi pick-ups occur eitheor at one of the airports.60% of taxi vehicles are hybrid-electric vehicles and 2% of taxi vehicles are wheelchair-accessibleTrips: 485,000 per day 175 MILLION per yearThe are over 50,000 driversA typical driver shift is 9.5 hoursFor more on trips, see p 3-6Boro Taxis are a hybrid service, providing botand prearranged for-hire vehicle services.For more on drivers, see p 9-10For more on shifts, see p 8Passengers: 600,000 per day 236 MILLION per yearFor more on passengers, see p 1118,000 Boro Taxi permits are being issued in6,000. The first group of 6,000 has been solissuance planned for June 2014.Models of OperationFleetsRun garages that own and operate many taxisDrivers lease the taxi on a daily or weekly basisThe lease fee is capped according to TLC regulationsBoro Taxis are not permitted to pick up passeManhattan below E 96th Street or W 110th Sserve airport taxi queuesDriver-Owned Vehicles (DOV)Driver conditionally owns the car but leases the medallion from an agent who manages it for an ownerIndividual Owner-OperatorsDriver owns car and medallion and is required to drive at least 210 shifts per yearRegulationsStreet hails or e-hails anywhere in NYCAccessible vehicles are required to participate in Accessible Dispatch programTLC sets rate of fareSpecific vehicle standards (TLC inspection 3 times per year)For more on inspections, see p 13Closed entry with a fixed supplyDrivers must be able to read, speak, and understand English1Boro Taxi Service AreasBRONXWest 110 StreetMANHATTANLGAEast 96 StreetQUEENSBROOKLYNSTATEN ISLANDJFK
in Boro ZoneedangOTHER FOR HIRE VEHICLES (FHVs)PrearrPrearrStreeailstHin Boro ZoneedangAnywhereLiveries (also known as Car Services or Community Cars)cense in 2012o the boroughs,er in ManhattanFor more on yellow tripsby borough, see p 5-6th street-hailProvide for-hire service by pre-arrangementAround 500 base stations located throughout the five boroughsAbout 25,000 vehiclesVehicles must be affiliated with a baseAverage age of vehicles is about 7 yearsPassengers: about 500,000 per dayFare: set by base and varies by neighborhoodRegulationsTrip must be prearranged via basesStreet hailing not permittedWide variety of vehicle types (TLC inspection once every 2 years)Open entryFor more on inspections, see p 13n three groups ofld, with the secondBlack CarsProvide service mostly for corporate clients, setting fares by contracts with clientsengers inStreet or toAround 80 base stations located throughout the five boroughsAbout 10,000 vehiclesVehicles must be affiliated with a baseAverage age of vehicles is about 5.5 yearsRegulationsPrearranged contracted service, 90% non-cash basisWide variety of vehicle types (TLC inspection once every 2 years)For more on inspections, see p 13Open entryFor more on Boro Taxis, including new factson a brand new service, check out the nextTaxicab Fact Book!Other IndustriesLuxury LimousinesProvide chartered serviceAbout 7,000 vehiclesOver 200 companiesParatransitProvide transportation for healthcare facilitesAbout 2,000 vehiclesOver 200 paratransit providersCommuter VansProvide service for passengers along fixed routesAbout 500 vehiclesAround 50 van authorizations2014 Taxicab Fact Book2
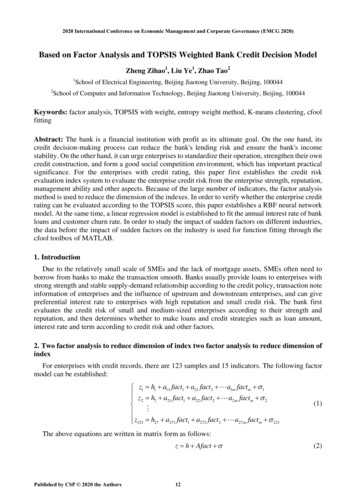
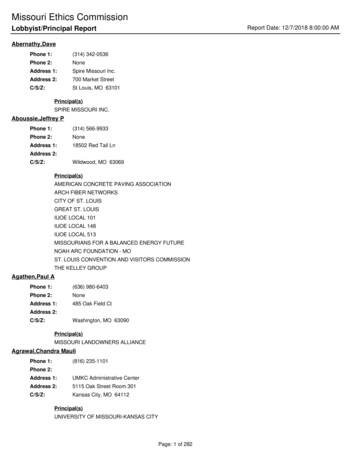
20%0%3 ½½ to 11 to 1 ½1 ½ to 22 to 2 ½2 ½ to 33 to 3 ½3 ½ to 44 to 4 ½4 ½ to 55 to 5 ½5 ½ to 66 to 6 ½6 ½ to 77 to 7 ½7 ½ to 88 to 8 ½8 ½ to 99 to 9 ½9 ½ to 1010 to 10 ½10 ½ to 1111 to 11 ½11 ½ to 1212 to 12 ½12 ½ to 1313 to 13 ½13 ½ to 1414 to 14 ½14 ½ to 1515 to 15 ½15 ½ to 1616 to 16 ½16 ½ to 1717 to 17 ½17 ½ to 1818 to 18 ½18 ½ to 1919 to 19 ½19 ½ to 2020 700,000600,000597,3272009The average trip distance DEC JAN FEB MAR APR MAY JUN JUL AUG SEP OCT NOV DEC JAN FEB MAR APR MAY JUN JUL AUG SEP OCT NOV DEC JAN FEB MAR APR MAY J20102011Yellow taxis provide an average of485,000trips/day2.6 miles20% of all trips are less than 1 mile (about 20 Manhattan blocks)99% of all trips are less than 12 miles10%Trip Distance
Daily Trips12/2008 to 11/2013591,464113,79429,092JUN JUL AUG SEP OCT NOV DEC JAN FEB MAR APR MAY JUN JUL AUG SEP OCT NOV DEC JAN FEB MAR APR MAY JUN JUL AUG SEP OCT NOV20122013Days with fewer than 350,000 trips can be explainedby either holidays or major weather eventsThe most trips between 2008 and 2013 occurred onHOLIDAYSNew Year’s DayMemorial DayIndependence DayLabor DayThanksgivingChristmas2008WEATHER EVENTSMost significant eventsDecember 11, 2009, a Friday.Years with under 350,000 trips2009200920092009200920092011 2012 201320102012 20132010 2011201320102012 20132010 2011 2012 20132010 2011 2012no dataDate12/27/2010Blizzard8/28/2011Hurricane IreneSuperstorm Sandy 10/29/2012Trips72,01929,029113,794Other top days includeFebruary 12, 2011 & February 11 2012,both Saturdays aroundValentine’s DayAverage daily taxi usage is typically highestin the spring months and lowest in the summer monthsMONTHS WITH HIGHEST & LOWEST AVERAGE DAILY WDECDECDECDECDECno data2014 Taxicab Fact Book4
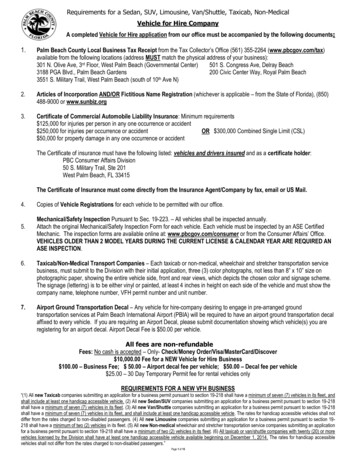
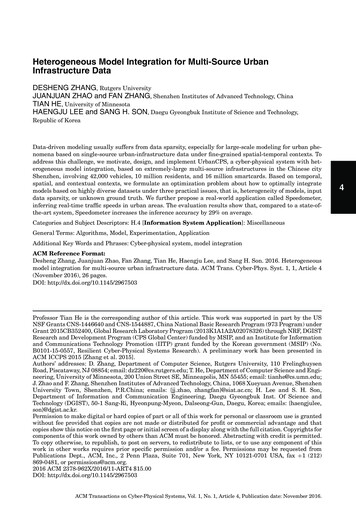
KLYNManhattanJFKSTATEN 2 AM4 AM8 AM12 PM4 PM8 PM12 AM4 AM8 AM12 PM4 PM8 PM12 AM4 AM8 AM12 PM4 PM8 PM12 AM4 AM8 AM12 PM4 PM8 PM12 AM4 AM8 AM12 PM4 PM8 PM12 AM4 AM8 AM12 PM4 PM8 PM12 AM4 AM8 AM12 PM4 PM8 005,0004,0003,0002,00012 AM4 AM8 AM12 PM4 PM8 PM12 AM4 AM8 AM12 PM4 PM8 PM12 AM4 AM8 AM12 PM4 PM8 PM12 AM4 AM8 AM12 PM4 PM8 PM12 AM4 AM8 AM12 PM4 PM8 PM12 AM4 AM8 AM12 PM4 PM8 PM12 AM4 AM8 AM12 PM4 PM8 PM1,000MONTUESource: NYC TLC TPEP Trip-sheet data, ns1.5%Staten Island0.8%Airports3.5%New York CityAverage Total Pick-ups and Drop-offs by Time of Day (15-minute increments)% of all TaxiPick-ups100.0%Yellow taxi activity is centered on Manhattan, where90.3% of taxi pick-ups occur. After Manhattan, thearea with the highest percentage of pick-ups is atthe airports, which together account for 3.5% of allpick-ups. Taxi activity in the boroughs outside of theairports is scarce: in total, about 6.2% of all pick-upsoccur in these areas. The borough with the largestshare is Brooklyn, where 3.1% of all taxi pick-ups occur,followed by Queens with 1.5%, the Bronx with 0.9%, andStaten Island with 0.8%.Looking at trip patterns by time of day and day of week,Manhattan continues to be the primary borough wherepick-ups occur. However, there are a few times ofday where pick-ups in Brooklyn and Queens and at theairports make up a higher share of all pick-ups thanusual. The Brooklyn share of pick-ups reaches itspeaks overnight, usually between 10PM and 5AM. Theaverage weekly peak occurs early Sunday morningswhen Brooklyn pick-ups make up 8% of all pick-upsbetween 1:30AM and 2:30AM (representing about 1,800taxi pick-ups on average for this hour). The Queensshare of pick-ups reaches its peaks at the start of theAM shift, likely due to the fact that most taxi garagesare located in Northwestern Queens. Most morningsbetween 4:30AM and 6:00AM, about 5-6% of all pickups occur in Queens.At the airports, daily peaks occur in the AM around5:30AM and in the evening around 4:30PM, and thesepeaks range from representing 4% to 7% of all pickups. The weekly peak occurs late on Sunday evenings,where taxi traffic is generally low, when pick-ups at theairport represent about 8% of all taxi pick-ups. From6PM to midnight on Sunday evenings, around 1,250taxi pick-ups occur each hour, on average. This is notsignificantly higher than the volumes at the airportsduring other peaks, but with fewer taxis on the road atthis time, these trips make up a higher proportion ofall trips. Pick-ups in the Bronx and Staten Island, onaverage, do not make up more than 1% of all trips atany given point in time during the week.Weekly peaks in the percentage of trips ending outerboroughs are even higher than for pick-ups. Taxi trips
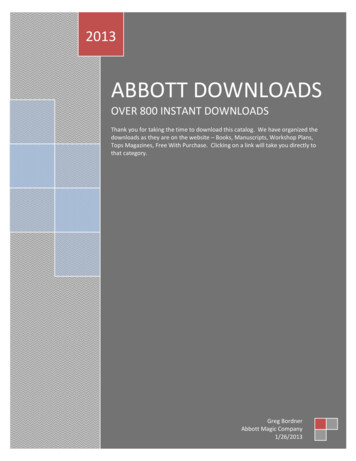
Percentage of Airport Passengers Arriving or Departing bySome seasonality exists for taxi travel to and from theairports. In July and August of each year from 2011 to2013, the share of airport passengers traveling by taxidrops a few percentage OVSEPOCTJULAUGJUNAPRMAYFEBMARJAN5%201330%JFK AIRPORTTaxis are an important mode of transportation to andfrom the New York City airports. Not only do taxi tripsto or from the airport represent 5% of all taxi trips,taxis serve a large portion of all airport passengers.From 2011 to 2013, yellow taxis serve, on average, 26%of all passengers arriving to or departing from LaGuardia Airport1. At JFK Airport, taxis serve about 10% ofall arrivals and departures. The AirTrain at JFK, whichtravels between the terminals and the Howard Beachstation on the A subway line and the Jamaica station onthe E,J, and Z subway lines and the Long Island Railroad,carries an equal share of airport passengers (an average of about 11% of all passengers).orLAGUARDIA AIRPORTending in Brooklyn peak at about 18% of all trips, onaverage, on Saturdays at 4:45AM, reaching similarlevels early mornings between 2:00AM and 5:00AM. OnSaturdays between midnight and 3:00AM, around 3,100taxi trips end in Brooklyn each hour, on average. InQueens, drop-off peaks occur at similar times, with aweekly average peak in drop-offs representing 13% ofall drop-offs on Saturday at 5:15AM. Around 1,650 tripsper hour end in Queens, on average, for Saturdays between midnight and 3:00AM. Drop-offs at the airportspeak in the AM between 4:30AM and 6:30AM. On MondayAM, around 21% of all taxi trips end at the airportsbetween 5:00AM and 5:30AM, on average. Trips endingin the Bronx peak at about 3% of all trips on Saturdayand Sunday mornings between 4:30AM and 5:30AM.25%20%15%10%20111 Passenger volumes at airports from annual and monthly Airport Traffic Reportspublished by the Port Authority of New York and New RMAYMARFEBJAN5%2013Source: NYC TLC TPEP Trip-sheet data, 2011-2013; PANYNJ Annual and Monthly Airport Traffic Reports, 2011-20132014 Taxicab Fact Book6
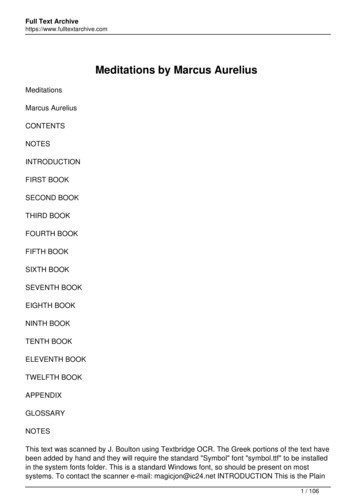
Average Driver Fare Revenue per Hour (Gross and Net)TippingTipping by taxi passengers has remained rather constant for the last few years, holding at an average tip of18%. This tip percentage persisted even after the fareincrease in late 2012, meaning drivers are making morein tips since the base for the tip is now higher.Taxi Fares in NYC Compared to Other Cities 35.00 30.00 25.00 20.00 15.00 10.0012 AM4 AM8 AM12 PM4 PM8 PM12 AM4 AM8 AM12 PM4 PM8 PM12 AM4 AM8 AM12 PM4 PM8 PM12 AM4 AM8 AM12 PM4 PM8 PM12 AM4 AM8 AM12 PM4 PM8 PM12 AM4 AM8 AM12 PM4 PM8 PM12 AM4 AM8 AM12 PM4 PM8 PM 5.00MONTUEWEDTHUFRISATSUNSource: NYC TLC TPEP Trip-sheet data, 2013 50.00 45.00 40.00 35.00 30.00 25.00 20.00 15.00 10.00 5.00MONTUEWEDTHUFRISATSUNSource: NYC TLC TPEP Trip-sheet data, 2013 and estimates of amortized hourly vehicle lease payments and gas expensesMonthly Average Percentage of Trips Paid by Credit Card100%CREDIT CARD USAGEWhile a ride in a New York taxi may cost more than taking one of the city’s buses or trains, the average NewYork taxi fare ranks relatively in the middle comparedto taxi fares nationwide. In a study of the nation’s 60largest metropolitan areas, New York ranked 42nd fora one-mile cab ride with an average fare of 6.31. Fora five-mile cab ride, New York came in at 46th and fora ten-mile ride, it ranked 47th. In each category, NewYork was less expensive than Boston, Los Angeles,San Francisco, and San Jose. This trend holds true,even after the 2012 fare increase. New York is moreexpensive than the national average, however2. Thisrepresents a change from 2006, when the average NewYork cab fare at the time was slightly below average,coming in 11th out of 14 major U.S. cities with 1,300 ormore metered taxi cabs.3 40.00NET REVENUE/HOURBefore TPEP systems were introduced to all yellow taxisin late 2008, no taxis accepted credit cards. At thetime when credit card readers had been installed in alltaxis in late 2008, passengers paid by credit card forless than 20% of all trips, and the share of trips paid bycredit card has grown steadily since then. Today, paying with a credit card is more popular than paying withcash, as 55% of all trips are paid by credit card. 45.0012 AM4 AM8 AM12 PM4 PM8 PM12 AM4 AM8 AM12 PM4 PM8 PM12 AM4 AM8 AM12 PM4 PM8 PM12 AM4 AM8 AM12 PM4 PM8 PM12 AM4 AM8 AM12 PM4 PM8 PM12 AM4 AM8 AM12 PM4 PM8 PM12 AM4 AM8 AM12 PM4 PM8 PMThe average revenue taken in by a taxi driver variesby time of day and day of week. Average hourly grossrevenue ranges from around 26 for Wednesdays at3AM to just over 44 for Thursdays at 10PM. After accounting for hourly expenses, including 1.43 per hourfor fuel1 and amortized lease payments ranging from 9.58 to 11.58 per hour, hourly net revenue rangesfrom 14 for Wednesday at 3AM to 31 for Thursdays at10PM. In comparison, according to the Bureau of LaborStatistics, bus drivers make an average of about 21per hour, which falls in the middle of the range for taxidrivers. It is important to note, however, that unlikebus drivers, taxi drivers do not receive employersponsored benefits.GROSS REVENUE/HOUR 50.00The average yellow taxi fare in 2013 was 13.40,an increase from 2012, when the averag the entire week, with bothshifts running with about 67% of all taxis.At the traditional PM shift-change time (from 4PM to5PM) each day, the number of available taxis on theroad drops considerably. On an average weekday,service levels at this time drop 33% from service levels at noon. The large number of taxis changing handsbetween 4PM and 6PM seems to have a quantifiableeffect on a passenger’s ability to hail a taxi when he orshe needs one. There is a daily spike in the percentageof available taxis that are occupied between 4PM and6PM each day. On average, 64% of taxis are occupiedduring these hours.Aside from these spikes, other areas of high occupancyoccur mostly at peak travel times. For weekday AMrush hours (between 8AM and 9AM), the average occupancy is around 56%. For the PM rush hours followingthe shift change (between 6PM and 7PM), the averageoccupancy is around 62%. On Friday and Saturdaynights, peaks occur around midnight and again at 4AM,when bars close in NYC. At midnight on weekends, 56%of available taxis are occupied, on average, and at 4AM,about 49% of available taxis are occupied.2014 Taxicab Fact Book8
Place of BirthEgypt4.4%2.8%United %6.9%Dominican .1%India9.3%Top 6 Countries5.1%% of Yellow Taxi Drivers% of FHV DriversSource: NYC TLC Licensing Data, September 2013Where Drivers Come FromUPSTATE NY2%2%TLC-licensed drivers come from all five New York Cityboroughs, 31 U.S. states and the District of Columbia,and more than 175 countries around the world. A handful of these countries have only one driver in the fleet,whereas other countries have tens of thousands.The highest concentration of yellow taxi drivers comesfrom Bangladesh, with over 10,250 drivers. Driversfrom Bangladesh now represent 23.1% of all yellow taxidrivers. Pakistan comes in second with 5,850 yellowtaxi drivers (about 13.2% of all yellow taxi drivers).This represents a shift from 2005, when the highestconcentration came from Pakistan (14.4%), and Bangladesh was second at 13.6%. The concentration of driverscoming from the U.S. and associated territories hasalso decreased from 9.1% in 2005 to 6.0% today.For FHV drivers, the number one place of birth isthe Dominican Republic. Drivers from this countryrepresent 19.5% of all FHV drivers (over 9,000 driversin total). The second highest concentration of FHVdrivers comes from the U.S., representing 9.6% of allFHV drivers (about 4,500 drivers).Where Drivers LiveAbout 88% of TLC-licensed drivers live within the fiveboroughs that make up New York City. A plurality ofyellow taxi drivers live in Queens (about 43%). AfterQueens, the most popular boroughs are Brooklyn(23%), the Bronx (13%), Manhattan (7%), and StatenIsland (2%). In comparison, FHV drivers are morespread out throughout the five boroughs, with 29% of9BRONX13%22%NEW JERSEY6%5%MANHATTAN7%10%QUEENSBROOKLYN43%29%LONG ISLAND3%4%23%24%STATEN ISLAND2%3%% of Yellow Taxi Drivers% of FHV DriversPlace of ResidenceSource: NYC TLC Licensing Data, September 2013
85 30-3425-2920-24Under 20Female1%Male99%0.0%85 30-3425-2920-24Under 20Gender Distribution of Yellow Taxi DriversAge Distribution of Yellow Taxi Drivers2.0%4.0%6.0%8.0%10.0%12.0%14.0%16.0%Gender Distribution of FHV DriversAge Distribution of FHV 0%14.0%16.0%Source: NYC TLC Licensing Data, September 2013drivers in Queens, 24% in Brooklyn, 22% in the Bronx,10% in Manhattan, and just 3% in Staten Island.Among those drivers who do not live in New York City,most live in New Jersey (around 6,300 or 6% of alldrivers) or in New York State on Long Island (about 4%)or in Upstate NY (2%). Less than one percent of alldrivers live elsewhere.Who Drivers AreAlthough female drivers have been behind the wheelsof New York City cabs since the 1940s,1 the taxi industrycontinues to be nearly all male. This trend has heldfirm for many, many years. Around 49,500 (98.9%) oftoday’s yellow taxi drivers are male, whereas just 536are female. The percentage of female FHV drivers isslightly higher, with a total of around 2,300 female drivers (just under 4% of all FHV drivers).TLC-licensed drivers range in age from 19 years (theyoungest age allowed by TLC Rules), to the oldest, whoturned 94 in August 2013. The average age for a NewYork City yellow taxi driver is 46 years old, up from44 years old in 2005. For FHV drivers, the averageage is 47 years. Looking at the age distributions foryellow taxi and FHV drivers, a larger share of yellowtaxi drivers are younger in age than FHV drivers, withabout 21% of yellow drivers under 35 years old and just19% of FHV drivers. The largest age cohort for bothgroups of drivers is those between 50 and 54 years ofage. Around 14% of yellow taxi drivers and 15% of FHVdrivers fall into this age group.1 Feeney, Michael J., “Meet Gertrude Hadley Jeanette, New York City’s 1st femalecab driver,” The New York Daily News, 1 April, 2011. abdriver-article-1.1194182014 Taxicab Fact Book10
AgeYellow Taxis serve around 600,000 passengers everyday in New York City. They serve a broad spectrum ofpeople, men and women who are young and old, poorand rich. However, taxi passengers are disproportionately younger and more affluent than the population ofNYC as a whole and much closer socio-economically toManhattanites.In surveys conducted on passenger-facing monitorsin the back of taxis, 49% of taxi passengers reportedthat they were male and 34% reported that they werefemale (17% declined to answer). This ratio of males tofemales is somewhat higher than the gender breakdownfor the city as a whole, where men make up 47.5% ofthe city’s total population and women make up 52.5%.71 or older12%51 to 705%20 or younger35%36 to 5013%21 to 3535%Source: NYC TLC In-Taxi Passenger Surveys, 2012-2013Sex of PassengersIncomePrefer not to answer17% 100K or higher42%Under 10K11% 10K to 50K12%49%34%Over two-thirds of taxi passengers are 35 or under,with 35% of passengers reporting that they areyounger than 20 years old, while another 35% reportbeing between 21 and 35 years old. While these agegroups are also the largest citywide at 26% and 25%,respectively, they are overrepresented in the taxipassenger population. Those who are 70 and older arealso overrepresented at 12% of passengers but just 8%of the city’s population. Passengers between 36 and 50years old are underrepresented at 13% of the ridingpublic and 21% of the total population, as are passengers who are between 51 and 70, who make up 20% ofthe city’s population but just 5% of taxi passengers.1 50K to 100K18%42% of taxi passengers have an annual householdincome of 100,000 or higher while 11% have an annualhousehold income of less than 10,000. Householdannual incomes of 10,000 to 50,000 and 50,000 to 100,000 represent 12% and 18% of taxi passengers,respectively (17% declined to answer.) Citywide, 24%of the population has a household income of 100,000or more per year and 11% have an income of less than 10,000. In Manhattan, where most taxi passengers liveand work, 37% have an income of 100,000 or higher,which may explain in part why the income bracket is sooverrepresented.2Source: NYC TLC In-Taxi Passenger Surveys, 2012-2013Car OwnershipNo48%Yes52%A small majority (52%) of taxi passengers own theirown cars, which is higher than overall car ownershiprates in New York City, where only 44% of all households own at least one car.3Source: NYC TLC In-Taxi Passenger Surveys, 2012-201317%MALEFEMALEDriver’sLicensePREFER NOTTO ANSWERSeatBeltsNo45%No62%Yes55%Yes38%Source: NYC TLC In-Taxi Passenger Surveys, 2012-20131 Source: U.S. Census Bureau, 2010 Census Summary File 1, Table P62 Source: U.S. Census Bureau, 2012 American Community Survey 1-Year Estimates,Table S19013 Source: U.S. Census Bureau, 2012 American Community Survey 1-Year Estimates,Table B250444 Source: U.S. Bureau of Transportation Statistics; Seat Belt Use in the States, U.S.Territories, and Nationwide, 2005-2012; July 2013. Available at tPhonesSource: NYC TLC In-TaxiPassenger Surveys, 2012-2013No33%Yes67%More than half (55%) of New York City taxi passengershave a driver’s license.Most passengers do not wear seatbelts in the city’staxicabs. Only 38% of passengers reported they wereusing the taxi’s seatbelts while taking the passengersurvey. Seat belt usage overall in New York State isabout 90%.4Two-thirds of New York taxi passengers own or usea Smart phone. 55% say they would like the option ofusing their phone to locate taxicabs, and 54% say theywould pay for their rides with their phone if they coulddo so.
The Haas Act classified the two types of medallions inuse today: independent and mini-fleetIt also set up a nominal “60/40” ratio of mini-fleet toindependent medallionsThe Price of a MedallionTLC does not set the price of a medallion; instead, themarket sets the price of the medallion. The price of amedallion depends on a number of factors. Taxi fares and tips Demand for taxi service Availability and cost of taxicab medallion financing Market for the medallion Anticipated return on the investment to acquire amedallion as compared to other investments Cost of operating a taxi 800,000 600,000 400,0002013201020002000200519951995199019801990 1,200,0001985 1,400,00019751970 200,0001985Independent MedallionsMini-Fleet Medallions 1,000,000 800,000 600,000 400,000 200,000201320102005Originally it set a limit of 16,900 taxi medallions.However, that number was decreased to 11,787 afterWorld War II. It remained unchanged until 1996 whenit was increased by 133 medallions to a total of 11,900.As of now, there are 13,437 total taxi medallions in NewYork City. 1,000,0001980Until the mid-1930s, the taxi industry of New York Cityhad no regulation. There were an unspecified numberof taxis and there wasn’t a set standard for the faresthat could be charged by a driver. This changed in 1937with the enactment of the Haas Act, which establishedthe medallion system.Mini-Fleet Medallions1975The Haas ActIndependent MedallionsINFLATION-ADJUSTEDA mini-fleet medallion is a class of medallion taxicablicense that must be owned in groups of at least two.The owners of mini-fleet medallions own multiplemedallions and many maintain a fleet of taxi vehiclesthat are leased to drivers on a per shift basis. Incomesfor fleet owners are derived from l
The 2014 Taxicab Fact Book is a quick look at the state of the yellow taxi industry (with a brief look at the other for-hire vehicle industries). This will be the first in a regular summary of taxi trends in New York City. Not only does the 2014 Fact Book contain updated statistics on