Transcription
Basic Tools for Process ImprovementModule 4AFFINITY DIAGRAMAFFINITY DIAGRAM1
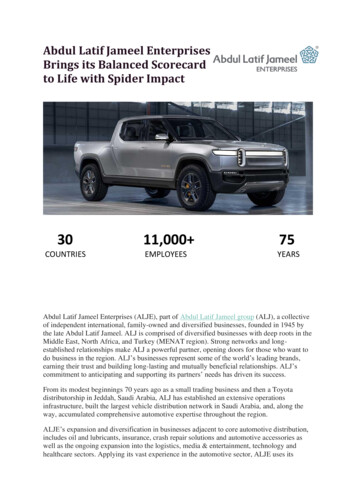
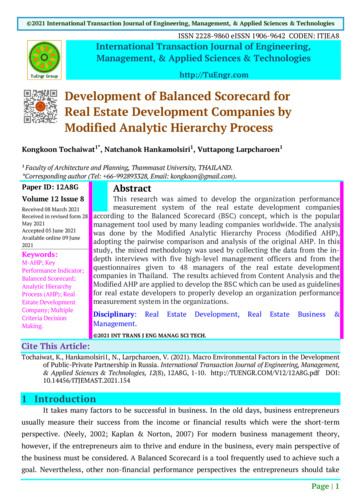
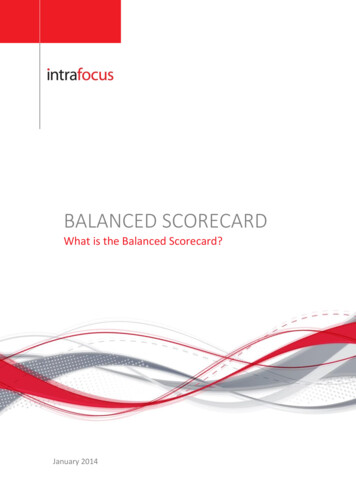
Basic Tools for Process ImprovementWhat is an Affinity Diagram?An Affinity Diagram is a tool that gathers large amounts of language data (ideas,opinions, issues) and organizes them into groupings based on their naturalrelationships (Viewgraph 1). The Affinity process is often used to group ideasgenerated by Brainstorming.Why should teams use the Affinity process?The Affinity process is a good way to get people to work on a creative level to addressdifficult issues. It may be used in situations that are unknown or unexplored by ateam, or in circumstances that seem confusing or disorganized, such as when peoplewith diverse experiences form a new team, or when members have incompleteknowledge of the area of analysis.When should we use the Affinity process?The Affinity process is formalized in an Affinity Diagram and is useful when you wantto (Viewgraph 2)!!Sift through large volumes of data. For example, a process owner who isidentifying customers and their needs might compile a very large list ofunsorted data. In such a case, creating an Affinity Diagram might be helpfulfor organizing the data into groups.Encourage new patterns of thinking. An Affinity exercise is an excellent wayto get a group of people to react on a "gut level" rather than mulling thingsover intellectually. Since Brainstorming is the first step in making an AffinityDiagram, the team considers all ideas from all members without criticism. Thisstimulus is often enough to break through traditional or entrenched thinking,enabling the team to develop a creative list of ideas.When shouldn't we use the Affinity process?As a rule of thumb, if less than 15 items of information have been identified, you canskip the Affinity process. Instead, you can clarify and combine the ideas and thenuse one of the Decision-Making Tools to identify the highest priority items.2AFFINITY DIAGRAM
Basic Tools for Process ImprovementWhat Is an Affinity Diagram?A tool that gathers large amounts oflanguage data (ideas, opinions,issues) and organizes them intogroupings based on their naturalrelationships.AFFINITY DIAGRAMVIEWGRAPH 1When to Use the Affinity Process Sift through large volumes ofdata Encourage new patterns ofthinkingAFFINITY DIAGRAMAFFINITY DIAGRAMVIEWGRAPH 23
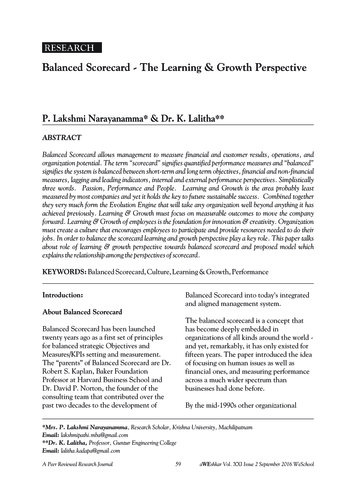
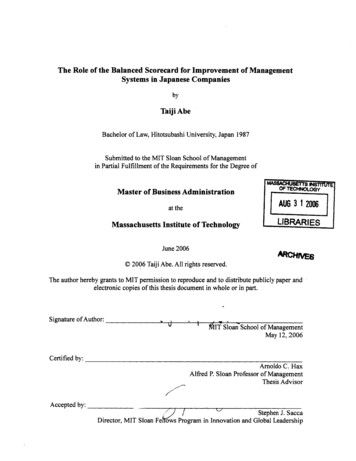
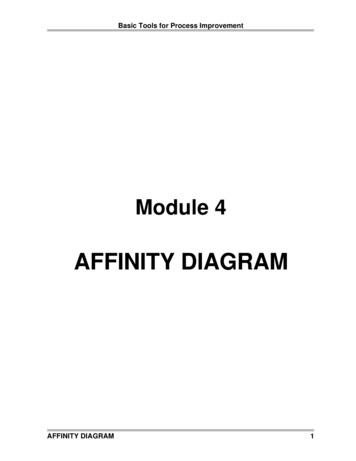
Basic Tools for Process ImprovementHow is an Affinity Diagram created?Affinitizing is a process performed by a group or team. The idea is to meld theperspectives, opinions, and insights of a group of people who are knowledgeableabout the issues. The process of developing an Affinity Diagram seems to work bestwhen there are no more than five or six participants.Before we go over the steps used to create an Affinity Diagram, we need to look atsome unique features of the Affinity process that are important to its success:Affinitize silently. The most effective way to work is to have everyone movethe displayed ideas at will, without talking. This is a new experience formany people. It has two positive results: It encourages unconventionalthinking (which is good), while it discourages semantic battles (which are bad).It also helps prevent one person from steering the Affinity.Go for gut reactions. Encourage team members not to agonize over sortingbut to react quickly to what they see. Speed rather than deliberation is theorder of the day, so keep the process moving.Handle disagreements simply. The process provides a simple way tohandle disagreements over the placement of ideas: If a team member doesn’tlike where an idea is grouped, he or she moves it. This creates anenvironment in which it is okay to disagree with people having a differentviewpoint. If consensus cannot be reached, make a duplicate of the idea andplace one copy in each group.Now let’s walk through the step-by-step process of creating an Affinity Diagram(Viewgraph 3). This sequence has been adapted from the The Memory JoggerPlus [Ref. 1].Step 1 - Generate ideas. Use the Brainstorming tool to generate a list of ideas.The rest of the steps in the Affinity process will be easier if these ideas are writtenon post-its TM .Step 2 - Display the ideas. Post the ideas on a chartpack, a wall, or a table in arandom manner.4AFFINITY DIAGRAM
Basic Tools for Process ImprovementCreating an Affinity DiagramStep 1 - Generate ideasStep 2 - Display ideasStep 3 - Sort ideas into groupsStep 4 - Create header cardsStep 5 - Draw finished diagramAFFINITY DIA GRAMAFFINITY DIAGRAMVIEWGRA PH 35
Basic Tools for Process ImprovementStep 3 - Sort the ideas into related groups. The team members physically sort thecards into groupings, without talking, using the following process:!!!Start by looking for two ideas that seem related in some way. Place themtogether in a column off to one side.Look for ideas that are related to those you've already set aside and add themto that group.Look for other ideas that are related to each other and establish new groups.This process is repeated until the team has placed all of the ideas in groups.NOTE: Ideally, all of the ideas can be sorted into related groups. If there aresome "loners" that don’t fit any of the groups, don’t force them into groupingswhere they don’t really belong. Let them stand alone under their own headers.Step 4 - Create header cards for the groups. A header is an idea that captures theessential link among the ideas contained in a group of cards (Viewgraph 4).This idea is written on a single card or post-itTM and must consist of a phrase orsentence that clearly conveys the meaning, even to people who are not on theteam. The team develops headers for the groups by!!!Finding already existing cards within the groups that will serve well as headersand placing them at the top of the group of related cards.Alternatively, discussing and agreeing on the wording of cards createdspecifically to be headers.Discovering a relationship among two or more groups and arranging them incolumns under a superheader. The same rules apply for superheaders as forregular header cards.Step 5 - Draw the finished Affinity Diagram.6!Write a problem statement at the top of the diagram.!Place header and superheader cards above the groups of ideas.!Review and clarify the ideas and groupings.!Document the finished Affinity Diagram (Viewgraph 5).AFFINITY DIAGRAM
Basic Tools for Process ImprovementWhat Is a Header?An idea that captures the essentiallink among the ideas contained ina group of cards. Single card or post-it TM Phrase or sentence Clear meaningAFFINITY DIAGRAMVIEWGRAPH 4Drawing the Finished DEAIDEAIDEAIDEAIDEAIDEAAFFINITY DIAGRAMAFFINITY DIAGRAMVIEWGRAPH 57
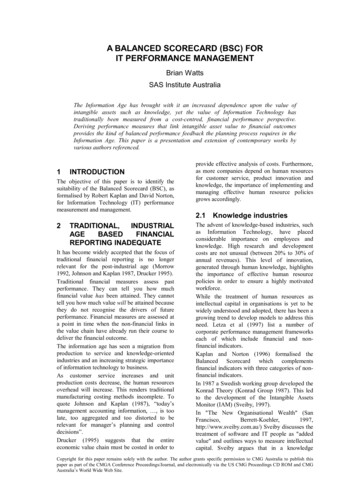
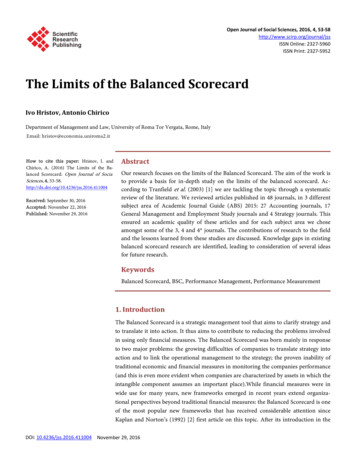
Basic Tools for Process ImprovementHow can we practice what we’ve learned?Some practical exercises will enable you to apply the skills you've just learned.These exercises are intended to be done by a team with the assistance of a facilitatoror instructor. Everyone on the team should take an active part.The first exercise takes you through the Affinity process in detail, using viewgraphs toillustrate how the random spread of cards might be grouped to arrive at a finisheddiagram. The diagram provided is only an example. It is different from the diagramin Hoshin Planning [Ref. 4, p. 4-5] from which it was adapted, and your team'sgroupings will probably be different from both of these. The important thing is that thefinished diagram should be one that everyone on your team can live with andsupport.When you have completed the detailed exercise, you may want to practice creatingan Affinity Diagram for some of the other topics listed after the exercise.DETAILED EXERCISE: Now let's go through the steps of the Affinity process tocreate a diagram using the following problem statement and the sample ideasprovided in Viewgraphs 6, 7, 8, and 9.What are the issues in implementing continuous process improvement?Step 1- Generate ideas. Copy each of the ideas displayed in Viewgraph 6 ontopost-its TM or cards, one idea to a card. The facilitator can do this in advance,or the participants can do it at the beginning of the exercise.Step 2 - Display the ideas. Place the post-its TM on a chartpack, easel, or wall, in arandom manner (Viewgraph 6).Step 3 - Sort the ideas into related groups (Viewgraph 7). Group the ideas bymoving the cards independently. Participants should go with their gutreactions. If they disagree on the placement of a card, they are free to moveit. The instructor should remind them that affinitizing is a quick processconducted in silence.8AFFINITY DIAGRAM
Basic Tools for Process ImprovementStep 2 - Display the IdeasIssues in Implementing Continuous Process ImprovementPressure forsuccessLack of follow-upby managementData collectionprocess needsWant to solveproblem beforeclearly definedEverybody needsto change but meToo busy tolearnBehaviormodifications maytake longer than timeavailableNeed new datacollection systemLack of managementunderstanding ofneed for itDevelopingproduct withoutdeveloping processSome people willnever changeDon’t know whatcustomer wantsShort-term planningmentalityWhat are the rewardsfor using toolsLack of training atall levelsCompetitionversuscooperationNeed to becreativeAFFINITY DIAGRAMWhich comes first,composing the team orstating the problem?Unrealisticallotment oftimeNot usingcollecteddataLack of trust inthe processToo manyprojects at onceVIEWGRAPH 6Step 3 - Sort Ideas into Related GroupsIssues in Implementing Continuous Process ImprovementSome people willnever changeDevelopingproduct withoutdeveloping processLack of follow-upby managementCompetitionversuscooperationData collectionprocess needsEverybody needsto change but meWhich comes first,composing the team orstating the problem?Lack of training atall levelsPressure forsuccessNeed new datacollection systemNeed to becreativeDon’t know whatcustomer wantsToo busy tolearnWhat are the rewardsfor using toolsUnrealisticallotment oftimeBehaviormodifications maytake longer than timeavailableWant to solveproblem beforeclearly definedShort-term planningmentalityNot usingcollecteddataLack of trust inthe processAFFINITY DIAGRAMAFFINITY DIAGRAMLack of managementunderstanding ofneed for itToo manyprojects at onceVIEWGRAPH 79
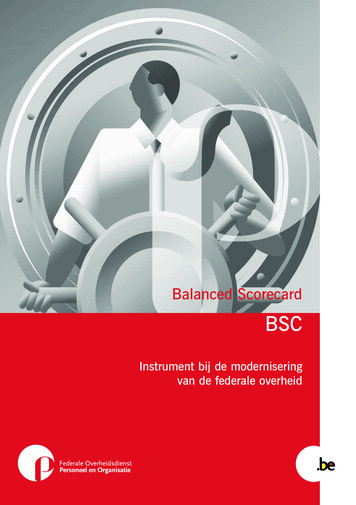
Basic Tools for Process ImprovementStep 4 - Create header cards. Make sure that each header placed at the top of agroup captures the essential link among all of the ideas beneath it andconsists of enough words to clearly convey the meaning. Refer to Viewgraph8 for an example of header cards that have been developed for thisexercise—or have the participants create their own.Step 5 - Draw the finished Affinity Diagram. Make sure you write the problemstatement on top of the diagram, place a header card above each group ofideas, allow the team to review and discuss points for clarification, anddocument the finished product. Refer to the completed Affinity in Viewgraph 9for an example; but remember, it's only an example. If the participantsdeveloped their own header cards, the Affinity they create will be different.OTHER EXERCISE TOPICS:Now try developing an Affinity Diagram for one or more of these topics: How can we improve the readiness of the command? What can be done about the state of readiness of the fire control systems? Why is our ship dragging anchor in heavy weather? What things do we need to consider in planning a perfect meeting? What can be done to ensure proper disposal of recyclable material? How can information flow be improved within our organization? Why are the organization's vehicles getting poor gas mileage? What can be done to ensure fast service at the pharmacy prescription counter? What activities should we plan for the unit Christmas party?10AFFINITY DIAGRAM
Basic Tools for Process ImprovementStep 4 - Create Header CardsIssues in Implementing Continuous Process Improvement(Header Cards)Breaking through oldway “Dinosaur”thinkingLack AFFINITY DIA GRAMLack of TQLknowledgeVIEWGRA PH 8Step 5 - Draw the Finished Affinity DiagramIssues in Implementing Continuous Process ImprovementBreaking through oldway “Dinosaur”thinkingSome people willnever chang eLack ofplanningDevelopingproduct withoutdeveloping processOrganizationalissuesLack of follow-upby managementOldmanagementcultureLack of TQLknowledgeCompetitionversuscooperationData collectionprocess needsEverybody needsto chang e but meWhich comes first,composing the team orstating the problem?Lack of training atall levelsPressure forsuccessNeed new datacollection systemNeed to becreativeDon’t know whatcustomer wantsToo busy tolearnWhat are the rewardsfor using toolsUnrealisticallotment oftimeBehaviormodifications maytake longer than timeavailableWant to solveproblem beforeclearly definedShort-term planningmentalityNot usingcollecteddataLack of trust inthe processAFFINITY DIA GRAMAFFINITY DIAGRAMLack of manag ementunderstanding ofneed for itToo manyprojects at onceVIEWGRA PH 911
Basic Tools for Process ImprovementREFERENCES:1. Brassard, M. (1989). The Memory Jogger Plus , pp. 17 - 39. Methuen, MA:Goal/QPC.2. Department of the Navy (November 1992). Fundamentals of Total QualityLeadership (Instructor Guide), pp. 6-64 - 6-67. San Diego, CA: Naval PersonnelResearch and Development Center.3. Department of the Navy (June 1994). Methods for Managing Quality (InstructorGuide), Module 2, Lesson 4, pp. 48 - 57. Washington, DC: OUSN Total QualityLeadership Office.4. King, R. (1989). Hoshin Planning, The Developmental Approach, pp. 4-2 - 4-5.Methuen, MA: Goal/QPC.12AFFINITY DIAGRAM
What Is an Affinity Diagram?VIEWGRAPH 1A tool that gathers large amounts oflanguage data (ideas, opinions,issues) and organizes them intogroupings based on their naturalrelationships.AFFINITY DIAGRAM
VIEWGRAPH 2When to Use the Affinity Process Sift through large volumes ofdata Encourage new patterns ofthinkingAFFINITY DIAGRAM
VIEWGRAPH 3Creating an Affinity DiagramStep 1 - Generate ideasStep 2 - Display ideasStep 3 - Sort ideas into groupsStep 4 - Create header cardsStep 5 - Draw finished diagramAFFINITY DIAGRAM
What Is a Header? Single card or post-it TM Phrase or sentence Clear meaningVIEWGRAPH 4An idea that captures the essentiallink among the ideas contained ina group of cards.AFFINITY DIAGRAM
Drawing the Finished SUPERHEADERIDEAIDEAVIEWGRAPH 5IDEAAFFINITY DIAGRAM
Step 2 - Display the IdeasPressure forsuccessWant to solveproblem beforeclearly definedNeed new datacollection systemDon’t know whatcustomer wantsShort-term planningmentalityCompetitionversuscooperationLack of managementunderstanding ofneed for itLack of training atall levelsNeed to becreativeSome people willnever changeDevelopingproduct withoutdeveloping processWhat are the rewardsfor using toolsLack of follow-upby managementVIEWGRAPH 6Too manyprojects at onceLack of trust inthe processNot usingcollecteddataUnrealisticallotment oftimeWhich comes first,composing the team orstating the problem?Issues in Implementing Continuous Process ImprovementData collectionprocess needsEverybody needsto change but meToo busy tolearnBehaviormodifications maytake longer than timeavailableAFFINITY DIAGRAM
Step 3 - Sort Ideas into Related GroupsCompetitionversuscooperationData collectionprocess needsIssues in Implementing Continuous Process ImprovementLack of follow-upby managementDevelopingproduct withoutdeveloping processNeed new datacollection systemSome people willnever changePressure forsuccessWhich comes first,composing the team orstating the problem?Too busy tolearnVIEWGRAPH 7Too manyprojects at onceNot usingcollecteddataLack of training atall levelsEverybody needsto change but meDon’t know whatcustomer wantsLack of managementunderstanding ofneed for itShort-term planningmentalityUnrealisticallotment oftimeNeed to becreativeWant to solveproblem beforeclearly definedWhat are the rewardsfor using toolsBehaviormodifications maytake longer than timeavailableLack of trust inthe processAFFINITY DIAGRAM
Step 4 - Create Header CardsLack ofplanning(Header GRAPH 8Lack of TQLknowledgeIssues in Implementing Continuous Process ImprovementBreaking through oldway “Dinosaur”thinkingAFFINITY DIAGRAM
Step 5 - Draw the Finished Affinity DiagramIssues in Implementing Continuous Process ImprovementLack ofplanningLack of follow-upby perationOldmanagementcultureData collectionprocess needsLack of TQLknowledgeBreaking through oldway “Dinosaur”thinkingDevelopingproduct withoutdeveloping processNeed new datacollection systemSome people willnever changePressure forsuccessWhich comes first,composing the team orstating the problem?Too busy tolearnVIEWGRAPH 9Too manyprojects at onceNot usingcollecteddataLack of training atall levelsEverybody needsto change but meDon’t know whatcustomer wantsLack of managementunderstanding ofneed for itShort-term planningmentalityUnrealisticallotment oftimeNeed to becreativeWant to solveproblem beforeclearly definedWhat are the rewardsfor using toolsBehaviormodifications maytake longer than timeavailableLack of trust inthe processAFFINITY DIAGRAM
(Viewgraph 3). This sequence has been adapted from the The Memory Jogger Plus [Ref. 1]. Step 1 - Generate ideas. Use the Brainstorming tool to generate a list of ideas. The rest of the steps in the Affinity process will be easier if these ideas are written on post-itsTM. Step 2 - Display the ideas. Post the ideas on a chartpack, a wall, or a .