Transcription
International Journal of Education in Mathematics, Science and TechnologyVolume 4, Number 3, 2016DOI:10.18404/ijemst.61686Mathematically Gifted High School Students’ Approaches to DevelopingVisual Proofs (VP) and Preliminary Ideas about VPIsikhan Ugurel, H. Sevgi Morali, Ozge Karahan, Burcak BozArticle InfoAbstractArticle HistoryThe purpose of this study is to describe the procedure and examples of visualproofs (VP-or proof without words) developed by gifted mathematics secondaryschool students after their experiences. The participants of this study are threemale 9th grade students enrolled in a private science high school. In the first stageof the research a briefing was given to the three selected students. Then, structureand examples of VPs are discussed by the participants. During this process theresearchers and participants met once a week for five weeks. The participantsdeveloped VP examples stage-by-stage. The qualitative research method wasused to analyze the data gathered from both the VPs developed by theparticipants and also from the participants‟ responses to a written questionnaire.According to analysis of the VPs, the examples were found to be in threecategories. Examples of each category are presented in the study and discussed,along with participants‟ thoughts about each of them.Received:11 June 2015Accepted:17 November 2015KeywordProofVisual proofProof without wordsMathematically giftedstudentModeling a proofIntroductionProof education has long been the focal point of comprehensive research studies in the literature of mathematicseducation, for more than 20 years (Chin & Lin, 2009; Hanna, 2008). The sheer volume of studies indicates theimportance of proof as one of the vital building blocks of school mathematics. Proof ensures makingmathematics, communicating in a mathematical way, and storing mathematical knowledge (Schoenfeld, 1994).According to Tall (1998), proof is the basis of mathematics. It is possible to put forward what proof is or what itmeans in various ways. Hanna, de Villiers, Arzarello, Dreyfus, Duran-Guerrier, Jahnke, Lin, Selden, Tall andYerdokimov (2009) state that proof has different meanings in today‟s professional area of mathematics. Nolt,Rohatyn and Varzi (1998) define proof as deriving results from hypotheses using generally valid rules ofinference. According to Knuth (2002b), a deductive argument shows why a statement is correct on the basis ofother mathematical results and/or introspections towards mathematical structures in the said statement. Nomatter under which circumstances it is dealt with, proof plays a crucial role in the structure and development ofmathematics (Hanna et al., 2009; Schoenfeld, 1994). A proof, in fact, is an important tool that encouragesunderstanding in its own right (Ball, Hoyles, Jahnke & Movshovits-Hadar, 2002). Proof may assist learners toperceive integrity of mathematics and to reach its meaning in the deepest respect; hence, it is important in termsof providing learners with the unchangeable fundamentals of mathematics (Waring, 2008). The proving processrequires several core skills such as supporting assumptions, reviewing given features or organizing logicaldeductions. Due to such skill requirements, many students experience problems in proving and with theprocesses of proving. Due to the increasing importance of proof in mathematics curricula, there have beenseveral studies conducted by mathematics educators that deal with problems experienced by students regardingproof (Smith, 2006). Studies generally conclude that students have some negativity about proof. According toSegal (1999), students consider mathematical proof difficult for a number of reasons. Ball et al., (2002) statesthat proof seems a meaningless ritual for many students. Students therefore need help to understand the proof inorder to remove such negative thoughts and feelings against the concept of proof. Understanding proof is animportant skill, not only for students having problem with proof as a process, but also for all learners. One of thefundamental ways of helping students in understanding proof and proving process is to have them contend witha proof. Hanna (2000) states that it should be achievable to make a definition and to follow all valid connectionsfor inductive reasoning in order for a student to be able to understand the proof, and claims that students shouldwork on proofs and create new proofs in order to acknowledge this.
Int J Educ Math Sci Technol175In addition to common approaches, it would be useful to make use of alternative approaches in understandingand creating proofs. Visualization is one such approach that may be used in order to understand proof as to helpmathematical understanding. Besides general proof methods, using visual elements in order to increase theawareness of students may be beneficial, both for attracting the attention of and for assisting students to makeconnections among subject matters and concepts. Just like other scientific disciplines, mathematics educationgives importance to demonstrations (Kadunz, 2006). It is generally accepted that visualization andexemplification play a vital role in mathematics (Casselman, 2000). For instance diagrams and charts playvarious roles in mathematical texts; if used properly, a diagram supports reasoning or may be considered asreasoning in itself (Maanen, 2006). From this perspective, combining visual elements with proof may assiststudents to get past any problems they may have about proofs; helping them to better understand.According to Borwein and Jörgenson (1997), visual reasoning generally plays a greater role in mathematics andsome visual representations can even constitute proofs. The discussion document of ICMI Study 19 (Hanna, etal., 2009) stated that verbal, visual or formal ways of proving may have an effect on understanding the proofsand learning about proofs in general. Hence, a review of studies conducted on visualization of mathematics andstudents‟ proof processes shows that there is a specific area that is called visual proof (or proof without words;PWW), embracing these two titles.Visual ProofsOne of the most renowned resources about visual proofs (VPs) is Roger B. Nelsen‟s 1993 book titled “ProofWithout Words: Exercises in Visual Thinking”. Nelsen defines nonverbal proofs in the introduction part asfollows:PWW are pictures or diagrams that help the observer see why a particular statement may be true, andalso to see how one might begin to go about proving it true. In some, an equation or two may appear inorder to guide the observer in this process. But the emphasis is clearly on providing visual clues to theobserver to stimulate mathematical thought (Nelsen, 1993: p.VI).Maanen (2006) describes VP as being comprised of a series of drawings that encourage thinking. Similar to thefirst definition, Alsina and Nelsen (2010) define nonverbal proofs as pictures and diagrams that show why amathematical statement is true, and that help to assist in starting to prove its trueness. In the introduction part ofhis book, Nelsen (1993) states that VPs first emerged as a look-see diagram in Martin Gardner‟s column inScientific American in 1973, and then been published regularly in Mathematics Magazine and The CollegeMathematics Journal in 1975. Gardner sets forth that proof may generally be supported simply and correctly bya geometrical analogue, and that it is possible to see the trueness of a proof at a single glance (cited in Nelsen,1993). According to Maanen (2006), on the other hand, the first source with nonverbal proofs is the geometrybook of an unbeknown author named Sybrandt Hansz Cardinael, estimated to be published in 1612. The originaltitle of this Dutch writer‟s book is Hondert Geometrische Questien Met Hare Solutien. Maanen (2006) statedthat Cardinael did not make any mathematical explanation besides visual elements in the proof, and exemplifiedit with the proof of the Pythagoras theorem. It was also stated that Cardinael provided nonverbal proofs not onlyrelated to geometry, but also to arithmetic. Bell (2011) also gives an example of the proof of PythagoreanTheorem drawings found in one of the oldest Chinese textbooks, titled “Arithmetic Classic of Gnomon and theCircular Paths of Heaven” (ca.300 BCE), and which was shaped into the last version of root calculation(Vijaganita) by the Indian mathematician Bhaskara (1114-85 CE).VPs can be created using dots, squares, spheres, cubes and other similar easy and simple drawing tools. VPsmay be used to prove theorems in geometry, number theory, trigonometry, analysis, inequalities, and other areasof mathematics (Alsina & Nelsen, 2010). Hence, visual elements are not only used to understand theorem andproof, but also to attract attention to the approach of the proof, as well as to ensure the proof for a long time(Hanna & Sidoli, 2007). From this perspective, compared to other traditional approaches to proof, nonverbalproofs allow for clear understanding of and reason about mathematical concepts (Waring, 2008).There are few in-classroom studies about VPs in the literature (particularly in Turkey), yet it is similarly hard tofind studies including analysis based on participant performance or instructional practices in Turkey. Hence,Maanen (2006) also pointed out the importance and necessity for more studies on VP. It is seen that studies onVP generally includes basic information of the subject matter as well as some historical or unique examples(e.g. Alsina & Nelson, 2010; Maanen, 2006; Casselman, 2000; Siu, 1993). Nonetheless, although limited, thereare studies approaching the phenomenon from an instructional perspective. For instance Flores (1992) presents
176 Ugurel, Morali, Karahan & BozzgeVP samples used in his „problem solving and proof‟ classes. He uses VPs as an alternative approach formathematical induction, and emphasizes the practicality of VPs for students to understand why mathematicalreasoning formulas are true: “These diagrams have the advantage of being proofs that explain, giving studentssome insight into how these formulas can be derived ” (p.394). Despite not having conducted a classroomapplication, Knuth (2002a) uses VP to present examples of explanatory proof (that explains why a statement istrue), which is one of the fundamental functions of proofs from an educational perspective. Describing the roleof proofs based on such visual models as “fostering understanding of the underlying mathematics” (p.487),Knuth emphasizes that these models can help teachers create more functional learning environments forteaching proofs within the frame of reform movements in mathematics education. Another study that providessignificant data parallel to our objective in instructional terms was conducted by Bardelle (2009). This is a studyon the use of VPs in mathematics education where Bardelle studied with 13 mathematics students at highereducation level in Italy and gave them two tasks including VPs (Pythagoras theorem and Geometric Series). Theresearcher then wanted the participants, who were unfamiliar with such visual proofs, to describe them andreviewed their responses. It was seen that the participants were not able to succeed in understanding, describingand reconstructing the proof. In another study, Bell (2011), also a mathematics teacher, used VP in herclassroom through online class discussion. She claimed that use of technology encouraged class discussionsabout VP and also allowed for peer learning, and helped to improve students‟ written communication ofmathematical ideas. On the other hand, Dickerson and Doerr (2015) tried to understand mathematics teachers‟perception on proof in mathematics classes. The researchers concluded that the more experienced teacherssatisfied by less formal arguments and proof based on concrete or visual features (VP), whereas less experiencedones stressed the importance of details in proof writing and standard language.A review of Turkish literature on mathematics education found only one research study based on theinstructional application of VPs. Doruk, Kıymaz and Horzum (2012) conducted a study with 32 pre-serviceteachers at a school of education to develop a concrete, visual model for (a b) 3 a3 3a2b 3ab2 b3 identity andfor constructing a proof accordingly. The study concluded that the participants provided positive views, andwere successful in constructing the proof for the given identity as well as understanding it. The authorsrecommended to conduct similar studies on visualization of proofs and using concrete models.In the rich literature on proof and proving, there are many studies on visual proof and examples of its use, hence,there is a general tendency for interest in VPs (Bardelle, 2009). However, it has been observed that there areinsufficient studies on the role and function of VPs in proof education or on classroom applications or otherinstructional activities related to understanding and creating VPs. There is a need for more research in this area.This study aims to contribute to fill the gap in this area of instructional applications by describing the examplesdeveloped by mathematically gifted secondary education students following a short experience with VPs, and atdetermining their general thoughts towards VPs. The research question in this study is therefore: “What is thestructure of VP examples developed by mathematically gifted secondary education students, and what are theirthoughts about VPs in this regard?”MethodThis study is a descriptive qualitative research. Descriptive qualitative research design helps to understand theconcept investigated throughout the study in detail.ParticipantsThree 9th grade male students are the participants of the study who are all enrolled at a Science High School in ametropolitan city of western Turkey. The reason for choosing a science high school is the teaching of proofs atthis type of high school. According to the researchers‟ experiences and observations, apart from some AnatolianHigh Schools and Science High Schools, other high schools only cover proof in their geometry courses or alimited version of proofs on mathematics courses. According to researchers, the most important reason for thispicture is the exams held in the country and the national university entrance exam which involves only a fewproof-related questions. In addition, the other important reason is that the way of serving the proof and prooftechniques in previous curricula. However, as a result of the aim of the Science High Schools‟ foundation andthe teaching principles of these schools, the value and place of the proofs and proving in mathematics curriculaare relatively more prominent. Because of this, the researchers thought it would be more useful for the VPresearch to work with Science High Schools students who have experiences with proof and proof concept. Sixstudents were selected as candidate participants for the research, according to the math and geometry teachers‟
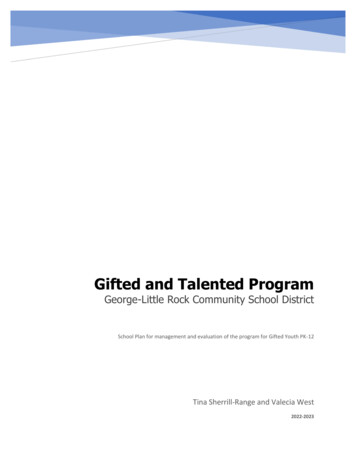
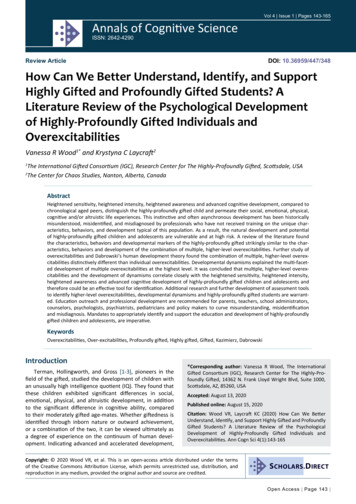
Int J Educ Math Sci Technol177opinions among the high achievers who volunteered for the study. During the selection procedure, one-to-oneinterviews were conducted and some explanations given about the study. In the interviews, participants wereasked about their thoughts on proofs. In doing this, the aim was not to construct formal conclusions about proof,but just to obtain some views about the thought patterns of the participants in order to help select participantswho are both keen to take part in the research study and who possess the most knowledge about proofs. Theparticipants were given pseudonyms as Burak, Mustafa and Erdem. These students are high achievers both intheir mathematics and geometry courses and all received scholarships from the school which is a private school.During selection of the participants, the following criteria were considered; that they all volunteered for thestudy, received very high scores from their geometry and mathematics courses and have not seen VPs before.Data HandlingIn the first part of the study, a three hour briefing is given about VPs to the three selected students at the end ofthe spring semester. After a short introduction, the researchers and students discussed the structure of VPs andsome examples. Discussions were conducted as out-of-class activities in a separate classroom. Three studentsand two researchers agreed on a specific time for this joint study. Researchers kept direct information provisionat a minimum level in these sessions, and preferred to mostly apply question-answer technique to discuss thestructure of the VPs, whether this structure could be changed, how the VPs could be produced, whether thevisual models were understandable easily by the students. This process was conducted in two one-and-half-hoursessions in a day. Later, the 10 VP examples selected from the literature are given to students to study themoutside of school. It is considered that the selected examples are not complex, but that they are different to eachother, and suitable for the participants‟ level of understanding.Students were asked to study on 10 VPs individually. After they completed the individual studies, they wereallowed to share their ideas with each other if they wished. Above figure shows four examples among 10 VPsgiven to the students. The other VP examples involved the following mathematical statements: 5th statement: Pythogorean Theorem (a2 b2 c2) [Nelsen, 1993:7]6th statement: a2-b2 (a-b).(a b) [Tall, 1995:6]7th statement: n2-1 4.((n-1)/2)).((n 1)/2)) [Landauer, 1985:203]8th statement: The area of a triangle equals the product of its semi-perimeter and the radius of theinscribed circle. [Alsina & Nelsen, 2006:110]9th statement: 1/4 (1/4)2 (1/4)3 1/3 [Alsina & Nelson, 2006:74].10th statement: 3.(12 22 32 n2) (2n 1).(1 2 3 n) [Nelsen, 1993:78]
178 Ugurel, Morali, Karahan & BozzgeWhile studying with 10 VPs, additional clarifications were needed only for the 3rd and the 8th statements(measurement of the angle seeing the diameter and the concept of semi-perimeter) for students to recall thesubject, and other statements did not require any explanation or clarification. Over the following week, the threeparticipants and the first author gathered to discuss the 10 VPs through visual modeling of the proofs. In thissession, students‟ procedures of constructing the meaning of VPs are considered and for some examples, thegroup worked together to construct the meaning and modeling of VPs. In the next step, they were asked toconstruct their own VP either working by themselves or together. During this time, the two authors and theparticipants met once a week for five weeks to discuss the examples produced by the participants. Thesesessions were conducted in a high school out of the school time. This process helped students to share theiropinion with the other participants and the researchers. The participants were allowed to criticize the others‟VPs as well. On the other hand, the researchers participated passively (listening, observing, asking shortquestions just to trigger discussion) in the procedure. They did not make any subjective comments on theconstructed VPs like „true‟, „not true‟ or „very good‟. During the last week of the study, participants gave theirfinal shape of the constructed VPs and they finished off the visual models by using a virtual tool. Right after thisprocedure, participants were given 40 minutes and asked to fill out a five question written form about theiropinion on VP. The VP examples and written interview forms represent the data of this study.The ProcessAt the beginning of the study, in the first session in which the researchers and participants worked together, it isrealized that the participants had no idea about VPs and had not seen any examples before. The very firstreaction of the participants about VPs is that they are very different from the usual proofs. The researchersexplained that the VPs are not formal proof techniques - in the literature, some researchers accepted them asproofs on some levels or the alternative tools to help understand the proofs. After this explanation, theparticipants concentrated on not only examining the VPs, but also to discover them. In the second week, theparticipants‟ interests increased readily and the adaptation of working on VPs was obtained. This progress wasbeyond the researchers expectations. During the process of investigating the 10 given VP examples, theparticipants became interrogative and worked in cooperation with each other; making their work veryproductive. One of the indicators of this situation was that the participants were very eager to develop their ownVPs and they created a competitive environment. The other indicator is that although the researchers did notmake any manipulation or restriction during the developing of a model until the fourth week, the participantsstated their own requests. The first request was for some resources about inequalities, identities and formulasthat could not be found in the school textbooks, or from their school mathematics. After this request, theresearchers made a list and presented it to the participants. The participants were free to select any of them andcreate visualizations of them. Although a list was prepared for the participants, it was mentioned that they werenot restricted to just that list, and that they could pick any mathematical statement to visualize. The other requestfrom the participants was the use of computer software rather than paper-pencil for modeling the VPs. Theparticipants were told that they could use MS PowerPoint and Flash programs. All three participants werecapable of using MS PowerPoint efficiently and one of them could also use Flash. After accepting their request,they transported their drafts across to the virtual environment in a very short time.Although Mustafa worked individually most of the time during the developing of the VPs, Burak and Erdemworked together, as was observed during the discussion sessions where they were interacting with each other.By the third week of the study, discussion about whether the VP developed on the suggestion of the first authorcan be categorized is considered by the participants and the researchers together. After this discussion, all theVPs were reexamined and the researchers agreed that the developed visual proofs could be categorized intothree types. After this, the participants were told about the categories, which they agreed, and then theyreorganized their developed VPs and also produced new VPs according to these categories. Before this point,the participants already had models in each category, developed from their own desires knowledge. After thecategories were set, VPs continued to be developed by the participants based on their own wishes andknowledge, however, now there was a general framework and some boundaries of categorization set for thedeveloping of VPs.The first category involved the unrestricted VP models produced at the beginning or middle of the study; theparticipants had developed proofs without words to different mathematical statements. The second category inthe visual models were developed more than once and different to each other for one given mathematicalstatement. The examples from the third category represent VPs that show mathematical statement of a visualgeneralization. According to the literature, examples from the third category are seen infrequently, and because
Int J Educ Math Sci Technol179of this, these examples could be accepted as more authentic (original). The examples from the second and thirdcategories were developed from the middle to the end of the study.Data AnalysisLiterature indicates no accepted framework or coding system for analysis of VPs. A study of Borwein andJörgenson (2001) is the only study, which roughly mentions an investigation system/criteria that could be usefulwhile examining VPs. Here, the researchers discuss there are three requirements to accept a visual proof: 1reliability, 2-consistency, and 3-repeatability (Borwein & Jörgenson, 2001).“Reliability [is] the underlying means of arriving at the proof are reliable and that the results isunvarying with each inspection. Consistency [is] the means and end of the proof are consistent withother known facts, beliefs, and proof. Repeatability [is] the proof may be confirmed by or demonstratedto others (p.899)”.On the other hand, Hanna and Sidoli (2007) claim that these criteria cannot be completely applicable either tovisual proof or to proof in general. It is particularly due to the „reliability‟ criteria, which is not expressed clearenough to show or decide whether a visual proof is reliable or not (Hanna & Sidoli, 2007; Hanna, 2000).Therefore, since there is no valid framework to analyze VPs and the only existing study (Borwein & Jörgenson,2001) is criticized in some respects, the authors have decided to produce their own coding system. Theresearchers examined the proofs together at the beginning. After that, each researcher examined the participants‟examples based on two criteria: “reasoning involved” and “appropriate visual models”. Based on the findingsfrom these examination, it was decided to use two codes to evaluate VPs: “correction of the model” and “visualstructure”. By using these codes, three authors analyzed each VPs individually, and then compared the assignedcodes.Table 1. The System of Coding and Scoring of analyzing VPsCode-1. Correctness of the ModelCode-2. Structure of the ModelVisual correctnessUnderstandabilityNumerical correctnessFollowing the step(Score: 1)(Score: 1)- Most or all of the steps are wrong. - Steps are not clear and understandable.-The most of the visual transition cannotbe followed.(Score: 2)(Score: 2)- Steps are true in sofar.- Steps are understandable in so far.- Some of the steps are true.- A certain amount of steps areunderstandable.- In some points of visual transitionscannot be followed.(Score: 3)(Score: 3)- All steps are true.- All steps are understandable and visualtransitions can be followed.During the analysis, each developed VP was labeled as “insufficient”, “acceptable” or “sufficient”. The scoreand labels given under two codes of the each VPs are given in Table 2. The researchers met to compare codesand analysis. The examination was completed when the researchers agreed on the analysis conducted on the VPsbased on the agreed criteria. During this process, two of the VPs were eliminated from the study because theywere incomplete. One of the examples selected for the study had some problems for conducting an appropriatevisual model, however, it was decided that this example should remain in the study because it shows thestudents‟ thought processes and approach to visual e 2. The codes and labels used in VPs‟ cient insufficient acceptable acceptable acceptableScore33sufficient
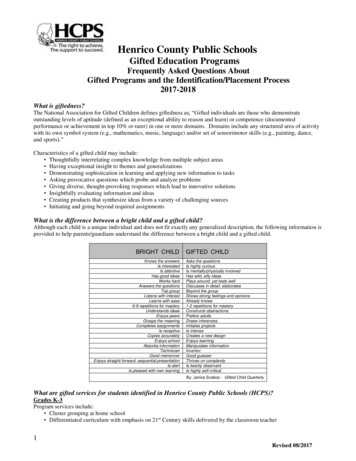
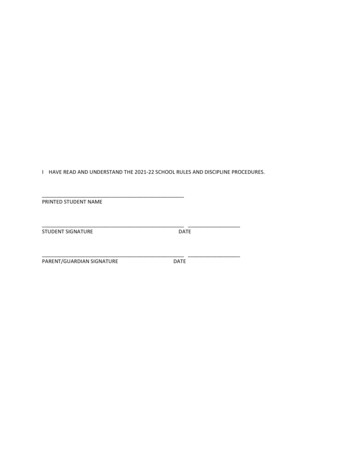
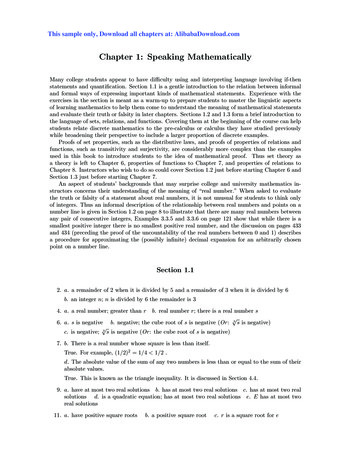
180 Ugurel, Morali, Karahan & BozzgeResultsIt should be underlined that most of the VPs developed by the participants are considered by the researchers tobe successful (sufficient & acceptable). After researchers‟ individual examinations, the intercoder reliability wascalculated as 80%, obtained from the codes, excluding the two eliminated and one mismodeled VPs. In thischapter, the VPs from the three categories previously mentioned are described and the results from theparticipants‟ written expressions are presented. The VPs developed by the participants are presented inprogressive 2-4 steps so that the participants‟ reasoning processes can be observed in detail.First CategoryThis category involves the very initial proofs of the students, obtained right after they started to produce VPs. Inthe first category, there are six different VPs constructed as shown below:(VP-1). Mathematical statement: a² b² c² (Pythagorean Theorem)Figure 1. [C1.VP-1: Category 1, Visual Proof 1]The first proof was developed by Erdem. He constructed a visual model of Pythagorean Theorem. He started toconstruct three squares for each sides of the right triangle. Then he showed the proof of the theorem by dividingeach square on the sides of the right triangle appropriately to place them into the big square lying on the c side.After placing two squares with side a (green square) and side b (yellow square) into the other square with side c,there occurred an area that intersected those two squares. Erdem accepted that this area was the same with thearea which was located in the square with side c, and also located outside of the other two squares with side aand b; so, he revealed that the sum of the area of squares with sides a and b was equal to the area of the squarewith side c. The process is shown in Figure-2.Figure 2. C1.VP-1 Equality of areaIt is possible to see the correctness of the visual model by using a Dynamic Mathematics Software likeGeoGebra and/or by using squared paper for the squares constructed by different a, b, c values (the areasnumbered with 1, 2, 3, and 4 in Figure-2) (see Appendix-1). In drawings that use squared or scaled papers,where sides of right triangles are taken as 3-4-5 or 6-8-10, the constructed model would be as seen in Figure-1.However, when sides of the right triangle are taken as 7-24-25, areas numbered 1 and 2 are produced as samebut areas numbered 3 and 4 become different than shown in the Figure-2 (see Appendix-1). This is not aproblem for the correctness of the visual proof, but considered as a limitation for the visual model. On the other
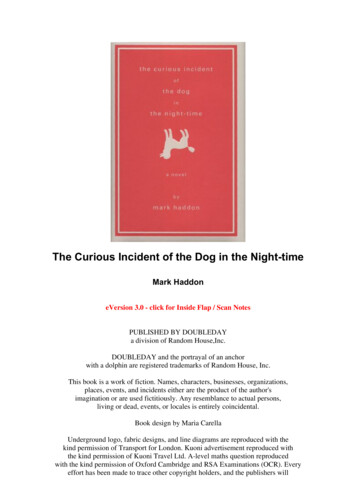
Int J Educ Math Sci Technol181hand, in Erdem‟s model, squares and intersection areas are colored so as to help to follow and improve thevisual model. From this point of view, this VP-1 is given three points from Code-1, and 2 points from Code-2;and it is labeled as acceptable.(VP-2). Mathematical statement: a(x a)(x b) x 2 (a b)x abFigure 3. [C1.VP-2]In this
students‟ proof processes shows that there is a specific area that is called visual proof (or proof without words; PWW), embracing these two titles. Visual Proofs One of the most renowned resources about visual proofs (VPs) is Roger B. Nelsen‟s 1993 book titled "Proof Without Words: Exercises in Visual Thinking".