Transcription
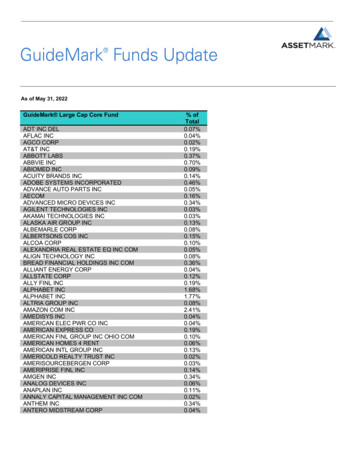
Robert Dunn Michael WollebenTFI International (TSE: TFII) is a diversified transportationprovider operating four distinct business segments: (1) Truckload(40% of 2016 sales and 47% of EBITDA); (2) Package & Courier(34% of sales and 31% of EBITDA); (3) Less-than-Truckload(20% of sales and 16% of EBITDA); and (4) Logistics (6% of 2016sales and EBITDA).In December 2016, TFII acquired Contract Freighters Inc. (CFI),a U.S. truckload business divested by XPO Logistics (XPO)following its purchase of Con-way (CNW) in September 2015. Inthe near term, the transaction opens the door for TFII to seek aU.S.-based listing for its stock. As well, the increased scalepresents a range of potential options for its Truckload division,including a spin-off as a standalone or a merger with a strategicplayer, which we estimate could unlock value for shareholders.Additionally, the asset-light Package & Courier and non-assetbased Logistics divisions appear undervalued in the currentcorporate structure and could be sources of additional optionality.By our calculation, at less than 7x 2018E EV/EBITDA and a 12.5% free cash flow yield, TFII trades at a discount to the sumvalue of its parts. Considering financial commentary as well aspeer and M&A valuations, value of 28 per share, 16 per share, 5 per share, and 4 per share can be assigned to TFII’s TL, P&C,LTL, and Logistics businesses. Accounting for corporate costsand projected net debt of 17 per share yields a sum-of-theparts value of roughly 36 per share, implying 35% upsidepotential.Future potential catalysts include a U.S.-based stock listing forTFII, the separation of its TL business, the monetization of theP&C and/or Logistics divisions, earnings leverage to improvedindustry fundamentals, additional acquisitions and/or sharerepurchases. Potential risks include integration issues, a lack ofexecution, accident liability, currency fluctuations, labor issuesand pricing pressure due to deteriorating industry fundamentals.TFI International Inc.(TSE: TFII)Price (6/16/2017) 26.64/shareMarket capitalization 2.4BTruckload (TL): 28/sharePackage & Courier (P&C): 16/shareLess-than-Truckload (LTL): 5/shareLogistics: 4/shareCorporate/Net Debt:( 17/share)SOTP: 36 per share**SOTP may not add due to rounding; allfigures in CAD unless otherwise notedNOTE: This publication could beconsidered as advocating for corporaterestructurings. Authors select companiesfor this report based on the potential fora future value-unlocking transaction. Inmany cases, these companies have orcould come under activist investorpressure, media scrutiny, or generalmarket speculation that a spin-off orasset sale is possible.PCS Research Services100 Wall Street, 20th FloorNew York, NY 10005(212) 233-0100www.pcsresearchservices.comInstitutional Research Group, LLC (“IRG”) is the author of this report. PCS Research Services (“PCS”) is the exclusive marketer and anauthorized distributor of this and other research reports created by IRG. IRG and PCS are affiliates. IRG, PCS and each of their respectiveemployees and affiliates may have positions in the securities of companies mentioned herein. This report is based on informationavailable to the public, and no representation is made with regard to its accuracy or completeness. This document is neither an offer nor asolicitation to buy or sell securities. All expressions of opinion reflect judgment at the date set forth above and are subject to change. Allviews expressed in this research report accurately reflect the research analysts’ opinion about the subject matter contained herein. Nopart of the research analysts’ compensation was, is, or will be, directly or indirectly, related to the specific recommendations or viewsexpressed in the research report. Reproduction of this report is strictly prohibited. Institutional Research Group, LLC 2017.
HIDDEN OPPORTUNITIES“Valuing possible breakups by providing sum-of-the-parts analysis.”The BackgroundTFI International (TSE: TFII; OTCQX: TFIFF), based in Montreal, Quebec, has origins datingback to 1957 and was known as Cabano until 1992 when it acquired LTL-carrier Kingsway andwas renamed Cabano-Kingsway. In 1996, a new management team, led by current CEO AlainBédard, began implementing an acquisition-focused growth strategy. In 1999, the companychanged its name to TransForce. In February 2016, the company completed the sale of its wastemanagement business to GFL Environmental for 800 million (or 10x 2016 EBITDA). InDecember 2016, the company increased its U.S. exposure via the acquisition of ContractFreighters (CFI) and adopted the current corporate moniker. Today, TFII operates four distinctbusiness segments (see Background #1): (1) Truckload (40% of 2016 sales and 47% of EBITDA);(2) Package & Courier (34% of sales and 31% of EBITDA); (3) Less-than-Truckload (20% of salesand 16% of EBITDA); and (4) Logistics (6% of 2016 sales and EBITDA).Background #1 TFI International: Selected Financial Items, 2014-2018E(C in millions)2014201520162017E2018E 1,303.8 1,347.8 1,399.7 1,434.7 1,492.1 910.8 882.9 808.8 901.8 910.8Truckload 1,062.4 1,614.2 1,632.4 2,211.9 2,267.2Logistics 182.4 254.2 241.1 289.4 296.6Total revenue:Package & CourierLess-than-truckloadEliminations( 70.3)( 69.3)( 56.8)( 14.1)( 14.1) 3,389.1 4,029.9 4,025.2 4,823.7 4,952.6Package & Courier 91.2 90.2 116.8 134.1 139.5Less-than-truckload 61.1 45.8 48.3 58.8 59.4Truckload 86.9 134.1 105.7 88.6 131.2TotalAdj. operating income:Logistics 16.9 27.9 23.4 26.9 27.6Corporate( 28.4)( 21.4)( 35.9)( 40.0)( 40.0) 227.6 276.5 258.2 268.5 317.7Package & Courier 126.6 124.0 151.3 170.0 176.8Less-than-truckload 94.2 77.2 77.0 90.0 90.9Truckload 135.5 239.5 229.5 289.9 344.3Logistics 20.0 31.4 27.3 32.7 33.5TotalAdj. EBITDA:Corporate( 27.0)( 19.5)( 33.8)( 37.5)( 37.5) 349.3 452.7 451.3 545.1 608.0Package & Courier 19.4 16.6 11.2 13.4 14.0Less-than-truckload( 48.8) 5.0 5.4 5.9 5.9Truckload 13.8 53.9 35.2 128.0 131.2Logistics( 0.2)( 11.1)( 3.8) 0.3 0.3Corporate 0.9 2.9 1.5 2.0 2.5( 14.9) 67.3 49.6 149.5 153.8TotalCapital expenditures, netTotalSource: Company reports, Bloomberg, and Institutional Research Group estimates.Page 2
HIDDEN OPPORTUNITIES“Valuing possible breakups by providing sum-of-the-parts analysis.”For context on the following discussion, TFII’s stock has sold off roughly 25% from its post-CFIannouncement highs after management reduced its initial 2017 guidance by about 7.5% to 550- 560 million (from 600 million; see Background #2) on the 1Q 2017 conference call.Free cash flow guidance was also reduced to 275 million (from 300 million). Managementindicated that its guidance reduction was largely driven by a weak fundamental backdrop in itsU.S. TL business, which, along with the wider domestic truckload shipping industry, has beenslower to improve than most observers/investors have anticipated (a dynamic that will bediscussed in more detail below). Still, current year guidance, at the midpoint, implies a 7.5x2017E EV/EBITDA multiple and a free cash flow yield of 11%, which is a level from which we seeupside potential (both from TFII’s varied transactional optionality as well as from prospectiveimprovements in underlying fundamentals). Based on our 2018 forecasts, TFII trades at lessthan 7x 2018E EV/EBITDA and with a free cash flow yield of 12.5%.Background #2 TFI International: 2017 Guidance(C and US in millions)Total adj. EBITDACFI adj. EBITDAInitialCurrent 600 million 550 - 560 millionUS 115 millionUS 85 - 95 millionImplied purchase priceFree cash flowSource: Company reports.4.9x6.2x 300 million 275 millionOn a consolidated basis, TFII is among the 10 largest for-hire transportation providers in NorthAmerica, with a network of 404 terminals (89 owned & 315 leased) and a fleet of nearly 18,000tractors (8,000 owned & 10,000 operated by independent contractors) and 25,000 trailers. Itoperates with a relatively decentralized (and asset-light) business model and is generally welldiversified, in terms of both industry and geographic exposure (see Background #3).Background #3 TFI International: Diversification By Industry and GeographyBy industryBy Manufactured Goods12%MexicoAutomotive8%TotalServices7%Food & Beverage6%Forest Products5%Energy5%Building Materials4%Metals & Mining3%Chemicals & Explosives3%Maritime Containers2%Other3%Total100%0.8%100.0%Source: Company reports.Page 3
HIDDEN OPPORTUNITIES“Valuing possible breakups by providing sum-of-the-parts analysis.”Truckload (TL)The TL segment, which accounted for 40% of sales and 47% of EBITDA in 2016, provides bothconventional dry-van and specialized services, including flatbed, tank, and dump truckdeliveries, in Canada, the U.S. and Mexico. For context, truckload shipping is the primary modeof freight transportation in North America and involves the movement of a full truckload offreight (typically more than 10,000 lbs.) for a single customer on a point-to-point basis. The TLbusiness was built via a series of acquisitions (see Background #4), including Contrans andTransport America (TCA) in 2014, and, more recently, the purchase of XPO Logistics’ (NYSE:XPO) U.S. truckload business for US 558 million (or 6.2x EV/EBITDA) in October 2016.For some context on the most recent deal, the acquired business was brought under the XPOumbrella when in October 2015 it purchased Con-way (formerly NYSE: CNW), a diversifiedtransportation provider that was itself the subject of a Hidden Opportunities report datedNovember 2014, for 3 billion (0r 5.7x EV/EBITDA). Prior to its purchase by Con-way for 751million (or 7.6x EV/EBITDA) in September 2007, the business historically operated as ContractFreighters Inc. (CFI), which is the moniker that will be re-assumed by TFII. CFI has a crossborder concentration within the so-called NAFTA corridor (i.e., the U.S., Canada and Mexico)via a network of 29 terminals and a fleet of about 3,000 tractors (2,500 owned) and 7,500trailers (7,000 owned). The deal, which brought in US 530 million of revenue and US 90million of EBITDA, accomplished two strategic goals for TFII, namely increased scale in itsTruckload business and an increased presence in the U.S. Consistent with TFII’s decentralizedstrategy, the business will continue to be run by Timothy Staroba and operate as a standaloneentity out of its headquarters in Joplin, MO (although TFII plans to increase CFI’s use ofindependent contractors to 35% from roughly 20% in an effort to mirror its Canadian TLbusiness over the next 12-18 months.)Background #4 TFI International: Truckload Segment, Selected M&A(C and US in RevenueEBITDA EV/EBITDA EV/SalesOct-16XPO Logistics (CFI)N.A. TruckloadUS 558US 530US 90Dec-14Contrans Group (CSS)Flatbed 580 572-Jul-14Transport AmericaDry-vanUS 310US 350-Average6.2x1.1x1.0x-0.9x6.2x1.0xSource: Company reports, Bloomberg, and Institutional Research Group estimates.In 2016, TL segment revenue, excluding fuel surcharges, increased 3.5% to 1.5 billion, asvolume declines were offset by the October 2016 acquisition of CFI and by currency. (Excludingacquisitions, revenue declined 7%, despite a 30% rise in the e-commerce business to 115.7million.) Adjusted operating income declined 21% to 106 million, as pressure on freight ratesin both the U.S. and Canada drove negative fixed-cost leverage within the segment’s more assetheavy operating model, driving a 120-basis-point deterioration in the operating margin to 7.1%.Adjusted EBITDA declined just 4% to 229.5 million, in part due to higher D&A expense at CFI(see Background #5).Page 4
HIDDEN OPPORTUNITIES“Valuing possible breakups by providing sum-of-the-parts analysis.”In 1Q 2017, segment sales, ex-fuel, jumped 44% to 487 million, wholly driven by the CFIacquisition; excluding acquisitions, revenue was down about 1%, driven by volume and ratepressure as well as by currency. Adjusted operating income declined 28% to 15 million, as theoperating margin deteriorated 300 basis points to 3% amid ongoing rate pressure and elevatedintegration costs, which were 7.5 million. (Excluding acquisitions, the operating marginwould have actually improved 10 basis points to 6.1%.) Adjusted EBITDA increased 32% to 64million (see Background #5). As mentioned earlier, it was pressure on results in the Truckloadsegment, particularly the U.S. operation (i.e., TCA and CFI), that prompted TFII to reduce itsconsolidated guidance following 1Q 2017. TFII indicated the expectation that CFI wouldgenerate US 85- 95 million of EBITDA in 2017 (down from the initial expectation of 115million), as it expected that industry fundamentals in the TL sector would remain weakthroughout 2017 (versus the prior expectation for some modest improvement in 2H 2017). Thatsaid, management expects fundamentals to improve (i.e., supply and demand to tighten) in2018 and still thinks that on a more normalized basis the earnings power of the CFI businessremains in the US 100- 125 million range.Background #5 TFI International: TL Segment, Selected Financial Items (2014-2018E)(C in millions)3 mos.3 mos.201420152016201620172017E2018ETotal revenue 1,062.4 1,614.2 1,632.4 366.9 546.4 2,211.9 2,267.2Fuel surcharge( 151.5)( 175.0)( 143.2)( 29.2)( 59.9)( 243.3)( 249.4)Revenue 910.8 1,439.2 1,489.2 337.7 486.6 1,968.6 2,017.8Adj. operating income 86.9 134.1 105.7 20.4 14.7 88.6 131.2Depreciation of PP&E 40.0 84.4 97.7 21.9 41.7 171.4 181.4Amortization of intangibles 8.6 21.1 26.1 6.1 7.4 29.9 31.7 135.5 239.5 229.5 48.4 63.7 289.9 344.3EBIT margin, ex-fuel9.5%9.3%7.1%6.0%3.0%4.5%6.5%EBITDA margin, ex-fuel14.9%16.6%15.4%14.3%13.1%14.7%17.1%EBIT margin, total8.2%8.3%6.5%5.6%2.7%4.0%5.8%EBITDA margin, total12.8%14.8%14.1%13.2%11.7%13.1%15.2% 128.0 131.2Adjusted EBITDACapital expenditures, net 13.8 53.9 35.2 7.3 17.7Source: Company reports, Bloomberg, and Institutional Research Group estimates.It is worth noting the current weakness in the U.S. for-hire truckload market, which is large (i.e., US 400 billion-plus) and highly fragmented, with the top 25 carriers controlling less than 10%of the market. Clearly, results of transportation providers are “cyclical,” but perhaps the mostrelevant “cycle” for investors to consider is the so-called pricing or supply/demand cycle (asopposed to the interest rate cycle or even the broader economic cycle), which is to say that a 1%increase in price (or the rate per mile or ton) is far more profitable for a trucker than aPage 5
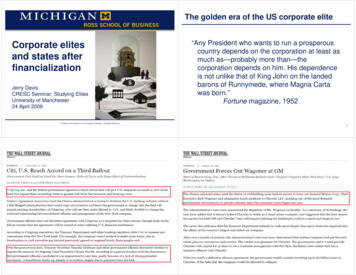
HIDDEN OPPORTUNITIES“Valuing possible breakups by providing sum-of-the-parts analysis.”corresponding increase in volume. As such, economic expansion, in and of itself, is not generallysufficient to drive outperformance for trucking stocks; rather, the industry does best duringperiods when aggregate demand exceeds overall capacity, to the benefit of the industry’s pricingpower.In that context, despite sustained (albeit tepid) expansion in freight demand, as measured by theAmerican Trucking Association’s (ATA) Truck Tonnage Index (see Background #6), over the lastseveral years the financial results of U.S. truckload carriers, including shippers such asHeartland Express (NASDAQ: HTLD), JB Hunt (NASDAQ: JBHT), the recently IPO’d SchneiderNational (NYSE: SNDR), and Werner Enterprises (NASDAQ: WERN), as well as SwiftTransportation (NYSE: SWFT), which is in the process of merging with Knight Transportation(NYSE: KNX), have been relatively underwhelming (as indicated by the fact that the group’sstock prices are broadly below where they were at the beginning of 2015 despite a near 20% gainthe S&P 500).Background #6 American Trucking Association’s (ATA) Truck Tonnage IndexSource: ATA.While we think industry fundamentals are likely to remain tepid through the remainder of 2017,we discern several factors, including expanding government regulations (e.g., HOS, ELD, andCSA) as well as rising equipment costs, tighter access to credit and a finite supply of qualifieddrivers, that are likely to reduce overall industry capacity (or at the very least stymie anysignificant expansion). As such, it seems reasonable to assume that, in the context of a modestlyexpanding economy (i.e., low-single-digit GDP growth), industry pricing should improve in2018-2019. The near-term event that is perhaps likely to have the greatest impact on theindustry’s supply/demand balance is the impending mandate requiring commercial truckingfleets to install electronic logging devices (ELDs) by December 18, 2017. For context, inDecember 2015 the Federal Motor Carrier Safety Administration (FMCSA) issued its final ruleon electronic logging devices, which required commercial trucking fleets to implement the newPage 6
HIDDEN OPPORTUNITIES“Valuing possible breakups by providing sum-of-the-parts analysis.”technology by December 2017. ELDs replace manual paper logs to automatically record adriver’s on-duty hours/mileage to ensure compliance with federal Hours of Service (HOS)requirements, which are a by-product of the Comprehensive Safety Analysis (CSA) of 2010 and,among other things, limit the amount of consecutive time a commercial truck driver can operatea vehicle, with the goal of reducing fatigue-related highway accidents.In the context of a fragmented industry with thousands of marginally profitable players, the costof the implementation of this mandate, which the FMCSA estimates will cost about 495 pertruck per year as well as the negative impact on asset utilization, which precedent suggests couldbe in the 3%-5% range, is expected to reduce overall industry capacity; in fact, we have seenestimates predicting that industry capacity could be reduced by 4%-14%. For large, sophisticatedplayers, such as TFII, which have already implemented the latest technologies monitoringfactors like miles, speed, idling, hard-braking and fuel consumption in their fleets, the impact onoperations will be negligible, while the potential reduction in industry capacity, assuming agradually expanding economy, should result in a better pricing environment (i.e. contractpricing up 5% with spot market rates substantially higher) in 2018-2019 (to the benefit offinancial results and stock prices).For our part, we expect 2017 revenue, excluding fuel surcharges, to increase about 32% to 1.97billion, but with a roughly 16% decline in operating income to 89 million, driven by a 260basis-point deterioration in the operating margin to 4.5%. Adjusted EBITDA is projected toincrease 26% to 290 million. For 2018, when we expect a better supply/demand balance (aswell as lower integration & maintenance expenses), it could be reasonably projected that TLsegment sales, ex fuel, could improve 2.5% and top 2 billion, with a more normalized operatingmargin of 6.5%, which implies a 48% rise in operating income to 131 million. Adjusted EBITDAcould be projected to increase 19% to 344 million (see Background #5).Page 7
HIDDEN OPPORTUNITIES“Valuing possible breakups by providing sum-of-the-parts analysis.”Parcel & Courier (P&C)The Parcel & Courier segment, which accounted for 34% of revenue in 2016 and 31% of adjustedEBITDA, offers same-day/last mile as well as next-day delivery services in the U.S. and Canada.The business was also built via a series of acquisitions, including Dynamex and DHL Express in2011 (see Background #7), and primarily uses independent contractors (IC), which results in an“asset-light” operating model that limits the business’s capital intensity (to the benefit of cashflow and financial returns).Background #7 TFI International: P&C Segment, Selected M&A(C and US in RevenueJan-17World Courier Ground U.S.Courier-US 35Dec-16Muskoka DeliveryCourier- 30Jun-15Hazen Final MileSame-day- 45---Jul-14EnsendaSame-day/Last mile-US 47---Jan-13Velocity ExpressExpress parcel- 160---Jun-11DHL Express (U.S.)Express parcel 25 275--0.1xFeb-11Dynamex Inc.Same-dayUS 248US 418US 20.911.9x0.6xNov-07ICS CourierCourier 119 96--1.2x11.9x0.6xAverageEBITDA EV/EBITDA EV/Sales-Source: Company reports, Bloomberg, and Institutional Research Group estimates.In 2016, revenue, excluding fuel surcharges, increased almost 6% to 1.32 billion; excludingacquisitions, sales increased about 3%, primarily driven by increased e-commerce shipments,which were up 41.5% to 315 million (or almost 24% of segment sales) and currency tailwinds.Adjusted operating income increased 29.5% on a 160-basis-point improvement in the segmentmargin to 8.8%, driven by management’s restructuring efforts, which are aimed at reducingcosts and improving productivity with the target of generating a “double-digit EBIT” marginprofile. Adjusted EBITDA improved 22% to 151 million (See Background #8).In the first three months of 2017, segment sales, ex-fuel, improved 2.6% to 320 million, drivenby the acquisition of World Courier Ground in January 2017; excluding inorganic growth,quarterly sales fell about 3% due to a 2% decline in volume and a 1% drag from currency. Ecommerce revenue was roughly flat in 1Q 2017, due to Amazon’s (NASDAQ: AMZN) decision tochange providers in the Los Angeles market, which prompted TFII to cap the amount ofbusiness it would do with AMZN at 75 million (down from 100 million). Adjusted operatingincome rose 36% to 23 million, as the aforementioned restructuring efforts, which include arebranding/consolidation of some divisions under the TForce Final Mile moniker, drove a 180basis-point improvement in the operating margin to 7.2%. (Note: 1Q 2017 results include 3.2million of employee termination costs that will generate estimated annual savings of 2.6million.) Adjusted EBITDA increased 23% to 31 million (see Background #8).For full year 2017, we expect segment sales, excluding fuel surcharges, to increase 1.5% to 1.34 billion. We expect operating income to improve almost 15% on a 120-basis-pointPage 8
HIDDEN OPPORTUNITIES“Valuing possible breakups by providing sum-of-the-parts analysis.”improvement in the operating margin to 10%, which is in-line with management’s recentcommentary that given its ongoing restructuring efforts, P&C’s operating margin would improvemore than 100 basis points and be in the double-digits for the full-year 2017. Adjusted EBITDAis projected to improve 12% to 170 million.Background #8 TFI International: P&C Segment, Selected Financial Items (2014-2018E)(C in millions)3 mos.3 mos.201420152016201620172017E2018ETotal revenue 1,303.8 1,347.8 1,399.7 327.6 342.5 1,434.7 1,492.1Fuel surcharge( 134.8)( 98.0)( 78.8)( 15.7)( 22.5)( 93.3)( 97.0) 1,169.0 1,249.8 1,320.9 312.0 320.0 1,341.5 1,395.1Adj. operating income 91.2 90.2 116.8 16.8 22.9 134.1 139.5Depreciation of PP&E 18.2 19.1 18.8 4.7 4.4 18.7 19.4RevenueAmortization of intangibles 17.2 14.8 15.8 4.0 4.1 17.2 17.9 126.6 124.0 151.3 25.5 31.4 170.0 176.8EBIT margin, ex-fuel7.8%7.2%8.8%5.4%7.2%10.0%10.0%EBITDA margin, ex-fuel10.8%9.9%11.5%8.2%9.8%12.7%12.7%EBIT margin, total7.0%6.7%8.3%5.1%6.7%9.4%9.4%EBITDA margin, total9.7%9.2%10.8%7.8%9.2%11.9%11.9%Adjusted EBITDACapital expenditures, net 19.4 16.6 11.2 5.4 2.7 13.4 14.0Note: 1Q 2017 operating income excludes a 13.2 million charge for impairment of intangibles but includes 3.2million of employee termination costs.Source: Company reports, Bloomberg, and Institutional Research Group estimates.For 2018, considering management’s commentary that global growth for P&C is likely in the 3%5% range we think it is reasonable to expect top-line growth, ex fuel, of 4% to 1.395 billion.Assuming the operating margin remains flat at 10%, which is in-line with management’s doubledigit target, operating income and EBITDA could be projected to grow 4% to 139.5 million and 177 million, respectively. (Management anecdotally indicates that the longer-term marginopportunity in the P&C business could be 12%-14%, although it does not see that as achievablein the next year or two; that said, 11% has been mentioned as a realistic possibility, which couldmake our 2018 forecast conservative.)Page 9
HIDDEN OPPORTUNITIES“Valuing possible breakups by providing sum-of-the-parts analysis.”Less-than-Truckload (LTL)The Less-than-Truckload segment, which accounted for 20% of revenue and 16% of EBITDA in2016, was also built via acquisitions, including Quik X in 2012 as well as Clarke and VitranCanada in 2014 (see Background #9). The segment offers over-the-road and intermodal freightdelivery services to shippers with less than a full truckload of freight (typically less than 10,000lbs.) throughout Canada (as well as the U.S. and Mexico via partnership agreements). On theover-the-road side (63% of LTL segment revenue), goods for multiple customers are moved on asingle truck via a hub-and-spoke model that can be thought of as being almost akin to a postalservice but for heavy freight. On the intermodal side (37% of LTL segment sales), shipments areput on a railroad, primarily Canadian National (NYSE: CNI), for the line-haul portion of a move,with the pickup and delivery (P&D) portions being completed by third-party truck drivers (orIC’s), which limits the segment’s capital intensity.Background #9 TFI International: LTL Segment, Selected M&A(C and US in RevenueJan-17Cavalier TransportationLTL & Logistics- 46---Jan-17National Fast FreightLTL intermodal- 80---Mar-14Vitran CanadaLTL 136 200--0.7xApr-14Clarke Road TransportLTL 88 190--0.5xJan-12Quik X TransportationLTL expedited-US 200----0.6xAverageEBITDA EV/EBITDA EV/SalesNote: 30 million of Cavalier’s revenue is included in the LTL segment with 16 being included in LogisticsSource: Company reports, Bloomberg, and Institutional Research Group estimates.In 2016, segment sales, excluding fuel surcharges, declined 6% to 715 million, due to weaknessin both Eastern and Western Canada partially offset by currency. Nevertheless, adjustedoperating income rose 5.5% to 48.3 million on an 80-basis-point improvement in theoperating margin to 6.8%, as the company continues to implement restructuring initiativessimilar to those in the P&C segment. (Excluding gains on sales, the operating margin improved150 basis points to 6.1%.) Adjusted EBITDA was essentially flat at 77 million (see Background#10).P a g e 10
HIDDEN OPPORTUNITIES“Valuing possible breakups by providing sum-of-the-parts analysis.”Background #10TFI International: LTL Segment, Selected Financial Items (2014-2018E)(C in millions)3 mos.3 mos.201420152016201620172017E2018ETotal revenue 910.8 882.9 808.8 198.8 228.7 901.8 910.8Fuel surcharge( 158.5)( 120.8)( 94.2)( 21.6)( 29.5)( 117.2)( 118.4)Revenue 752.4 762.1 714.6 177.3 199.2 784.6 792.4Adj. operating income 61.1 45.8 48.3 5.4 8.7 58.8 59.4Depreciation of PP&E 24.9 22.8 20.3 5.3 5.6 22.1 22.3Amortization of intangibles 8.2 8.7 8.4 2.2 2.3 9.0 9.1 94.2 77.2 77.0 12.8 16.7 90.0 90.9EBIT margin, ex-fuel8.1%6.0%6.8%3.0%4.4%7.5%7.5%EBITDA margin, ex-fuel12.5%10.1%10.8%7.2%8.4%11.5%11.5%EBIT margin, total6.7%5.2%6.0%2.7%3.8%6.5%6.5%EBITDA margin, total10.3%8.7%9.5%6.5%7.3%10.0%10.0% 5.9 5.9Adjusted EBITDACapital expenditures, net( 48.8) 5.0 5.4 2.9 0.2Note: 2014 capital expenditures include 57.3 million of property salesSource: Company reports, Bloomberg, and Institutional Research Group estimates.In the first three months of 2017, segment sales, ex-fuel, improved 12% to 199 million,primarily driven by acquisitions, including National Fast Freight (NFF) and Cavalier in January2017 (see Background#9). Excluding acquisitions, sales were down roughly 1%, largely due tocurrency fluctuations. Adjusted operating income improved 61% to 9 million on a 140 basispoint improvement in the operating margin to 4.4%, driven by management’s aforementionedrestructuring efforts. Adjusted EBITDA improved 30% to 17 million (See Background #10).Importantly, during the quarter TFII renewed a long-term partnership with its primary railpartner, Canadian National, Canada’s largest railroad, to support additional growth in its LTLintermodal offering, which along with acquisitions should help offset declines in over-the-road.Looking ahead to the remainder of 2017, the Canadian LTL space is suffering from a degree ofovercapacity, similar to the U.S. truckload sector. That said, the problem in the highly energydependent markets in Western Canada (e.g., Alberta and Saskatchewan) is not enough demand,while in Eastern Canada the issue is more one of supply. In the West, TFII’s is seeing early signsof a rebound among energy-related customers; in the East, it is likely to pursue additionalconsolidation opportunities which could serve to both remove a competitor and add lanedensity. Anecdotally, excluding the impact of the NFF and Cavalier acquisitions TFII expects itsexisting LTL business to contract 1% in 2017 with growth in intermodal partially offsetting ongoing declines in the over-the-road business. For our part, we expect segment revenue,excluding fuel surcharges, to grow 10% to 785 million, with a 22% gain in operating incometo 59 million on about a 70-basis-point expansion of the operating margin to 7.5%, driven byP a g e 11
HIDDEN OPPORTUNITIES“Valuing possible breakups by providing sum-of-the-parts analysis.”management’s ongoing restructuring efforts. Adjusted EBITDA is projected to increase 17% to 90 million. For 2018, we model revenue growth, ex fuel, of 1% to 792 million along with a flatmargin comparison, implying an about 1% rise in operating income and adjusted EBITDA to 59 million and 91 million, respectively.LogisticsThe Logistics segment, which accounted for 6% of sales and EBITDA in 2016, provides nonasset-based truck brokerage, warehousing, and supply chain/transportation managementservices to customers in the U.S., Canada, and Mexico. Similar to the rest of TFII, the businesshas scaled by acquisition (see Background #11) and broadly serves a market that is large(US 100
5 per share, and 4 per share can be assigned to TFII's TL, P&C, LTL, and Logistics businesses. Accounting for corporate costs and projected net debt of 17 per share yields a sum-of-the- . XPO) U.S. truckload business for US 558 million (or 6.2x EV/EBITDA) in October 2016. For some context on the most recent deal, the acquired business .