Transcription
ISSN: 2349-5677Volume 1, Issue 2, July 2014Financial Performance Of Axis Bank And Kotak Mahindra Bank In The PostReform Era: Analysis On CAMEL ModelDeepti TripathiASST.PROFGalgotia Institute of Mgt & Tech, Greater Noidadeeptibnt2006@rediffmail.comKishore MeghaniResearch ScholarGalgotia Institute of Mgt & Tech, Greater Noidakishoremeghani.gimt@gmail.comSwati MahajanResearch ScholarICFAI Business School,Gurgoanswaatii.m@gmail.comAbstract:The objective of this study is to Analyze the Financial Position and Performance of the Axis andKotak Mahindra Bank in India based on their financial characteristics. We have chosen theCAMEL model and t-test which measures the performance of bank from each of the importantparameter like capital adequacy, asset quality, management efficiency, earning quality, liquidityand Sensitivity. The present study is conducted analyze the consistency of the profitability of theAxis and Kotak Mahindra bank’s. It is analyses that the ratio of credit deposit is maximum ofKotak Mahindra Bank Ltd and it shows efficient management of the bank. The ratio of earningper share is maximum for Axis Bank Ltd i.e. 50.28 and the ratio of return on Assets is minimumfor Axis Bank Ltd. The CAMELS’ analysis and t-test concludes that there is no significancedifference between the Axis and Kotak Mahindra bank’s financial performance but the KotakMahindra bank performance is slightly less compared with Axis Bank.Keywords: Elite Banks, CAMELS Model, Axis and Kotak Mahindra bank, financialperformance108
ISSN: 2349-5677Volume 1, Issue 2, July 2014INTRODUCTIONAs soon the bottom lines of Domestic Banks come under increasing pressure and the optionsfor organic growth exhaust themselves, Indian Banks will need to explore ways for inorganicexpansion. This, in turn, is likely to unleash the forces of consolidation in Indian banking.C. RangarajanEX-Chairman of Economic Advisory Council of the Prime MinisterBanks are playing crucial and significant role in the economy in capital formation due to theinherent nature, therefore banks should be given more attention than any other type of economicunit in an economy. The banking sectors performance is perceived as economic activities of aneconomy. The banking sector reforms were aimed at making banks more efficient and viable asone who had a role initiating these reformsAfter liberalization a small number of private sector banks came to be known as New GenerationTechnology.Sevvy banks, which includes bank such as Axis Bank (earlier it was UTI Bank), KotakMahindra Bank, HDFC, ICICI.LITERATURE REVIEWA study conducted by Barr et al. (2002) viewed that “CAMEL rating criteria has become aconcise and indispensable tool for examiners and regulators”. This rating criterion ensures abank’s healthy conditions by reviewing different aspects of a bank based on variety ofinformation sources such as financial statement, funding sources, macroeconomic data, budgetand cash flow.109
ISSN: 2349-5677Volume 1, Issue 2, July 2014Said and Saucier (2003) examined the liquidity, solvency and efficiency of Japanese Banksusing CAMEL rating methodology, for a representative sample of Japanese banks for the period1993- 1999, they evaluated capital adequacy, assets and management quality, earnings abilityand liquidity position.Prasuna (2003) analyzed the performance of Indian banks by adopting the CAMEL Model. Theperformance of 65 banks was studied for the period 2003-04. The author concluded that thecompetition was tough and consumers benefited from better services quality, innovative productsand better bargains.Nurazi and Evans (2005) investigated whether CAMEL(S) ratios could be used to predict bankfailure. The results suggested that adequacy ratio, assets quality, management, earnings, liquidityand bank size are statistically significant in explaining bank failure.Bhayani (2006) analyzed the performance of new private sector banks through the help of theCAMEL model. Four leading private sector banks – Industrial Credit & Investment Corporationof India, Housing Development Finance Corporation, Unit Trust of India and IndustrialDevelopment Bank of India - had been taken as a sample.Sanjay J. Bhayani (2006) in his study, “Performance of the New Indian Private Banks: AComparative study”. The study covered 4 leading private sector banks- ICICI, HDFC Bank, UTIand IDBI. The result showed that the aggregate performance of IDBI Bank is the best among allthe banks.Gupta and Kaur (2008) conducted the study with the main objective to assess the performanceof Indian Private Sector Banks on the basis of Camel Model and gave rating to top five andbottom five banks. They ranked 20 old and 10 new private sector banks on the basis of CAMELmodel. They considered the financial data for the period of five years i.e., from 2003-07.Sangmi and Nazir (2010) opined that liquidity management is one of the most importantfunctions of a bank. If funds tapped are not properly utilized, the institution will suffer loss.Siva and Natarajan (2011) empirically tested the applicability of CAMEL and its consequentialimpact on the performance of SBI Groups. The study found that CAMEL scanning helps thebank to diagnose its financial health and alert the bank to take preventive steps for itssustainability.K.V.N.Prasad and Dr.A.A.Chari (2011) conducted a study to evaluate financial performanceof public and private sector banks in India. In this study they compared financial performance of110
ISSN: 2349-5677Volume 1, Issue 2, July 2014top four banks in India viz., SBI, PNB, ICICI and HDFC and concluded that on overall basisHDFC rated top most position.Dr.K.Srinivas and L.Saroja (2013) conducted a study to compare the financial performance ofHDFC Bank and ICICI Bank. From the study it is clear that there is no significance differencebetween the ICICI and HDFC bank’s financial performance but we conclude that the ICICI bankperformance is slightly less compared with HDFC.OBJECTIVES1) To Analyze the Financial Position and Performance of the Axis and Kotak MahindraBank by Applying CAMEL Modal.2) To give recommendation and suggestion for improvement of efficiency in Axis andKotak Mahindra Bank.METHODOLOGYSources of Data:The study is based on secondary data. The data were collected from the official directory, IndianBanking Association, RBI Bulletins, Dion Global Solutions Limited and data base of Centre forMonitoring Indian Economy ( CMIE ) namely PROWESS. The Published Annual Reports ofAxis Bank and Kotak Mahindra Bank taken from their websites, Magzines and Journals onfinance have also been used a sources of dataTo evaluate the comparative financial performance of Axis Bank and Kotak Mahindra Bank, thestudy adopted the world-renowned: Capital Adequacy, Asset Quality, Management, EarningQuality and Liquidity (CAMEL) model (with minor modification) with t test.Period of Study:The study covers a period of ten year from 2004-2013.111
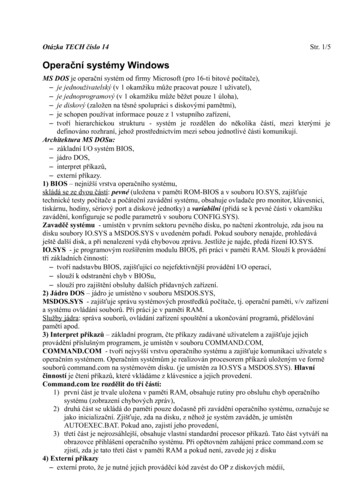
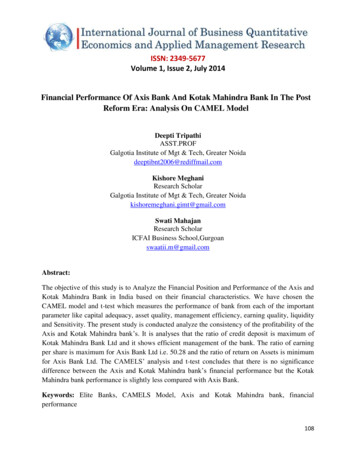
ISSN: 2349-5677Volume 1, Issue 2, July 2014Sampling:Two leading private sector banks- Axis Bank and Kotak Mahindra Bank- had been taken as asample.Hypothesis:From the above objectives of the following hypothesis is formulated to test the financialperformance and efficiency of the Axis Bank and Kotak Mahindra Bank.H0: There is no significant relationship between financial position and performance of Axis andKotak Mahindra Bank.Research Modal:FIGURE1: RESEARCH MODEL BASED ON THE ARTICLE PRESENTED BYPROFESSOR SANGMI AND DOCTOR NAZIR (2011), CAMER MAGAZINE112
ISSN: 2349-5677Volume 1, Issue 2, July 2014I. CAPITAL ADEQUECY:It is important for a bank to maintain depositors’ confidence and preventing the bank from goingbankrupt. It reflects the overall financial condition of banks and also the ability of managementto meet the need of additional capital.The following ratios measure capital adequacy:1. Capital Adequacy Ratio (CAR):Capital adequacy ratio is defined as:CAR (Tier 1 Capital Tier 2 Capital) / Risk weighted AssetsTIER 1 CAPITAL - (paid up capital statutory reserves disclosed free reserves) - (equityinvestments in subsidiary intangible assets current and b/f losses)TIER 2 CAPITAL – i. Undisclosed Reserves, ii. General Loss reserves, iii. hybrid debt capitalinstruments and subordinated debts where risk can either be weighted assets (a) or the respectivenational regulator's minimum total capital requirement.If using risk weighted assets,CAR [(T1 T2) / a] 10%percent threshold varies from bank to bank (10% in this case, a common requirement forregulators conforming to the basel accords) is set by the national banking regulator of differentcountries. But As per the latest RBI norms, the banks should have a CAR of 9 per cent.113
ISSN: 2349-5677Volume 1, Issue 2, July 2014TABLE – 1 CAPITAL ADEQUACY RATIOGroup StatisticsBANKSNCAPITAL ADEQUA AXIS BANK10CY RATIOKOTAK MAHINDRA10BANKMeanStd.DeviationStd.Mean13.3050 1.93011.6103516.3280 3.07057.97100ErrorLevene's Test forEqualityofVariancest-test for Equality of Means95% ConfidenceInterval of 182.636Std.MeanErrorSig. (2- Differen Differentailed) ceceLowerUpper.017-3.02300 1.14690 -5.43254 -.6134615.15.0192.636 2-3.02300 1.14690 -5.46542 -.58058*Findings: The Significant p value is 0.080 0.05 than equal variance assumed is 0.017 0.05than hypothesis is rejected.114
ISSN: 2349-5677Volume 1, Issue 2, July 20142. Tier I Capital Ratio:The Basel rules recognize that different types of equity are more important than others and torecognize i.e.,Tier I Capital and Tier II Capital. Tier I Capital is actual contributed from equity plus retainedearnings. The minimum CAR ratios as per Basel Accord norms: Tier I equity to risk weightedasset is 4 per cent, while minimum CAR including Tier II Capital is 8 per cent.TABLE – 2 TIER I CAPITAL RATIOGroup StatisticsBANKSNCAPITAL RATIO T AXIS BANK10IER IKOTAK 3.6073613.9188 3.54459Error1.25320Independent Samples TestLevene's Testfor Equality ofVariancest-test for Equality of MeansFSig.tDfStd.Mean ErrorSig. (2- Differe Differetailed) ncence95%ConfidenceInterval of theDifference115
ISSN: 2349-5677Volume 1, Issue 2, July 2014Lower UpperCAPITAL EqualRATIO TIE variancesR Iassumed2.893.108Equalvariances notassumed3.71 166.0021.30524.84977.6167 2.0827453710.23.48.0063521.39264.84977.9430 1.75642564*Findings: The Significant p value is 0.108 0.05 than equal variance assumed is 0.002 0.05than hypothesis is rejected.3. Tier II Capital Ratio:Tier II capital includes preference shares plus 50% of subordinated debt. The minimum Tier IIcapital is 8 percent as per Basel norms.TABLE – 3 TIER II CAPITAL RATIOGroup StatisticsBANKSNCAPITAL RATIO AXIS BANK10TIER IIKOTAK5MAHINDRA 722.62401.31077.58620116
ISSN: 2349-5677Volume 1, Issue 2, July 2014Independent Samples TestLevene's Testfor Equality ofVariancest-test for Equality of Means95%ConfidenceInterval of theDifferenceFCAPITAL EqualRATIO TI variancesER IIassumedEqualvariancesnot assumedSig.12.754 .003tdf3.30139Std.Sig. Mean Error(2Differe Differetailed) ncenceLower Upper.0061.61202.6644.48718 .55951092.61 4.90.049051.61203.2091.61769 .0148703*Findings: The Significant p value is 0.003 0.05 than equal variance not assumed is 0.049 0.05 than hypothesis is rejected.117
ISSN: 2349-5677Volume 1, Issue 2, July 2014II. Asset Quality:Banks determine how many of their assets are at financial risk and how much allowance forpotential losses they must make.1. Total Assets Turnover Ratio:This ratio measures the efficiency in utilization of the assets. It is arrived at by dividing sales bytotal assets. Total Assets Turnover Ratio Sales/Total AssetsTABLE – 4 TOTAL ASSETS TURNOVER RATIOGroup StatisticsNMeanStd.DeviationTOTAL ASSETS T AXIS BANK10URNOVER RATIOKOTAK10MAHINDRA orMeanIndependent Samples TestLevene's Testfor Equality ofVariancest-test for Equality of MeansFSig.tDf95% ConfidenceStd.Interval of theMean Error DifferenceSig. (2- Differe Differetailed) ncenceLower Upper118
ISSN: 2349-5677Volume 1, Issue 2, July 2014TOTAL AS EqualSETS TUR variances.162NOVER RA assumedTIOEqualvariances notassumed.6922.36 180.030-.01300 .00551 -.02457 -.0014317.92.36.030460-.01300 .00551 -.02457 -.00143*Findings: The Significant p value is 0.692 0.05 than equal variance assumed is 0.030 0.05than hypothesis is rejected.2. Loan Ratio:The ratio provides a general measure of the financial position of a bank, including its ability tomeet financial requirements for outstanding loans.Loan Ratio Loans/Total Assets.TABLE – 5 LOAN RATIOGroup StatisticsNMeanStd.DeviationLOANS TURNOV AXIS BANK10ERKOTAK NKSStd.MeanErrorIndependent Samples Test119
ISSN: 2349-5677Volume 1, Issue 2, July 2014Levene's Testfor Equality ofVariancest-test for Equality of Means95%ConfidenceInterval of theDifferenceLOANS T EqualURNOVE variancesRassumedFSig.T1.206.287-.722 18Equalvariances notassumed-.722dfStd.Mean ErrorSig. (2- Differe Differetailed) ncenceLower Upper.480-.02400 .03324 -.09383 .0458315.0.48129-.02400 .03324 -.09483 .04683*Findings: The Significant p value is 0.287 0.05 than equal variance assumed is 0.480 0.05than hypothesis Ho is accepted.III. Management Efficiency:The bank management efficiency guarantees the growth and survival of a bank.1. Credit Deposit Ratio:It is the ratio of how much a bank lends out of the deposits it has mobilized.Credit Deposit Ratio Total Advances/Customer Deposit.120
ISSN: 2349-5677Volume 1, Issue 2, July 2014TABLE – 6 CREDIT DEPOSIT RATIOGroup StatisticsBANKSNMeanCREDIT DEPOSIT R AXIS BANK8ATIOKOTAK MAHINDRA8BANKStd.DeviationStd.Mean55.2425 13.944544.9301483.1125 21.578357.62910ErrorIndependent Samples TestLevene'sTestfor Equality ofVariancest-test for Equality of Means95% ConfidenceInterval of theDifferenceFCREDIT DE EqualPOSIT RATI variancesOassumedEqualvariances notassumed1.758Sig.tDf.2063.06 148Std.Mean ErrorSig. (2- Differe Differetailed) ncenceLower Upper.0089.0834727.870047.3521 8.3879011.93.06.0107889.0834727.870047.6651 8.07485*Findings: The Significant p value is 0.206 0.05 than equal variance assumed is 0.008 0.05than hypothesis Ho is rejected.121
ISSN: 2349-5677Volume 1, Issue 2, July 20142. Total Income/Capital employed Ratio:This measure narrows the focus to gain a better understanding of a company's ability to generatereturns from its available capital base.TABLE – 7 TOTAL INCOME /CAPITAL EMPLOYED RATIOGroup StatisticsBANKSNTOTALINCOME CAP AXIS BANK10ITALEMPLOYEDKOTAK 53.3236711.0450 1.08592.34340ErrorIndependent Samples TestLevene's Testfor Equality ofVariancest-test for Equality of MeansFSig.tdfStd.Mean ErrorSig. (2- Differe Differetailed) ncence95%ConfidenceInterval of theDifference122
ISSN: 2349-5677Volume 1, Issue 2, July 2014Lower UpperTOTALINC EqualOME CAPI variances.038TALEMPLO assumedYEDEqualvariances notassumed.8473.36 187.0031.5890 .47189 2.5804 -.597590117.93.36.0033771.5890 .47189 2.5806 -.5973406*Findings: The Significant p value is 0.847 0.05 than equal variance assumed is 0.003 0.05than hypothesis Ho is rejected.IV. Earning Quality:Earning quality represents the quality of a bank’s profitability and its capability to maintainquality and earn consistently. This ratio measures the profitability or the operational efficiency ofthe banks.1. Net Profit Ratio:Net profit ratio shows the operational efficiency of the business. Decreases in the ratio indicatemanagerial inefficiency and excessive selling and distribution expenses and Increase showsbetter performance.Net Profit Ratio (Net Profit/Total Income)*100123
ISSN: 2349-5677Volume 1, Issue 2, July 2014TABLE – 8 NET PROFIT RATIOGroup StatisticsBANKSNMeanNET PROFIT RATI AXIS BANK10O NETPROFITMARKOTAKGIN10MAHINDRA BANKStd.DeviationStd.ErrorMean14.2520 1.70707.5398213.8070 3.754941.18742Independent Samples TestLevene's Testfor Equality ofVariancest-test for Equality of MeansFNET PROFI EqualT RATIO N variances4.459ETPROFIT assumedMARGINEqualvariances notassumedSig.049tdf95% ConfidenceStd.Interval of theMean Error DifferenceSig. (2- Differe Differetailed) ncenceLower 1.30433.2727.445002.3827699.341 18124
ISSN: 2349-5677Volume 1, Issue 2, July 2014*Findings: The Significant p value is 0.049 0.05 than equal variance not assumed is 0.739 0.05 than hypothesis Ho is accepted.2. Dividend per Share (DPS):Dividend per share indicates the return earned per share. This ratio shows the amount payableper share to equity shareholders. Dividend per share ratio ignores earnings retained in thebusiness. This ratio provides the better information about earning for equity shareholders.Dividend per Share Dividend on Equity Share Capital / No. of Equity SharesTABLE – 9 DIVIDENDS PER SHARE RATIOGroup StatisticsBANKSNDIVIDEND PER S AXIS BANK10HAREKOTAK10MAHINDRA 9100.56164.17761ErrorIndependent Samples TestLevene's Testfor Equality ofVariancest-test for Equality of MeansFSig.tdfMean95% ConfidenceStd.Sig. (2- DiffereInterval of theErrortailed) nceDifferenceDiffere125
ISSN: 2349-5677Volume 1, Issue 2, July 2014nceDIVIDEND EqualPER SHAR variancesEassumed40.158 .000Equalvariances notassumed4.33185Lower Upper.0008.0200 1.8498 4.1335 11.906406824.33 9.16.002578.0200 1.8498 3.8469 12.19300646*Findings: The Significant p value is 0.000 0.05 than equal variance not assumed is 0.002 0.05 than hypothesis Ho is rejected.3. Earnings per share: (EPS)Earnings per share indicate the return earned per share. This ratio measures the market worth ofthe shares of the company (Banks). Higher earning per share shows better future prospects of theBanks. EPS indicates whether the earning power of the bank has increased or not.Earnings per Share Profit after tax-Preference Dividend / No. of Equity SharesTABLE – 10 EARNING PER SHARE RATIOGroup StatisticsBANKSNEARNING PER SH AXIS BANK10AREKOTAK10MAHINDRA BANKMeanStd.DeviationStd.MeanError50.2820 37.6451211.9044310.4890 4.968961.57132126
ISSN: 2349-5677Volume 1, Issue 2, July 2014Independent Samples TestLevene's Testfor Equality ofVariancest-test for Equality of Means95%ConfidenceInterval of theDifferenceFEARNING EqualPER SHAR variancesEassumedSig.22.813 .000Equalvariances notassumedtdf3.31184Std.Mean ErrorSig. (2- Differe Differetailed) ncenceLower Upper.00439.793 12.007 14.565 65.020006978223.31 9.31.0094439.793 12.007 12.768 66.81700694753*Findings: The Significant p value is 0.000 0.05 than equal variance not assumed is 0.009 0.05 than null hypothesis Ho is rejected.4. Return on Net worth (RON):This ratio measures the overall profitability, the operational efficiency and borrowing policy ofthe enterprise. It indicates the relationship of net profit with capital employed in the business.The primary objective of business is to maximize its earnings and this ratio indicates the extentto which this primary objective of business is being achieved.127
ISSN: 2349-5677Volume 1, Issue 2, July 2014Return on Net Worth Net Profit / Net-worthTABLE – 11 RETURN ON NET WORTH RATIOGroup StatisticsBANKSNMeanRETURN ON NETW AXIS BANK10ORTHKOTAK MAHINDRA10BANKStd.DeviationStd.Mean17.9940 3.610721.1418111.9600 2.54156.80371ErrorIndependent Samples TestLevene's Testfor Equality ofVariancest-test for Equality of Means95% ConfidenceInterval of theDifferenceRETURN O EqualN NETWOR variancesTHassumedEqualvariances notassumedFSig.tdf.075.7874.32181Std.Mean ErrorSig. (2- Differe Differetailed) ncenceLower Upper.0006.0340 1.3963 3.1004 8.967501644.32 16.1.001166.0340 1.3963 3.0763 8.99160146128
ISSN: 2349-5677Volume 1, Issue 2, July 2014*Findings: The Significant p value is 0.787 0.05 greater than equal variance assumed is 0.000 0.05 than null hypothesis Ho is rejected.5. Return on Assets:This ratio measures the return on assets employed or efficiency in utilization of the assets.Return on Assets Net Profit / Total AssetsTABLE – 12 RETURN ON ASSETS RATIOGroup StatisticsBANKSNMeanRETURN ON ASSE AXIS BANK10TSKOTAK MAHINDRA10BANKStd.DeviationStd.MeanError300.8770 t Samples TestLevene'sTestfor Equality ofVariancest-test for Equality of MeansFSig.tdf95% ConfidenceStd.Interval of theMean Error DifferenceSig. (2- Differe Differetailed) ncenceLower Upper129
ISSN: 2349-5677Volume 1, Issue 2, July 2014RETURN EqualON ASSET variancesSassumed18.942 .000Equalvariances notassumed2.93185.009209.296 71.3086 59.4821 359.10902582.93 9.41.01655209.296 71.3086 49.0613 369.5300236*Findings: The Significant p value is 0.000 0.05 than equal variance not assumed is 0.016 0.05 than null hypothesis Ho is rejected.V. Liquidity Ratios:Liquidity is very important for any organization dealing with money. For a bank,Liquidity is a crucial aspect which represents its ability to meet its financial obligations.Liquidity ratios are calculated to measure the short term financial soundness of the bank. Theratio assesses the capacity of the bank to repay its short term liability. This ratio is also aneffective source to ascertain, whether the working capital has been effectively utilised. Liquidityin the ratio means ability to repay loans. If a bank does not have sufficient liquidity, it may notbe in a position to meet its commitments and thereby may lose its credit worthiness.1. Current Ratio:Current ratio judges whether current assets are sufficient to meet the current liabilities or not. Itmeasures the liquidity position of the bank in terms of its short term working capital requirement.Current Ratio Current Assets/ Current LiabilitiesTABLE – 13 CURRENT RATIOGroup StatisticsBANKSCURRENT RAT AXIS rror130
ISSN: 2349-5677Volume 1, Issue 2, July 2014IOKOTAK MAHINDRA10BANK.3230.44252.13994Independent Samples TestLevene'sTestfor Equality ofVariancest-test for Equality of Means95% ConfidenceInterval of theDifferenceCURREN EqualT RATIO variancesassumedEqualvariances notassumedFSig.t1.262.276-.387 18-.387dfStd.Mean ErrorSig. (2- Differe Differetailed) ncenceLower Upper.703-.06900 .17830 -.44359 .3055917.0.7048-.06900 .17830 -.44504 .30704*Findings: The Significant p value is 0.276 0.05 than equal variance assumed is 0.703 0.05than null hypothesis Ho is accepted.131
ISSN: 2349-5677Volume 1, Issue 2, July 20142. Liquidity / Quick Ratio:Liquid assets are current assets less stock and prepaid expenses. Liquid assets include cash inhand, balance with RBI, balance with other banks (both in India and abroad) and money at calland short notice. Current liabilities include short-term borrowings, short-term deposits, billspayables and outstanding expenses.TABLE – 14 QUICK RATIOSGroup StatisticsBANKSNQUICK RATI AXIS BANK10OKOTAKMAHINDRA10BANKMeanStd.Std. Deviation Independent Samples TestLevene's Test forEqualityofVariancest-test for Equality of Means95% ConfidenceInterval of theDifferenceFSig.tdfStd.Mean ErrorSig. (2- Differen Differentailed) ceceLowerUpper132
ISSN: 2349-5677Volume 1, Issue 2, July 2014QUICK EqualvariancesassumedRATIO3.094.096Equalvariances notassumed.1493.61500 2.400728.658731.4287317.01.15043.61500 2.400728.679771.449771.506 181.506*Findings: The Significant p value is 0.096 0.05 than equal variance assumed is 0.150 0.05than null hypothesis Ho is accepted.3. Debt-Equity Ratio:This ratio is calculated to judge the long term financial policy of the bank. A higher debt toequity ratio is not considered good for the bank. This ratio is calculated to measure the relativeclaims of outsiders and the owners against the bank’s assets.Debt-Equity Ratio Long-term Liabilities / Shareholders FundsTABLE – 15 DEBT-EQUITY RATIOGroup StatisticsBANKSNDEBT EQUITY R AXIS BANK10ATIOKOTAK MAHINDRA10BANKMeanStd.DeviationStd.Mean12.0390 3.618531.144285.5640.394791.24845ErrorIndependent Samples Test133
ISSN: 2349-5677Volume 1, Issue 2, July 2014Levene's Testfor Equality ofVariancest-test for Equality of MeansDEBT EQ EqualUITY RAT nces notassumeddf95% ConfidenceStd.Interval of theMean Error DifferenceSig. (2- Differe Differetailed) ncenceLower Upper.0006.4750 1.2104 3.93199.018100705.34 11.1.000916.4750 1.2104 3.81409.13593077*Findings: The Significant p value is 0.006 0.05 than equal variance not assumed is 0.000 0.05 than null hypothesis Ho is rejected.VI. Sensitivity to Market Risk:Sensitivity focuses on an institution's ability to identify, monitor, manage and control its marketrisk, and provides institution management with a clear and focused indication of supervisoryconcerns in this area.1. Interest Spread Ratio:Spread is the difference between interest earned and interest paid. So spread is the amountavailable to the commercial banks for meeting their administrative, operating and other expenses.As a matter of practice, banks try to increase the spread volume so that it is sufficiently availableto meet the non-interest expenses and the remainder contributes to the profit volume.Spread Ratio (%) (Spread / Working Fund)*100134
ISSN: 2349-5677Volume 1, Issue 2, July 2014TABLE – 16 INTERESTS SPREAD RATIOGroup StatisticsBANKSNINTEREST SPRE AXIS BANK7ADKOTAK .314236.53141.66609.62972ErrorIndependent Samples TestLevene's Testfor Equality ofVariancest-test for Equality of Means95%ConfidenceInterval of theDifferenceFINTERES EqualT SPREA variancesDassumedSig.10.482 .007tdf3.57 123Std.Mean ErrorSig. (2- Differe Differetailed) ncenceLower Upper.0042.5142 .70377 4.0476 -.9809097135
ISSN: 2349-5677Volume 1, Issue 2, July 2014Independent Samples TestLevene's Testfor Equality ofVariancest-test for Equality of Means95%ConfidenceInterval of theDifferenceFINTERES EqualT SPREA variancesDassumedEqualvariances notassumedSig.10.482 .007tdf3.57 123Std.Mean ErrorSig. (2- Differe Differetailed) ncenceLower Upper.0042.5142 .70377 4.0476 -.98090978.813.57.006432.5142 .70377 4.1114 -.9171097*Findings: The Significant p value is 0.007 0.05 than equal variance not assumed is 0.006 0.05 than null hypothesis Ho is rejected.*(If variances are equal p value will be greater than 0.05 use equal variance assumed) (Ifvariances are unequal p value will be greater than 0.05 use equal variance not assumed)If (sig.2 tailed) 0.05: significant difference – reject hypothesis.If (sig.2 tailed) 0.05: no significant difference NSGroup means are significantly different as the value in the sig. (2 tailed) low is less than 0.05136
ISSN: 2349-5677Volume 1, Issue 2, July 2014H0: μ1 μ2 (Null hypothesis: mean of two banks are equal)Ha: μ1 μ2 (Alternate hypothesis: mean of two banks are not equal)SUMMARY OF FINDINGS, CONCLUSIONS AND SUGGESTIONS:Based on the above analysis, the following are the summary of findings; conclusions andsuggestions about the comparative financial performance of the AXIS and KOTAKMAHINDRA bank are drawn:1. The capital adequacy and Tier I capital ratio of AXIS and KOTAK MAHINDRA Bank ismore than the Basel Accord norms but the average Tier II capital ratio of AXIS and KOTAKMAHINDRA Bank. We conclude that both the banks are good with respect capital adequacybecause it is above the Basel norms.2. The loans to total assets of HDFC are more compared with ICICI Bank. Hence, we can saythat the risk is more in HDFC bank compared with ICICI Bank.3. The total advances to customer deposit of AXIS Bank are less compared with KOTAKMAHINDRA Bank. Hence, KOTAK MAHINDRA bank is managing more efficiently forconverting deposits to advances.4. The net profit ratio of AXIS Bank is more compared with KOTAK MAHINDRA Bank.5. The Average current assets and quick assets of AXIS Bank is more compared with KOTAKMAHINDRA bank. So, we can conclude that the AXIS Bank liquidity has well compared withKOTAK MAHINDRA Bank and the t-test has also proved the same in the case of all theliquidity ratios.6. The debt-equity ratio of AXIS Bank 12.09 % is more compared with KOTAK MAHINDRABank 5.56 % ; hence long term solvency is well in AXIS Bank.7. The spread ratio of AXIS Bank is more compared with KOTAK MAHINDRA Bank. Hence,we can say that the KOTAK MAHINDRA bank Interest income more compared with interestexpenses. Hence KOTAK MAHINDRA bank earns more profits.137
ISSN: 2349-5677Volume 1, Issue 2, July 2014From the CAMELS’ analysis it clears that there is no significance difference between the AXISand KOTAK MAHINDRA bank’s financial performance but we conclude that the KOTAKMAHINDRA bank performance is slightly less compared with AXIS Bank.SUGGESTIONS:The spread of the AXIS bank should control otherwise the income of the bank is eaten away bythe interest expenses in the long-run.Limitations of the study:The Limitation of the present study is that the analysis is restricted to only two major privatebanks. The inherent limitation is secondary data. The published data is not uniform and notproperly disclosed by the banks.Scope for Further Research:Capital Adequacy ratio (CAR) is a ratio that regulators in the banking system use to watchbank’s health, specifically bank’s capital to its risk. Regulators in most countries define andmonitor CAR to protect depositors, thereby maintaining confidence in the banking system. Thisresearch paper and its findings may be of considerable use to banking institutions, policy makersand to academic researchers in the area of banking performance evaluation with special referenceto capital adequacy.REFERENCES:1. Sathya and Bhattacharya et el (1997) : “Impact of Privatization on the Performance of thePublic Sector Banks, Journal of Management Review: pp 45-55.138
ISSN: 2349-5677Volume 1, Issue 2, July 20142. K. SRINIVA
ICFAI Business School,Gurgoan swaatii.m@gmail.com . Sevvy banks, which includes bank such as Axis Bank (earlier it was UTI Bank), Kotak Mahindra Bank, HDFC, ICICI. LITERATURE REVIEW A study . But As per the latest RBI norms, the banks should have a CAR of 9 per cent. ISSN: 2349-5677 Volume 1, Issue 2, July 2014 .