Transcription
Chen et al. Stem Cell Research & Therapy (2018) ARCHOpen AccessPhysioxia: a more effective approach forculturing human adipose-derived stemcells for cell transplantationChang Chen1,2,3†, Qi Tang1,2,3†, Yan Zhang1,2,3, Mei Yu1,2, Wei Jing1,2,3* and Weidong Tian1,2,3*AbstractBackground: Although typically cultured at an atmospheric oxygen concentration (20–21%), adipose-derived stemcells (ASCs) reside under considerable low oxygen tension (physioxia) in vivo. In the present study, we exploredwhether and how physioxia could be a more effective strategy for culturing ASCs for transplantation.Methods: After isolation, human ASCs were cultured under physioxia (2% O2) and hyperoxia (20% O2) until assayed.WST-8, Transwell, tube formation, β-galactosidase staining, and annexin V-FITC/PI assays were used to evaluate cellproliferation, migration, angiogenesis, senescence, and apoptosis, respectively. Survivability was determined by anischemia model in vitro and nude mouse model in vivo, and the underlying metabolic alterations were investigatedby fluorescence staining, flow cytometry, and real-time polymerase chain reaction.Results: Compared with those in the hyperoxia group, cells in the physioxia group exhibited increased proliferation,migration, and angiogenesis, and decreased senescence and apoptosis. The increased survival rate of ASCs cultured inphysioxia was found both in ischemia model in vitro and in vivo. The underlying metabolic reprogramming was alsomonitored and showed decreased mitochondrial mass, alkalized intracellular pH, and increased glucose uptake andglycogen synthesis.Conclusions: These results suggest that physioxia is a more effective environment in which to culture ASCsfor transplantation owing to the maintenance of native bioactivities without injury by hyperoxia.Keywords: Physioxia, Adipose-derived stem cells, Cell survival, Culture approach, Cell therapyBackgroundSince first isolated in 1964 [1], human adipose-derivedstem cells (ASCs) have garnered increasing attention [2].Especially in the recent two decades, after the discoveryof their stemness in 2001 [3], a growing body of researchhas indicated that ASCs possess properties of repair andregeneration, which include angiogenesis [4], multilineage differentiation [5], immunosuppression [6], andhoming to ischemic tissues [7]. Consequently, there isgreat interest in and demand for utilizing ASCs in several clinical applications, such as osteoarthritis, heart* Correspondence: jingwei@scu.edu.cn; drtwd@sina.comChang Chen and Qi Tang contributed equally to this work.†Equal contributors1State Key Laboratory of Oral Diseases, National Clinical Research Center forOral Diseases, West China Hospital of Stomatology, Sichuan University,Chengdu, People’s Republic of ChinaFull list of author information is available at the end of the articlefailure treatment and wound healing, according to theclinicaltrials.gov database.However, there are still several problems to resolve, suchas the donor choice [8], therapeutic safety [9], and standardprotocol for expanding ASCs [10]; among these problems,the most suitable strategy for culturing and expandingASCs in vitro has been continuously studied. Several factorsshould be considered, such as the culture medium, serumreplacements, and seeding density [11]. However, there isan extremely appropriate standard to which can be referred,the stem cell niche, which is the surrounding microenvironment and intrinsic factors that control the self-renewal anddifferentiation of stem cells [12, 13].A distinct difference between “standard culture conditions” and the ASC niche is the oxygen level [14]. Cellculture is typically performed at an atmospheric O2 concentration (20–21%), i.e., the normoxia recognized by The Author(s). 2018 Open Access This article is distributed under the terms of the Creative Commons Attribution 4.0International License (http://creativecommons.org/licenses/by/4.0/), which permits unrestricted use, distribution, andreproduction in any medium, provided you give appropriate credit to the original author(s) and the source, provide a link tothe Creative Commons license, and indicate if changes were made. The Creative Commons Public Domain Dedication o/1.0/) applies to the data made available in this article, unless otherwise stated.
Chen et al. Stem Cell Research & Therapy (2018) 9:148most researchers. However, there is a “mental shortcut”[15] neglecting the fact that the normoxia of 20–21% O2reflects the pathology of humans or animals, while thepractical oxygen concentration of the ASC niche islower, at 2% [16], which is called physioxia [17]. In otherwords, atmospheric normoxia represents a hyperoxicstate for ASCs.Many biological alterations occur when culturing suchcells under hyperoxia (atmospheric normoxia), particularly with respect to metabolism [18], generating changesin cell proliferation [19] and differentiation [20], amongothers [21]. Underlying these discrepancies is the impactof hypoxia-inducible factor 1 (HIF-1), which is degradedat O2 levels over 5% [15].By comparison, previous studies have commonly usedphysioxia at 2% O2 to culture ASCs [22–24] as a transitory approach to increase the expansion and angiogenesis of ASCs rather than as a culture standard throughthe entire in vitro period, except for some studies[25–29]; yet, these studies did not examine the angiogenesis or survival of ASCs under an ischemic environment. Thus, the aim of the present study was to explorethe superiority of physioxia (2% O2) compared withhyperoxia (20% O2) throughout the in vitro culture ofASCs by examining discrepancies in proliferation, migration, senescence, apoptosis, angiogenesis, and survivability, as well as the underlying mechanism.MethodsCell isolation and cultureSubcutaneous adipose tissue was collected from the abdomen of four healthy females (age, 25 5 years, body massindex [BMI]: 19–22) after obtaining their consent. Afterwashing with phosphate-buffered saline (PBS), the tissuewas minced and digested with 0.2% collagenase(Sigma-Aldrich, St. Louis, MO, USA)/PBS for 40 min at37 C. The mixture was washed with PBS and centrifugedat 1000 rpm for 5 min, and the remaining pellet was cultured in α-modified Eagle’s medium (α-MEM; HyClone,GE Healthcare, Marlborough, MA, USA), 10% fetal bovineserum (FBS; Gibco, San Jose, CA, USA), 100 IU penicillin,and 100 mg/mL streptomycin (Solarbio, Beijing, China).Cells in the physioxia group were cultured with 2% O2(using a modular chamber, Sanyo, Osaka, Japan) and 5%CO2 at 37 C (physioxia ASCs, P-ASCs) until further analysis in the following tests at passage 3, with 20% O2 and5% CO2 at 37 C as a control (hyperoxia ASCs, H-ASCs).Cells from different donors were mixed at passage 2 to explore the general effect on ASCs.Page 2 of 12incubated with PE- or FITC-conjugated antibodies againstCD31, CD34, CD73, CD90, CD105, and HLA-DR for30 min at 4 C. All antibodies were obtained from AbcamBiotechnology (Abcam, Cambridge, MA, USA). The cellswere then analyzed using a BD Accuri C6 flow cytometer(BD Biosciences, San Jose, CA, USA).AdipogenesisThe cells were seeded onto six-well plates. After reaching80% confluence, the culture medium was changed toα-MEM supplemented with 10% FBS, 1 mmol/L dexamethasone (Sigma-Aldrich, St. Louis, MO, USA),10 mmol/L insulin (Sigma-Aldrich, St. Louis, MO, USA),200 mmol/L indomethacin (Sigma-Aldrich, St. Louis,MO, USA) and 0.5 mmol/L 3-isobutyl-1-methylxanthine(IBMX; Sigma-Aldrich, St. Louis, MO, USA) for 7 days.Lipid clusters were stained with oil red O.Western blottingWestern blotting was performed as previously described[30], with slight modifications. After being dissolved inradioimmunoprecipitation assay (RIPA) buffer (KeyGEN,Nanjing, Jiangsu, China), 30 μg of protein, as detectedby bicinchoninic acid (BCA) assay, was separated on a10% polyacrylamide gel and blotted onto a polyvinylidene fluoride (PVDF) membrane. The membrane wasblocked with 5% skim milk and then treated with primary antibodies against HIF-1 (1:1000, 14,179, CellSignaling Technology, Beverly, MA, USA) and β-actin(1:1000, ab3280, Abcam, Cambridge, MA, USA) overnight at 4 C, followed by 1 h of incubation with bodies at room temperature. The signals were detected with Amersham ECL Select Western Blotting Detection Reagent (GE, Waukesha, WI, USA) according tothe manufacturer’s protocol. The signals were visualizedusing an ImageQuant LAS 4000 mini (GE, Waukesha,WI, USA).WST-8Cell Counting Kit 8 (WST-8; Dojindo, Kumamoto,Japan) was used to determine the proliferation ofP-ASCs and H-ASCs. The cells (1 103) were seededonto 96-well plates, and after 1, 2, 3, 4, 5, 6, and 7 days,the culture medium was replaced with 100 μL of WST-8dye solution (90 μL of α-MEM with 10 μL WST-8) for2 h at 37 C. Subsequently, the medium was discarded,and the absorbance at 450 nm was detected using aspectrophotometer (Multiskan GO, Thermo FisherScientific, Waltham, MA, USA).Cell characterizationFlow cytometric analysisCell doubling curveFlow cytometry was used to analyze the surface markersof the ASCs. After detaching, 1 105 cells wereASCs were seeded onto six-well plates at a concentration of 3 104 per well. The cells were collected at the
Chen et al. Stem Cell Research & Therapy (2018) 9:148indicated time points (1, 2, 3, 4, 5, 6, and 7 days), andthe cell numbers were measured using an AutomatedCell Counter (Bio-Rad, Hercules, CA, USA).Determination of reactive oxygen species (ROS),mitochondrial mass, and glucose uptakeThe ROS level, mitochondrial mass and glucose uptakewere determined by staining with 1 μM dihydrodichlorofluorescein diacetate (H2DCFDA, Sigma-Aldrich, St.Louis, MO, USA), 10 nM nonyl acridine orange (NAO,Sigma-Aldrich, St. Louis, MO, USA) and 150 μM2-[N-(7-nitrobenz-2-oxa-1,3-diazol-4-yl) amino]-2-deoxy-D-glucose (2-NBDG, Life Technologies, Gaithersburg,MD, USA), respectively, for 30 min at 37 C. The resultswere acquired by fluorescence microscopy (Olympus,Hamburg, Germany) and BD Accuri C6 (BD Biosciences,San Jose, CA, USA) with a minimum of 5000 events persample. ROS inhibition was produced using 100 μMbutylated hydroxyanisole (BHA, Sigma-Aldrich, St. Louis,MO, USA).Transwell assayAfter incubation in serum-free medium for 24 h, 1 105cells were transferred to the upper chamber of a Transwell (Corning, Corning, NY, USA). Medium containing10% FBS was added to the lower chamber as a chemoattractant. After 24 h, nonmigratory cells in the upperchamber were removed. The migrated cells were fixedwith 4% paraformaldehyde for 30 min, followed by 0.1%crystal violet (Sigma-Aldrich, St. Louis, MO, USA)Page 3 of 12staining for 15 min. After images were captured, thecrystal violet in the cells was extracted by 10% aceticacid for 15 min, and the absorbance at 600 nm was measured using a spectrophotometer (Multiskan GO,Thermo Fisher Scientific, Waltham, MA, USA).Cell senescenceWe assayed the ASCs for senescence-associatedβ-galactosidase (SA-β-Gal) activity using a Senescenceβ-Galactosidase Staining Kit (Beyotime, Shanghai,China) according to the manufacturer’s instructions. TheSA-β-Gal area was calculated by ImageJ (NIH,Bethesda, MD, USA) using the ratio of Periodicacid-Schiff (PAS) area to the total area of the image.Cell apoptosisASC apoptosis was measured using an Annexin V-FITC/PI Apoptosis Detection Kit (KeyGEN, Nanjing, Jiangsu,China) according to the manufacturer’s instructions.Flow cytometry was conducted using the BD Accuri C6flow cytometer (BD Biosciences, San Jose, CA, USA).Tube formation assayASCs (2 105) were seeded onto 96-well plates coatedwith Matrigel (Corning, Corning, NY, USA). After incubation at 37 C for 6 h, the cells were imaged under a microscope (Olympus, Hamburg, Germany). The images werequantified using ImageJ (NIH, Bethesda, MD, USA).Table 1 Primer sequencesGeneForward (5′ to 3′)Reverse (5′ to CCACATCATCGCCCTAACTATCGGGACCAT
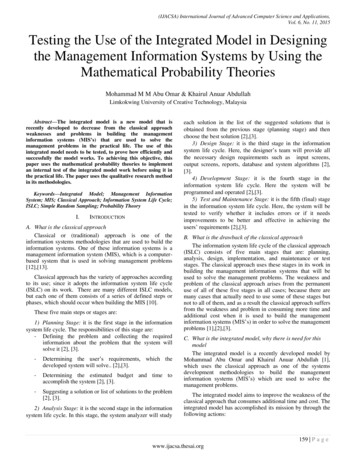
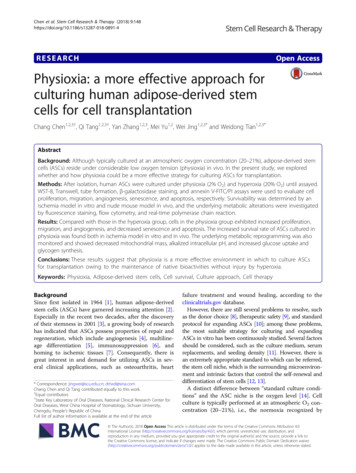
Chen et al. Stem Cell Research & Therapy (2018) 9:148Real-time polymerase chain reaction (RT-PCR)RNA was extracted using RNAiso Plus (TaKaRa Biotechnology, Dalian, Liaoning, China) according to the manufacturer’s instructions, followed by cDNA synthesis using aFirst Strand cDNA Synthesis Kit (Thermo Fisher Scientific,Waltham, MA, USA). Quantitative RT-PCR was performedusing the Eco Real-Time PCR System (Illumina, San Diego,CA, USA) and SYBR Premix Ex Taq (TaKaRa Biotechnology, Dalian, Liaoning, China) with the following conditions:2 min at 95 C, followed by 40 cycles of 5 s at 95 C and30 s at 60 C. The relative expression levels were calculatedby the 2-ΔΔct method and normalized to the housekeepinggene HPRT. The primer sequences are displayed in Table 1.Cell survivalThe survival assay was conducted as previously described[31]. Briefly, four harsh conditions (ischemic [1% O2,Page 4 of 12pH 6.4 and 0.56 μM glucose], hypoxic [1% O2, pH 7.4 and5.6 μM glucose], acidic [20% O2, pH 6.4 and 5.6 μMglucose], and nutrient-depleted [20% O2, pH 7.4 and0.56 μM glucose] environments) were generated usinga modular chamber (Sanyo, Osaka, Japan) icacid-buffered Tyrode’s solution. After incubating theASCs for 24 h on 96-well plates (1 104 per well),live/dead staining and WST-8 were applied to determine the survival of the P-ASCs and H-ASCs.Intracellular pH detectionASCs (1 104) on 96-well plates were stained with 5 yfluorescein,acetoxymethyl ester (BCECF-AM, Millipore, Billerica,MA, USA) for 30 min at 37 C. A Multimode Reader(Thermo Fisher Scientific, Waltham, MA, USA) wasFig. 1 Characterization of P-ASCs and H-ASCs. Human ASCs were cultured under physioxia (2% O2, P-ASCs) or hyperoxia (20% O2, H-ASCs) for theentire in vitro period until assayed at passage 3. a Flow cytometry was applied to demonstrate the immunophenotype of P-ASCs and H-ASCs. bMorphology of ASCs cultured in α-modified Eagle’s medium (α-MEM) with 10% fetal bovine serum (FBS). c After inducing adipogenesis for 7 days, lipidclusters were stained by oil red O. d Oil red O staining was quantified by the ratio of oil red O area to total image area for three fields. Data arepresented as the mean SD, *P 0.05. e Western blot of hypoxia-inducible factor 1 (HIF-1) and β-actin (reference gene) expression. Scale bar 50 μm.ASCs adipose-derived stem cells, H-ASCs hyperoxia ASCs, P-ASCs physioxia ASCs
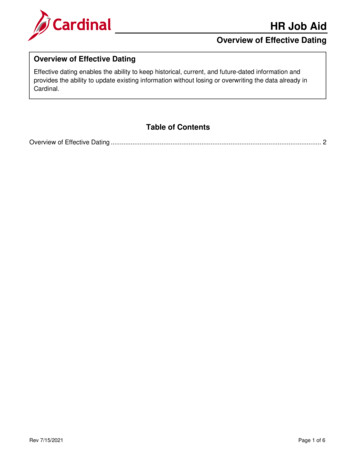
Chen et al. Stem Cell Research & Therapy (2018) 9:148employed to measure the intracellular pH at excitationand emission wavelengths of 500 nm and 530 nm, respectively. A calibration curve was produced by dyeingASCs with 5 μM BCECF-AM for 30 min, with subsequent application of an Intracellular pH CalibrationBuffer Kit (Thermo Fisher Scientific, Waltham, MA,USA) under different pH values (4.5, 5.5, 6.5, and 7.5) inthe presence of 10 μM K /H ionophore nigericin(Thermo Fisher Scientific, Waltham, MA, USA).Page 5 of 12PAS stainingWe used PAS staining to explore the different expression levels of glycogen in P-ASCs and H-ASCs. Cellson six-well plates were fixed with 4% paraformaldehyde and incubation for 5 min with 0.5% periodicacid (Solarbio, Beijing, China), followed by Schiff ’s reagent for 15 min. After the cells were imaged, thePAS area was quantified by ImageJ (NIH, Bethesda,MD, USA).Fig. 2 Physioxia enhanced ASC proliferation and migration through ROS upregulation. a The proliferation of P-ASCs and H-ASCs measured byWST-8 and cell doubling curves. b and d P-ASCs were treated with 100 μM BHA to inhibit ROS, as detected by flow cytometry. The relative MFIwas quantified by the ratio of the MFI for P-ASCs and P-ASCs (BHA) to that of H-ASCs. c The proliferation of P-ASCs, H-ASCs and P-ASCs (BHA)measured by WST-8 and cell doubling curves. e Transwell assays were used for determining cell migration, and the migrated cells were stainedby 0.1% crystal violet. f The crystal violet in migrated cells was extracted by 10% acetic acid, and the optical density values were determined. Thecell doubling curve was produced by dividing the cell number by 104 and then transforming the values to log2. Data are presented as the mean SD, *P 0.05, **P 0.01, Student’s t tests, scale bar 100 μm. ASCs adipose-derived stem cells, BHA butylated hydroxyanisole, H-ASCs hyperoxiaASCs, MFI mean fluorescence intensity, P-ASCs physioxia ASCs, ROS reactive oxygen species
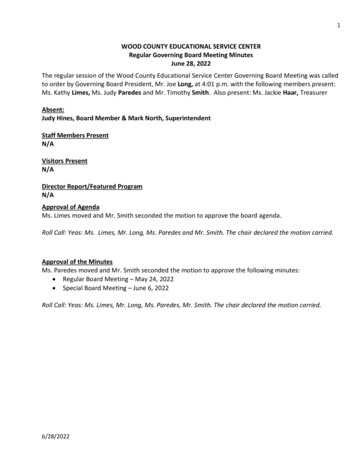
Chen et al. Stem Cell Research & Therapy (2018) 9:148Page 6 of 12Extracellular lactate assayStatisticsThe lactate content of the culture medium was measuredusing a Lactate Assay Kit (KeyGEN, Nanjing, Jiangsu,China) according to the manufacturer’s protocol.Data were analyzed with GraphPad Prism 5.02 (GraphPadSoftware, San Diego, CA, USA) and are expressed as themean standard deviation. Unpaired Student’s t tests wereperformed, and statistical significance was consideredat P 0.05. At least three replicates were analyzed ineach experiment.In vivo experimentFibrin gel and TdT-mediated dUTP-biotin nick end labeling (TUNEL) assays were conducted as previouslydescribed [31]. The fibrin gel was composed of 25 mg/mLfibrinogen, 20 mM CaCl2, and 2.5 U/mL thrombin. Thecells (1 106) were mixed with 80 μL of fibrin gel andsubcutaneously transplanted into the dorsum of nudemice under deep anesthesia. After 24, 48 and 72 h, theconstructs were removed and immediately fixed with4% paraformaldehyde for paraffin embedding. Subsequently, 5-μm-thick sections were cut and subjected toTUNEL assay using an In Situ Cell Death Detection Kit(KeyGEN, Nanjing, Jiangsu, China) to measure the ASCdeath. The number of TUNEL cells was analyzedusing Image-Pro Plus. Animal studies were conductedaccording to the protocol approved by the EthicsCommittee of the State Key Laboratory of OralDiseases, West China School of Stomatology, SichuanUniversity, China.ResultsIdentification of P-ASCs and H-ASCsFlow cytometric analysis indicated that the P-ASCs(physioxia ASCs) and H-ASCs (hyperoxia ASCs) werepositive for CD73, CD90, and CD105 and negative forCD31, CD34, and HLA-DR (Fig. 1a). Both the P-ASCsand H-ASCs exhibited a typical spindle-shaped morphology (Fig. 1b) and adipogenic ability (Fig. 1c and d).Compared with the H-ASCs, the P-ASCs exhibited upregulated HIF-1 protein expression, as determined byWestern blotting (Fig. 1e).Physioxia enhanced ASC proliferation and migrationthrough ROS upregulationUsing WST-8 and cell doubling curves, P-ASCs exhibited increased proliferation (Fig. 2a) accompanied by anincreased ROS level (Fig. 2b and d). After ROSFig. 3 Physioxia inhibited ASC senescence and apoptosis. a Microscopy images of senescent cells shown by SA-β-Gal staining. b SA-β-Gal stainingresults were quantified by the ratio of SA-β-Gal area to the total image area for three fields. c Cell apoptosis measured by flow cytometry usingannexin V-FITC/PI double staining. Q1-UL, mechanical error; Q1-UR, late apoptotic or necrotic cells; Q1-LL, viable cells; Q1-LR, early apoptotic cells. dThe ratio of viable cells acquired from Q1-LL. Data are presented as the mean SD, * P 0.05, ** P 0.01, Student’s t tests, scale bar 20 μm. ASCsadipose-derived stem cells, H-ASCs hyperoxia ASCs, P-ASCs physioxia ASCs, SA-β-Gal senescence-associated β-galactosidase
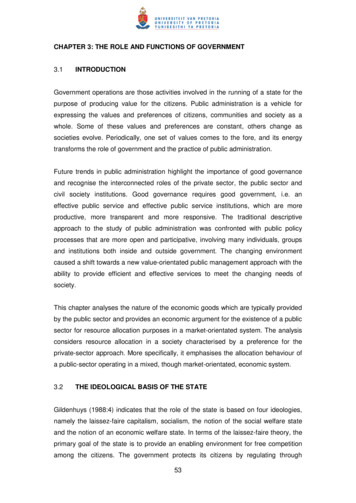
Chen et al. Stem Cell Research & Therapy (2018) 9:148inhibition in P-ASCs by BHA (Fig. 2b, d), the enhancedP-ASC proliferation was decreased (Fig. 2c). Similarly,the Transwell assay (Fig. 2e, f ) revealed reduced migration in H-ASCs and P-ASCs (BHA).Physioxia inhibited ASC senescence and apoptosisSA-β-Gal staining revealed that physioxia inhibited ASCsenescence (Fig. 3a), with a significant difference in theSA-β-Gal area (1.53 0.22% vs. 6.50 0.40%, P 0.01,Fig. 3b). Cell viability was significantly increased underphysioxia compared with hyperoxia (95.27 0.50% vs.91.33 0.85%, P 0.05, Fig. 3c, d).Angiogenic activities of ASCs were promoted underphysioxiaTube formation induced by Matrigel was employed toexamine the angiogenic activities of the cells. TheP-ASCs generated more meshes than the H-ASCs(Fig. 4a), and statistical analysis revealed significantly increased total mesh (Fig. 4b), branching length (Fig. 4c)and junction (Fig. 4d) values for P-ASCs than forH-ASCs (2.20-, 1.29-, and 1.41-fold greater, respectively).RT-PCR showed increased expression of the angiogenicgenes vascular endothelial growth factor (VEGF), vascular endothelial growth factor receptor 2 (VEGF-R2) andvon Willebrand factor (vWF) (Fig. 4e) in P-ASCs.Page 7 of 12Survival of P-ASCs was strengthened under ischemicconditionAfter incubation in an ischemic environment (Fig. 5a)for 24 h, P-ASCs showed increased survival (Fig. 5B)and decreased death rates (Fig. 5A). A minor butsignificant difference was also detected under the hypoxic (Fig. 5b), acidic (Fig. 5c), and nutrient-depleted conditions (Fig. 5d).Variations in mitochondrial and pH metabolism of ASCsunder physioxiaBy NAO staining, we measured a 43% decrease in themitochondrial mass of P-ASCs (Fig. 6a, b), and theextracellular lactate concentration was much highercompared with that of H-ASCs (7.07 0.54 vs. 4.60 0.16,P 0.05, Fig. 6d). Underlying these changes was the apparently upregulated mRNA expression of BCL2/adenovirusE1B 19 kDa protein-interacting protein 3 (BNIP3), cytochrome c oxidase subunit 4 isoform 2 (COX4I2), pyruvatedehydrogenase kinase 1 (PDK1) and lactate dehydrogenase A (LDHA), as detected by RT-PCR (Fig. 6c).Cells were treated under acidic conditions (pH 6.4) for24 h, and distinct alkalization in H-ASCs was determined by intracellular pH detection (7.48 0.15 vs. 6.61 0.17, P 0.05, Fig. 6e). Additionally, the transcriptlevels of sodium-hydrogen exchangers (NHE2 andFig. 4 Physioxia promoted angiogenic ability of ASCs. ASCs (2 104) were seeded onto 96-well plates coated with 50 μL of Matrigel and culturedfor 6 h. a Mesh-like structures resulting from tube formation assay. b, c and d Total mesh, branching length, and junction values per field of viewwere quantified by ImageJ. Five fields were quantified. e Expression levels of mRNA encoding VEGF, VEGFR2, and vWF as measured by qRT-PCR.Data are presented as the mean SD, *P 0.05 (P-ASCs/H-ASCs), **P 0.01 (P-ASCs/H-ASCs), Student’s t tests, n 3, scale bar 100 μm. ASCsadipose-derived stem cells, H-ASCs hyperoxia ASCs, P-ASCs physioxia ASCs, qRT-PCR quantitative real-time polymerase chain reaction, VEGF vascularendothelial growth factor, VEGFR2 vascular endothelial growth factor receptor 2, vWF von Willebrand factor
Chen et al. Stem Cell Research & Therapy (2018) 9:148Page 8 of 12Fig. 5 Physioxia improved ASC survivability under ischemic conditions. ASCs (1 104) were seeded onto 96-well plates and incubated in fourhostile environments for 24 h: (a) ischemic model, 1% O2, pH 6.4 and 0.56 μM glucose; (b) hypoxic model, 1% O2, pH 7.4 and 5.6 μM glucose; (c)acidic model, 20% O2, pH 6.4 and 5.6 μM glucose; (d) nutrient-depleted model, 20% O2, pH 7.4 and 0.56 μM glucose. (A) Fluorescent imagesshowing the cell death rate by live/dead cell staining. The cell death rate was obtained by the ratio of dead cells to total cells. Three fields werequantified. (B) The cell survival rate was detected by WST-8 presented as the ratio of OD24 to OD0. Data are presented as the mean SD, *P 0.05,**P 0.01, Student’s t tests, scale bar 200 μm. ASCs adipose-derived stem cells, H-ASCs hyperoxia ASCs, OD0, optical density value at 0 h, OD24, opticaldensity value at 24 h, P-ASCs, physioxia ASCsNHE3), carbonic anhydrase 9 (CAR9) and monocarboxylate transporter 4 (MCT4) were increased.Ascending glucose uptake and reserve in P-ASCsP-ASCs showed significantly increased glucose uptake,as measured by 2NBDG staining (1.20-fold greater,Fig. 7a, b), along with augmented mRNA levels of glucose transporters (GLUT1 and GLUT3), as demonstrated by RT-PCR (Fig. 7d). Increased glycogen reserveswere found in P-ASCs, as detected by PAS staining(Fig. 7c), and the expression of glycogen synthesis (phosphoglucomutase [PGM] and glycogen synthase 1 [GYS1])and breakdown genes (liver isoform of glycogen phosphorylase [PYGL]) were also upregulated (Fig. 7d).Increased survivability of P-ASCs in vivoThe number of dead cells 24, 48, and 72 h after implantation with fibrin gel was detected by TUNEL assay (Fig. 8a);compared to H-ASCs (47.46 8.58%, 57.35 7.41% and63.70 3.32%), P-ASCs (18.04 3.13%, 27.56 2.20% and27.62 5.13%) showed a significantly lower death rate(Fig. 8b).DiscussionOffering safe and effective cell therapy products for clinical applications is consistent with good manufacturingpractice (GMP) guidelines, which should be followedduring the entire process of isolating, expanding andtransplanting ASCs [32]. The present study comparedASCs cultured under hyperoxia (20% O2) and physioxia(2% O2, oxygen concentration in situ) and provides compelling evidence that the latter could be a more effectiveapproach owing to the advantages of retaining cell proliferation, migration, survival in ischemia and angiogenesis, and suppressing senescence and apoptosis.There are no differences between P-ASCs and H-ASCsin terms of immunophenotype, morphology or adipogenesis, and a previous study [25] revealed that culturingASCs under physioxia does not increase the risk oftumourigenesis associated with ASCs, indicating thatP-ASCs are safe for clinical therapy. Physioxia promotedcell proliferation and migration, and many studies haveattributed this effect to the stabilization of HIF-1 in thelack of O2 [33, 34]. However, the ROS level was also increased in P-ASCs, suggesting that transient physioxia
Chen et al. Stem Cell Research & Therapy (2018) 9:148Page 9 of 12Fig. 6 Variations in mitochondrial and pH metabolism of P-ASCs. a and b Fluorescent images and flow cytometry results of mitochondrial massdetermined by staining ASCs with NAO; the relative MFI was determined as the MFI of P-ASCs versus that of H-ASCs. c Expression of HIF-1 targetgenes evaluated by qRT-PCR. d Extracellular lactate concentration of P-ASCs and H-ASCs. e Cells cultured in the acidic model for 24 h were stained withBCECF-AM to determine the intracellular pH. Data are presented as the mean SD, *P 0.05 (P-ASCs/H-ASCs), **P 0.01 (P-ASCs/H-ASCs), Student’s t tests,n 3, scale bar 100 μm. ASCs adipose-derived stem cells, BCECF-AM uorescein, acetoxymethyl ester, BNIP3BCL2/adenovirus E1B 19 kDa protein-interacting protein 3, mitophagy regulator, COX4I1 cytochrome c oxidase subunit 4 isoform 2, metabolic enzyme,COX4I2 cytochrome c oxidase subunit 4 isoform 2, metabolic enzyme, H-ASCs hyperoxia ASCs, LDHA lactate dehydrogenase A, glycolysis,MCT4 monocarboxylate transporter 4, lactate discharge, NAO nonyl acridine orange, NHE2 sodium-hydrogen exchanger 2, H discharge,NHE3 sodium-hydrogen exchanger 3, H discharge, P-ASCs physioxia ASCs, PDK1 pyruvate dehydrogenase kinase 1, inactivating pyruvate dehydrogenasecan restore proliferation and migration through the augmentation of ROS [35]. Furthermore, we showed thatwithout the injury caused by hyperoxia, physioxia is anappropriate condition for maintaining ASC proliferationand migration.The relationship between physioxia and ROS is complicated [36]. In principle, HIF-1 decreases the ROS level[37, 38], which should be lower in P-ASCs, but the results show the opposite effect. The underlying mechanism remains unknown, especially in stem cells.Many studies have shown the ability of HIF-1 to enhance angiogenesis under transient physioxia [39, 40],but consistent with most studies on physioxia andASCs, the cells were isolated from a physioxic nicheand then cultured under atmospheric hyperoxia, whichcould injure the bioactivity of the cells. Thus, the discrepancy of such bioactivity between P-ASCs andH-ASCs is not due to the acceleration of physioxia butreflects the damage caused by hyperoxia. Althoughtransient physioxia preconditioning would be appliedprior to transplantation for recovery, in the presentmethod, culturing cells under physioxia through the entire in vitro period may be a better approach; however,further research is required.To acquire an excellent stem cell product, cell viabilityshould also be considered. Physioxia evidently suppressed senescence and apoptosis under nonstressfulcondition. The required survival of cells implanted in anischemic environment composed of low oxygen, glucose,and pH levels is a main barrier for cell therapy [41].Thus, we established an ischemic model and observedincreased adaptability in P-ASCs; the same effect wasobserved in hypoxic, acidic, and nutrient-depleted environments, explaining the superiority of P-ASCs underthese conditions and resulting in preferable adaptabilityin an ischemic environment.The underlying mechanisms induced by HIF-1 anddescribed in a previous study using an HIF-1 activator[31] were also observed in P-ASCs, but with an inverse trend in the ROS level. Briefly, more efficient
Chen et al. Stem Cell Research & Th
the cell numbers were measured using an Automated Cell Counter (Bio-Rad, Hercules, CA, USA). Determination of reactive oxygen species (ROS), mitochondrial mass, and glucose uptake The ROS level, mitochondrial mass and glucose uptake were determined by staining with 1 μM dihydrodichloro-fluorescein diacetate (H 2DCFDA, Sigma-Aldrich, St.