Transcription
HYDE PARK CAPITALInvestment Banking Mergers & Acquisitions Capital RaisingHealthcareM&A ReportQ2 2015Member FINRA/SIPC
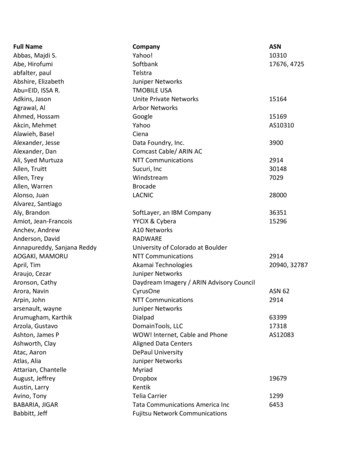
Capital Markets Overview – HealthcareSelect Public Offerings – Healthcare (Q2 2015)Commentary( in millions) Major market indices including the S&P Global Healthcare Index,Nasdaq and S&P 500 increased approximately 14%, 12% and 5%,respectively, over the 12‐month period ending June 30, 2015.As detailed in the table on the right, the equity markets displayedoverall strength and investor demand, primarily in the HealthCareTechnology and Healthcare Services sector, as several public equityofferings were successfully completed during Q2 2015.From a valuation perspective, the high‐growth HealthcareTechnology sector continued to trade at strong multiples of revenue(3.6x) and EBITDA (18.8x) along with the Healthcare Equipment &Supplies sector at multiples of revenue (3.7x) and EBITDA (14.7x).Public Market Performance (LTM)Offer DateIssuerIndustry Sector05/06/15IMS Health Holdings, Inc.Healthcare TechnologySecondary 1,40105/13/15Quintiles Transnational Holdings, Inc.Healthcare ServicesSecondary 77006/23/15Bluebird Bio, Inc.Healthcare ServicesSecondary 50006/03/15VWR Corp.Healthcare ServicesSecondary 42006/02/15Catalent, Inc.Healthcare Equipment &SuppliesSecondary 40605/20/15Press Ganey Holdings, Inc.Healthcare TechnologyIPO 22306/04/15Evolent Health, Inc.Healthcare TechnologyIPO 19606/30/15Teladoc, Inc.Healthcare ServicesIPO 15704/29/15Blueprint Medicines Corp.Healthcare TechnologyIPO 147IPO / SecondaryOffering SizePublic Company Market Performance by Sector130%MedianIndustry Sector120%13.9%11.9%Change in Stock PriceEnterprise Value / LTM3 MonthsRevenue12 monthsEBITDAHealthcare Facilities20.0%46.4%1.5x10.1xHealthcare Services(1.5%)16.0%1.9x10.3xManaged care Technology100%Healthcare Equipment & SuppliesHealthcare Distribution90%Jun‐14Source: S&P Capital IQSep‐14S&P 500Dec‐14NasdaqMar‐15Jun‐15S&P Global Healthcare IndexHYDE PARK CAPITALInvestment Banking Mergers & Acquisitions Capital Raising2
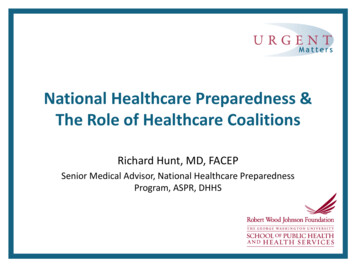
Annual Middle Market M&A Activity – HealthcareCommentary Middle Market M&A Transactions by Deal Size – HealthcareAs detailed in the table on the right, Healthcare Middle Market M&Atransaction volume and value decreased during the first half of2015 compared with 2014.( in billions)1H '14Deal Size Middle Market Healthcare deal volume decreased 24% during thefirst half of 2015 to 131 completed transactions, down from 172during the prior year period. The total value of completedtransactions decreased 21% to 15.7 billion.Volume1H '15ValueVolume% ChangeValueVolumeValueLess than 100M 100 ‐ 499M 500 ‐ 999M115507 4.2 11.2 4.693317 3.5 7.6 4.7(19%)(38%)0%(17%)(32%)1%Total Middle Market172 20.0131 0%100%100%100%% of Middle MarketTransactions valued between 100 million and 499 million sawthe largest decline during the first half of 2015 as deal volume in therange decreased 38% over the first half of 2014; while the value ofcompleted deals in this range decreased 32%.Less than 100M 100 ‐ 499M 500 ‐ 999MTotal Middle MarketU.S. Middle Market M&A Activity – Annual Trends: VOLUMETotal Transaction VolumeTotal Transaction Value ( in billions)U.S. Middle Market M&A Activity – Annual Trends: VALUELess than 100M 100 ‐ 499M 500 ‐ 1,000MLess than 100M 100 ‐ 499M 500 ‐ 1,000MSource: S&P Capital IQ (middle market includes all closed deals with disclosed deal value between 10 million and 1 billion).HYDE PARK CAPITALInvestment Banking Mergers & Acquisitions Capital Raising3
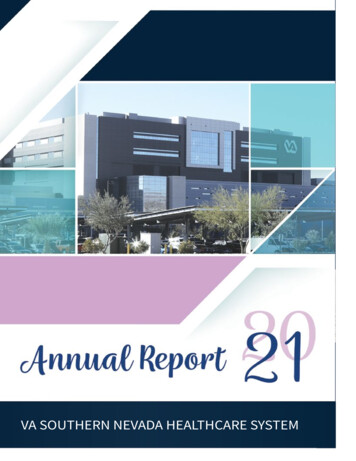
Quarterly Middle Market M&A Activity – HealthcareMiddle Market M&A Transactions by Deal Size – HealthcareCommentary( in billions) As detailed in the table on the right, Healthcare M&A transactionvalue declined during Q2 2015 compared to the prior year period.Q2 2014Deal SizeThe number of Middle Market Healthcare deals decreased 33% to53 closed transactions in Q2 2015 compared to 79 in Q2 2014.The total value of completed transactions fell 42% to 6.5 billion,down from 11.2 billion during the prior year period.VolumeQ2 2015ValueVolume% ChangeValueVolumeValueLess than 100M 100 ‐ 499M 500 ‐ 999M47266 1.8 5.4 4.035153 1.3 3.2 2.0(26%)(42%)(50%)(28%)(40%)(51%)Total Middle Market79 11.253 %100%100%100%% of Middle Market Transactions valued less than 100 million saw the smallestdecline during Q2 2015. During the quarter, transactions in thisrange represented 66% of total deal volume, an increase from59% in the prior year period.Less than 100M 100 ‐ 499M 500 ‐ 999MTotal Middle MarketU.S. Middle Market M&A Activity – Quarterly Trends: VALUETotal Transaction VolumeTotal Transaction Value ( in billions)U.S. Middle Market M&A Activity – Quarterly Trends: VOLUMELess than 100M 100 ‐ 499M 500 ‐ 1,000MLess than 100M 100 ‐ 499M 500 ‐ 1,000MSource: S&P Capital IQ (middle market includes all closed deals with disclosed deal value between 10 million and 1 billion)HYDE PARK CAPITALInvestment Banking Mergers & Acquisitions Capital Raising4
Recent M&A Activity – HealthcareSelect Announced M&A Transactions (Q2 2015)( in millions)EnterpriseValue ( mm)EV /RevenueEV /EBITDAAnnounced DateTargetBuyerIndustry06/29/15CBR Systems, Inc.AMAG Pharmaceuticals, Inc.Healthcare Services 700.05.7xNA06/29/15Spinifex Pharmaceuticals Inc.Novartis International AGPharmaceuticals,Biotechnology & Life Sciences 700.0NANA06/28/15TEI Biosciences Inc.Integra LifeSciences Corp.Healthcare Technology 210.73.3xNA06/24/15Van Buren Street LLCSabra Health Care Northeast, LLCHealthcare Facilities 175.2NANA06/24/15General Econopak, Inc.Steris Corp.Healthcare Services 175.0NANA06/20/15Cigna Corp.Anthem, Inc.Managed Healthcare 50,507.91.4x12.9x06/18/15Viroxis Corp.TFS Corp. Ltd.Pharmaceuticals,Biotechnology & Life Sciences 173.3NANA06/17/15Kythera Biopharmaceuticals, Inc.Allergan plcPharmaceuticals,Biotechnology & Life Sciences 1,945.2NANA06/17/15Welch Allyn, Inc.Hill‐Rom Holdings, Inc.Healthcare Equipment 2,051.0NANA06/15/15Revera Inc.Genesis Healthcare, Inc.Healthcare Facilities 240.0NANA06/11/15Reliant Hospital Partners, LLCHealthsouth Corp.Healthcare Facilities 730.02.9x8.9x06/05/15The Harvard Drug Group, L.L.C.Cardinal Health, Inc.Healthcare Services 1,115.02.5xNA06/04/15Bio‐Reference Laboratories Inc.Opko Health, Inc.Healthcare Services 1,516.01.7x13.1x06/04/15Parion Sciences, Inc.Vertex Pharmaceuticals Inc.Pharmaceuticals,Biotechnology & Life Sciences 940.0NANA05/27/15Retrophin, Inc.SanofiPharmaceuticals,Biotechnology & Life Sciences 245.0NANA05/21/15Omnicare, Inc.CVS Pharmacy, Inc.Healthcare Services 11,308.91.7x15.0xSource: S&P Capital IQ.HYDE PARK CAPITALInvestment Banking Mergers & Acquisitions Capital Raising5
Recent M&A Activity – HealthcareSelect Announced M&A Transactions (Q2 2015)( in millions)EnterpriseEV /EV /Value ( mm)RevenueEBITDAAnnounced DateTargetBuyerIndustry05/19/15Achillion Pharmaceuticals, Inc.Janssen Pharmaceuticals, Inc.Pharmaceuticals,Biotechnology & Life Sciences 905.0NANA05/18/15Par Pharmaceutical Holdings, Inc.Endo International plcPharmaceuticals,Biotechnology & Life Sciences 10,203.37.4x21.7x05/15/15IgDraSol, Inc.NantPharma, LLCPharmaceuticals,Biotechnology & Life Sciences 1,290.1NANA05/12/15Virtual Radiologic Corp.MEDNAX, Inc.Healthcare Services 500.02.7xNA05/11/15Acclaris, Inc.Extend Health, Inc.Health Care Technology 140.0NANA05/06/15Synageva BioPharma Corp.Alexion Pharmaceuticals, Inc.Pharmaceuticals,Biotechnology & Life Sciences 8,245.0NANA05/04/15Animal Health International, Inc.Patterson Co., Inc.Healthcare Services 1,100.00.7x16.2x04/27/15Quanticel Pharmaceuticals, Inc.Celgene Corp.Pharmaceuticals,Biotechnology & Life Sciences 0.0NANA04/20/15Spinal Modulation, Inc.St. Jude Medical Inc.Healthcare Equipment 0.0NANA04/15/15Care Retirement CommunitiesFountains Portfolio Owner, LLCHealthcare Facilities 639.3NANA04/08/15MedExpress Urgent Care, PLLCOptum, Inc.Healthcare Facilities 1,500.0NANA04/06/15AHS Medical Holdings, LLCVentas, Inc.Healthcare Facilities 1,750.00.9xNASource: S&P Capital IQ.HYDE PARK CAPITALInvestment Banking Mergers & Acquisitions Capital Raising6
M&A Activity by Healthcare SectorU.S. Middle Market M&A Activity by Healthcare Sector: VOLUME% ChangeHealthcare Facilities241414*Healthcare ServicesHealthcare Technology7Healthcare Equipment & Supplies7%15922%126Pharmaceuticals, Biotechnology & Life Sciences50%2011042%510Q2 2014152045%2530Q2 2015% ChangeU.S. Middle Market M&A Activity by Healthcare Sector: VALUE( in billions) 1.2Healthcare Facilities92% 2.2 1.8 1.9*Healthcare Services5% 0.8Healthcare Technology44% 0.5 2.1Healthcare Equipment & Supplies72% 0.676% 5.3Pharmaceuticals, Biotechnology & Life Sciences 1.3 0.0 1.0Q2 2014 2.0 3.0 4.0 5.0 6.0Q2 2015Source: S&P Capital IQ (includes all closed deals with disclosed deal value between 10 million and 1 billion). *Managed Healthcare transactions are included in the Healthcare Services sector.HYDE PARK CAPITALInvestment Banking Mergers & Acquisitions Capital Raising7
Private Equity Activity – HealthcareSelect Announced Private Equity M&A Transactions (Q2 2015)Commentary( in millions)As detailed in the chart to the right, financial sponsors were activeacross many sectors of the Healthcare industry during Q2 2015. Several notable private equity deals were announced during thequarter, including: ABRY Partners, LLC’s proposed purchase ofFastMed Urgent Care, Fortess Investment Group, LLC’s acquisitionof Logan Watermark Partners for 65 million, and Summit PartnersLLP’s purchase of Paradigm Management Services, LLC.AnnouncedTargetBuyerIndustry06/30/15Precyse Solutions, LLCPamplona CapitalManagement LLPHealthcare TechnologyNA06/25/15Park Slope Pediatric MedicinePharos Capital Group, LLCHealthcare ServicesNA06/24/15Katena Products, Inc.Golub CapitalHealthcare Equipment &SuppliesNA06/22/15Alvogen, Inc.CVC Capital Partners Ltd.BiotechnologyNA06/11/15Sunrise Medical, Inc.Nordic CapitalHealthcare TechnologyNA06/08/15Sunspire Health LLCKohlberg & Co., LLCHealthcare FacilitiesNA06/02/15McKesson Corp.,(Care Management Business)Comvest PartnersHealthcare ServicesNA06/01/15Advanced MedicalPersonnel Services, Inc.Clearview Capital, LLCHealthcare ServicesNA05/21/15FastMed Urgent CareABRY Partners, LLCHealthcare FacilitiesNA05/20/15Logan WatermarkPartners LPFortress InvestmentGroup, LLCHealthcare Facilities 6505/04/15Sentry Data Systems, Inc.ABRY Partners, LLCHealthcare TechnologyNA05/04/15Paradigm ManagementServices, LLCSummit Partners LLPHealthcare ServicesNA04/28/15HealthcareSource HR, Inc.Francisco PartnersManagement, LLCHealthcare TechnologyNA04/24/15Paragon Billing LLCSyncordia TechnologiesHealthcare Services 304/20/15VetCor, Inc.Harvest Partners, LP /Cressey & Co., LPHealthcare FacilitiesNA04/07/15Chicagoland Smile GroupShore Capital PartnersHealthcare ServicesNA2nd During Q2 2015, financial sponsors were most active in theHealthcare Facilities and Healthcare Services sectors, announcing 18and 9 transactions, respectively. Financial Sponsors Activity by Sector2012984Value ( mm)1816Transaction VolumeEnterpriseDate3210HealthcareEquipment &SuppliesHealthcareTechnologyHealthcare Facilities Pharmaceuticals,Biotechnology, &Life SciencesHealthcare ServicesSource: S&P Capital IQ. *Includes transactions with undisclosed transaction values.HYDE PARK CAPITALInvestment Banking Mergers & Acquisitions Capital Raising8
Industry Sector Overview – Recent Stock Price PerformanceCommentaryHealthcare FacilitiesThe charts included on the following pages detail the recent stockprice performance by sector for the leading public companieswithin the Healthcare industry for the 12‐month period endedJune 30, 2015. The shaded section is the most recent 3‐monthperiod (Q2). For the 12‐month period, all sector indices in the Healthcareindustry increased, led by the Managed Healthcare and HealthcareFacilities sectors (up 54% and 46%, respectively). During the 3‐month period ended June 30, 2015, several sector indicesincreased, led by the Healthcare Facilities and Managed Healthcaresectors (up 20% and 9%, respectively). 14Dec‐14S&P 500Healthcare ServicesMar‐15Jun‐15Healthcare FacilitiesManaged &P 500Mar‐15Healthcare ServicesJun‐1590%Jun‐14Sep‐14Dec‐14S&P 500Mar‐15Jun‐15Managed HealthcareSource: S&P Capital IQHYDE PARK CAPITALInvestment Banking Mergers & Acquisitions Capital Raising9
Industry Sector Overview – Recent Stock Price PerformanceHealthcare TechnologyHealthcare Equipment & 4.6%100%90%Jun‐14Sep‐14Dec‐14S&P 500Mar‐1590%Jun‐14Jun‐15Healthcare TechnologySep‐14S&P 500Dec‐14Mar‐15Jun‐15Healthcare Equipment & SuppliesHealthcare 14Sep‐14Dec‐14S&P 500Mar‐15Jun‐15Healthcare DistributionSource: S&P Capital IQHYDE PARK CAPITALInvestment Banking Mergers & Acquisitions Capital Raising10
Industry Sector Overview – Public Company Analysis( in millions, except per share)Healthcare Facilities% of 52Week HighEquityValueEnterpriseValueRevenueLTMGross ProfitEBITDALTM MarginsGross ProfitEBITDAEnterprise Value /LTMRevenueEBITDACompanyTickerClosing Price6/30/15HCA Holdings, Inc.Community Health Systems, Inc.Tenet Healthcare Corp.Universal Health Services, Inc.HEALTHSOUTH Corp.Lifepoint Hospitals, Inc.AmSurg Corp.Select Medical Holdings Corp.Hanger Orthopedic Group, Inc.HCACYHTHCUHSHLSLPNTAMSGSEMHGR 90.72 62.97 57.88 142.10 46.06 86.95 69.95 16.20 23.4497%97%91%99%96%100%96%94%72% 39,818 7,275 5,850 14,329 4,650 4,030 3,325 2,066 833 70,423 24,454 22,111 17,633 6,980 5,936 6,283 4,823 1,368 38,429 19,491 17,568 8,576 2,678 4,963 2,297 3,165 1,061 14,540 7,606 6,365 3,616 1,181 1,668 972 592 354 7,699 2,917 2,187 1,585 622 628 608 367 2x9.5x10.3x13.1x8.8xAverage94% 9,131 17,779 10,914 4,099 1,86336.4%17.2%1.8x10.2xMedian96% 4,650 6,980 4,963 1,668 62837.8%15.0%1.5x10.1x% of 52Week HighEnterpriseValueRevenueLTMGross ProfitEBITDAHealthcare ServicesEquityValueLTM MarginsGross ProfitEBITDAEnterprise Value /LTMRevenueEBITDACompanyTickerClosing Price6/30/15DaVita, Inc.Laboratory Corp. of America HoldingsQuest Diagnostics, Inc.MEDNAX, Inc.Bio‐Reference Laboratories, Inc.RadNet, Inc.Alliance Healthcare Services, Inc.DVALHDGXMDBRLIRDNTAIQ 79.47 121.22 72.52 74.11 41.25 6.69 18.6993%92%81%98%88%65%60% 17,294 11,183 10,515 7,187 1,149 298 202 25,692 17,367 14,143 8,414 1,194 941 782 13,290 7,056 7,551 2,593 882 755 448 3,788 2,548 2,902 886 418 165 199 2,415 1,414 1,469 589 116 101 x10.6x12.3x9.6x14.3x10.3x9.3x6.8xAverage83% 6,833 9,791 4,654 1,558 88835.8%18.9%2.0x10.5xMedian88% 7,187 8,414 2,593 886 58936.1%19.5%1.9x10.3xSource: S&P Capital IQ.HYDE PARK CAPITALInvestment Banking Mergers & Acquisitions Capital Raising11
Industry Sector Overview – Public Company Analysis( in millions, except per share)Managed HealthcareClosing Price% of 52EquityEnterpriseWeek HighValueValueLTMEnterprise Value /LTMLTM MarginsRevenueGross ProfitEBITDAGross Profit 128,562 50,031 45,800 24,469 9,022 3,408 2,571 1,873 985 787 138,211 59,724 36,644 52,131 18,548 13,719 15,602 4,044 11,619 1,947 35,796 16,004 14,177 10,459 3,531 1,699 2,402 274 1,633 353 12,292 5,159 3,930 2,596 732 402 380 233 416( 4x12.3x8.5x6.8x8.1x2.4xNM 26,060 26,751 35,219 8,633 2,61319.7%5.1%0.5x8.8x 7,457 6,215 17,075 2,966 57418.6%4.5%0.5x9.4xEnterpriseValueRevenueLTMGross ProfitEBITDACompanyTicker6/30/15Unitedhealth Group, Inc.Aetna, Inc.Cigna Corp.Humana, Inc.Centene Corp.WellCare Health Plans, Inc.Health Net, Inc.Magellan Health Services, Inc.Molina Healthcare, Inc.Universal American Corp.UNHAETCIHUMCNCWCGHNTMGLNMOHUAM 122.00 127.46 162.00 191.28 80.40 84.83 64.12 70.07 70.30 10.1298%95%95%87%98%89%98%96%95%91% 118,645 45,127 42,581 29,328 9,825 3,755 5,089 1,871 3,545 829Average94%Median95%% of 52Week HighEBITDARevenueEBITDAHealthcare TechnologyEquityValueLTM MarginsGross ProfitEBITDAEnterprise Value /LTMRevenueEBITDACompanyTickerClosing Price6/30/15Cerner Corp.Athenahealth, Inc.Medidata Solutions, Inc.Allscripts Healthcare Solutions, Inc.WebMD Health Corp.MedAssets, Inc.Quality Systems, Inc.Healthstream, Inc.Merge Healthcare, Inc.Computer Programs & Systems, Inc.CERNATHNMDSOMDRXWBMDMDASQSIIHSTMMRGECPSI 69.06 114.58 54.32 13.68 44.28 22.06 16.57 30.42 4.80 53.4291%75%92%80%83%86%88%94%77%80% 24,236 4,434 3,030 2,472 1,954 1,315 1,009 866 470 590 24,301 4,618 3,010 3,066 2,149 2,146 893 726 719 553 3,812 835 366 1,373 598 750 494 189 228 193 3,214 505 277 623 363 566 272 108 141 83 1,070 62 37 80 122 219 52 31 39 5% 4,037 4,218 884 615 17661.9%16.8%4.0x17.4xMedian85% 1,634 2,147 546 320 5760.5%16.9%3.4x17.6xSource: S&P Capital IQ. *Excluded from average and median calculation.HYDE PARK CAPITALInvestment Banking Mergers & Acquisitions Capital Raising12
Industry Sector Overview – Public Company Analysis( in millions, except per share)Healthcare Equipment & SuppliesCompanyTickerMedtronic, Inc.Stryker Corp.CR Bard, Inc.The Cooper Companies, Inc.DENTSPLY International, Inc.Varian Medical Systems, Inc.Alere, Inc.Sirona Dental Systems, Inc.Steris Corp.MDTSYKBCRCOOXRAYVARALRSIROSTEClosing Price6/30/15% of 52Week HighEquityValueEnterpriseValueRevenueLTMGross ProfitEBITDALTM MarginsGross ProfitEBITDAEnterprise Value /LTMRevenueEBITDA 74.10 95.57 170.70 177.97 51.55 84.33 52.75 100.42 64.4493%97%94%94%92%87%99%98%90% 82,177 36,560 13,007 8,736 7,389 8,568 4,469 5,656 3,877 98,944 35,749 13,304 10,072 8,339 8,053 8,214 5,316 4,369 20,126 9,818 3,377 1,780 2,782 3,093 2,544 1,146 1,870 14,590 6,493 2,103 1,135 1,554 1,305 1,208 641 788 6,264 2,623 1,048 529 573 644 538 280 4.6x12.5x15.3x19.0x12.3xAverage94% 18,938 21,373 5,171 3,313 1,42856.5%25.0%3.8x15.0xMedian94% 8,568 8,339 2,782 1,305 57355.9%24.4%3.6x14.6xClosing Price6/30/15% of 52Week HighEnterpriseValueRevenueLTMGross ProfitEBITDAHealthcare DistributionCompanyTickerMcKesson Corp.Cardinal Health, Inc.AmerisourceBergen Corp.Henry Schein, Inc.Omnicare, Inc.Patterson Companies, Inc.Owens & Minor, Inc.PharMerica Corp.MCKCAHABCHSICOCRPDCOOMIPMCEquityValueLTM MarginsGross ProfitEBITDAEnterprise Value /LTMRevenueEBITDA 224.81 83.65 106.34 142.12 94.25 48.65 34.00 33.3092%91%88%97%98%94%94%98% 52,830 28,023 23,477 12,061 9,885 4,850 2,116 1,035 58,507 28,899 24,672 13,319 11,674 5,176 2,489 1,364 183,115 102,531 132,080 10,419 6,629 4,375 9,691 2,003 11,484 5,712 3,363 2,950 1,409 1,238 1,205 347 4,237 2,642 1,544 890 770 429 258 e94% 16,785 18,263 56,355 3,464 1,36315.3%5.7%0.7x12.8xMedian94% 10,973 12,497 10,055 2,180 83014.9%4.7%0.5x12.9xSource: S&P Capital IQ.HYDE PARK CAPITALInvestment Banking Mergers & Acquisitions Capital Raising13
HYDE PARK CAPITALIntegrity Expertise ResultsInvestment Banking Mergers & Acquisitions Capital RaisingJohn HillSenior Managing Directorhill@hydeparkcapital.com(813) 383‐0205John McDonaldSenior Managing Directormcdonald@hydeparkcapital.com(813) 383‐0206Keith HodgdonManaging Directorhodgdon@hydeparkcapital.com(813) 383‐0208Jami GoldVice Presidentgold@hydeparkcapital.com(813) 383‐0203Greg BoslVice Presidentbosl@hydeparkcapital.com(813) 597‐2649Charlie HendrickAssociatehendrick@hydeparkcapital.com(813) 383‐0207Hyde Park Capital Advisors, LLC701 N. Franklin StreetTampa, FL 33602Tel: 813‐383‐0202www.hydeparkcapital.comHYDE PARK CAPITALMember FINRA/SIPCInvestment Banking Mergers & Acquisitions Capital RaisingRecent Transactions
04/20/15 Spinal Modulation, Inc. St. Jude Medical Inc. Healthcare Equipment 0.0 NA NA . 06/25/15 Park Slope Pediatric Medicine Pharos Capital Group, LLC Healthcare Services NA 06/24/15 Katena Products, Inc. Golub Capital Healthcare Equipment & . 05/21/15 FastMed Urgent Care ABRY Partners, LLC Healthcare Facilities NA 05/20/15 Logan .