Transcription
13LC-MS INSTRUMENT CALIBRATIONFABIO GAROFOLO, PH.D.Vicuron Pharmaceuticals, Inc.13.1 INTRODUCTIONAs analytical and bioanalytical methods must be validated before using them forroutine sample analysis and after changing method parameters (see Chapter 8),instruments such as liquid chromatography coupled with mass spectrometry (LCMS) or tandem mass spectrometry (LC-MS/MS), which are utilized to performthe analysis, should be calibrated and qualified. In addition, an instrument’s performance should be tested for suitability prior to use on practically a day-to-daybasis.For Good Laboratory Practice (GLP) studies, any equipment (instrument andany computer system used with it) must be tested according to the documentedspecifications. GLP regulations, which were issued by the U.S. Food and DrugAdministration (FDA) in 1976, apply specifically to nonclinical studies used forInvestigational New Drug (IND) registration. Shortly after the FDA introducedGLP regulations, the Organization for Economic Cooperation and Development(OECD) published a compilation of Good Laboratory Practices. OECD membercountries have since incorporated GLP into their own legislation. In Europe, theCommission of the European Economic Community (EEC) has made efforts toharmonize the European laws. In general, instrument calibration is part of theregulatory compliance for worldwide drug submission. FDA GLP Chapter 21of the Code of Federal Regulations Part 58 (CFR 21 Part 58) [1] deals with theAnalytical Method Validation and Instrument Performance Verification, Edited by Chung ChowChan, Herman Lam, Y. C. Lee, and Xue-Ming ZhangISBN 0-471-25953-5 Copyright 2004 John Wiley & Sons, Inc.197
198LC-MS INSTRUMENT CALIBRATIONmaintenance and calibration of equipment, including LC-MS or LC-MS/MS. Thefollowing are excerpts:Equipment shall be adequately inspected, cleaned, and maintained. Equipment usedfor the generation, measurement, or assessment of data shall be adequately tested,calibrated and/or standardized.The written Standard Operating Procedures required under §58.81(b)(11) shall setforth in sufficient detail the methods, materials, and schedules to be used in the routine inspection, cleaning, maintenance, testing, calibration, and/or standardization ofequipment, and shall specify, when appropriate, remedial action to be taken in theevent of failure or malfunction of equipment. The written standard operating procedures shall designate the person responsible for the performance of each operation.Written records shall be maintained of all inspection, maintenance, testing, calibrating and/or standardizing operations. These records, containing the date of theoperation, shall describe whether the maintenance operations were routine and followed the written standard operating procedure.According to the GLP, SOPs are defined as procedures that contain the detailsof how specified tasks are to be conducted. The GLP definition of SOP merges theInternational Organization for Standardization (ISO) definitions of procedure andwork instructions where procedure is a general statement of policy that describeshow, when, and by whom a task must be performed; and work instructions containthe specific details of how the laboratory or other operation must be conductedin particular cases [2].In addition to GLP, any instrument used to perform analysis under GoodManufacturing Practices (GMPs), must also be covered by instrument SOPs. If aLC-MS laboratory never performs any nonclinical GLP work for FDA submission, GMP, or bioavailability/bioequivalence testing, that laboratory in theory isnot obligated to have LC-MS SOPs [3]. However SOPs are very useful becausethey provide a measure of consistency in how data are generated, processed, andarchived. This consistency has many benefits: for example, facilitating discoveryof the cause of any anomalous data that may be produced. For these reasons,many LC-MS laboratories, even though not required to be in GLP compliance,have decided to operate under these regulations and use SOPs at all times. It isimportant to clarify that the main purpose of the LC-MS SOPs is not to substitute the operator’s manuals but to ensure that a particular instrument is properlymaintained and calibrated such that any data generated from it, when operating,can be considered reliable [3].In this chapter we focus primarily on calibration of LC-MS where the massspectrometer is operating at unit resolution, resolution that is sufficient to separate two peaks one mass unit apart. This kind of low-resolution mass filtercovers almost 90 percent of the instruments commonly used for qualitativeand/or quantitative analysis of small molecules. Batch-to-batch qualification testing of the instrument is also described. For the calibration of high-resolutionmass spectrometers such as magnetic sector, TOF, or FTICR coupled with liquidchromatography, readers are referred to specific publications.
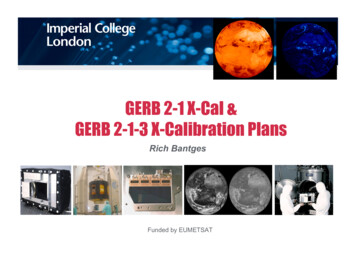
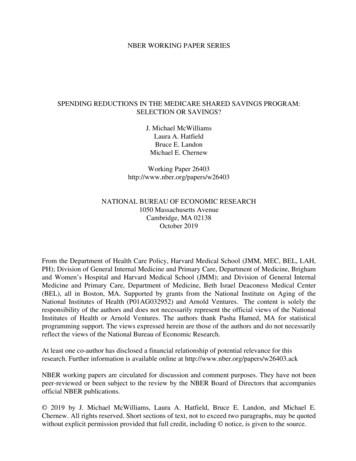
PARAMETERS FOR QUALIFICATION19913.2 PARAMETERS FOR QUALIFICATIONThe day-to-day performance of a given LC-MS or LC-MS/MS depends on itscalibration, tuning, system suitability test, and final overall validation.13.2.1 Calibration ParametersCalibration parameters are instrument parameters whose values do not vary withthe type of experiment, such as peak widths, peak shapes, mass assignment, andresolution versus sensitivity.Peak Width. Peak width depends on the mass resolution. A resolution of 1mass unit is sufficient to distinguish ions in most qualitative/quantitative smallmolecule applications. A typical definition of unit resolution is when the peakwidth at half-height is about 0.6 to 0.8 mass unit. The profile scan of ions on atypical benchtop LC-MS has a bandwidth of about 1 mass unit (Figure 13.1).Peak Shape and Profile Scan. In a typical benchtop LC-MS, abundance measurements are collected at 0.10-m/z increments, as shown in Figure 13.2. Whenthese data are presented in a mass spectrum, a single line can be shown. Theheight and position are derived from the profile scan.Mass Assignment. It is performed using specific MS calibrants. Calibrants shouldbe well-characterized reference materials. Certification and handling of these200199200201Figure 13.1. Bandwidth in a typical benchtop LC-MS.AbundanceAbundance200200199 200 201199 200 201(a)(b)Figure 13.2. (a) Profile scan and (b) spectral representation in a typical benchtop LC-MS.
200LC-MS INSTRUMENT CALIBRATIONcompounds should be documented. LC-MS qualitative analysis always uses reference materials, whereas quantitative analysis uses a combination of referencematerials and actual analyte standards as calibrants.Resolution versus Sensitivity. Mass resolution is a compromise between ionintensity and peak width. In general, as the resolution is increased, the ion intensity decreases (see Section 13.3.2).Calibration. Calibration has been defined as “a comparison of a measurementstandard or instrument of known accuracy with another standard or instrumentto eliminate deviations by adjustment” [4]. The term calibration in this chapteris used to indicate a mass-axis calibration. Other calibration (e.g., voltage ofpower supplies) is outside the scope of this chapter. Calibration of the massaxis requires a series of ions evenly spaced throughout the mass range. When acalibration is completed, it is possible to acquire data over any mass range withinthe calibrated range. It is therefore sensible to calibrate over a wide mass range.Manual, semiautomatic, and automatic LC-MS calibration require introductionof the solution of the calibrant (calibration solution) into the MS at a steady ratewhile the procedure is running. The calibration solution is introduced directly(infused) into the MS from a syringe pump or through a loop injector connectedto the LC pump. It is recommended that the MS be calibrated at least once everythree months and the calibration checked about once a week.13.2.2 Tuning ParametersTuning parameters are instrument parameters whose values can vary with the typeof experiment. For example, if the experiment requires quantitative data on oneor more particular ions, the MS should be tuned to optimize the response for thespecific analyte standard. Manual, semiautomatic, and automatic tuning proceduresrequire the introduction of a tuning solution of the analyte of interest into the MSat a steady rate. This can be done in three different ways: (1) by introducing thesolution directly from the syringe pump (direct infusion); (2) by introducing thesample from the syringe pump into the effluent of the LC by using a tee union; and(3) by injecting the sample into the effluent of the LC by using a loop injection valve[flow injection analysis (FIA)].The first method is good for tuning for experiments at a low flow rate involvingthe syringe pump. The second and third methods are useful for experiments at ahigher flow rate involving the LC. In general, the FIA gives a better evaluationof the instrument signal-to-noise ratio (S/N) at the masses of interest. In mostcases the tuning parameters obtained from the automatic or semiautomatic tuningprocedures are sufficient for many analytical experiments. However, one mustensure that proper parameters are generated. For some applications it is necessaryto do manual fine-tuning of several MS parameters.The optimized parameters, which affect the signal quality, change from instrument model to instrument model and from brand to brand. Examples are: source
CALIBRATION PRACTICES201temperature, ionization voltages, gases (nebulization, desolvation, and collision),ion path potentials (lens, multipoles, or stacked rings), collision energy, solution,or mobile-phase flow rate. The potentials, RF values, and gas pressure affect thedeclustering, focusing, fragmentation, and efficiency of ion transmission.13.2.3 System Suitability TestingSystem suitability allows the determination of system performance by analysis ofa defined solution prior to running the analytical batch. System suitability shouldtest the entire analytical system, chromatographic performance as well as thesensitivity of the mass spectrometer for the compounds of interest. Some LC-MSSOPs reference analytical methods as the source of operating details for a givenanalysis. This works particularly well for quantitative analysis, where analyticalmethods include critical details on instrument parameters and special calibrationsthat might be required for a particular analyte. Thus, system suitability testingprovides the daily [3] checking of the system.13.2.4 ValidationValidation is the final step to guarantee that a LC-MS system performs asexpected. Validation includes instrument calibration, tuning, testing, and checkingof the documentation for completeness, correctness, and compliance with SOPs.Validation consists of four separate steps:1. Validation of the instrument and the computer controlling it (computersystem validation or CSV)2. Validation of the analytical method running on that equipment3. System suitability testing, to test the equipment and the method togetherto confirm expected performance4. QA/QC review of sample analysis data collected on such a system [4]13.3 CALIBRATION PRACTICESHow often an LC-MS should be calibrated depends on the mass accuracy required.For example, instrument calibration should be verified daily when performingaccurate mass measurements of peptides and proteins. However, the quantitativeanalysis of small molecules requires less frequent calibration.13.3.1 General Tuning and Calibration Practice for MSThe mass analyzer should be calibrated on a regular basis by infusing a calibrationsolution. In general, an electrospray ionization source (ESI) is used. The solutionshould produce ions (with known exact masses) that cover the entire instrumentmass range or at least the mass range that will be used for subsequent analyses.
202LC-MS INSTRUMENT CALIBRATIONFor the most recent LC-MS on the market, an automatic procedure is includedin the software package to tune and calibrate in the ESI mode. However, olderinstruments and/or very specific applications still require manual or semiautomatic procedures to optimize the parameters that affect ion detection. In anLC-MS instrument, the mass spectrometer is tuned and calibrated in three steps:(1) ion source and transmission optimization, (2) MS calibration, and (3) finetuning (detection maximization of one or more particular ions).Ion Source and Transmission Optimization. In this step, the MS in ESI modeis roughly tuned on one or more specific ions by infusing the calibration solutionat a steady rate around 5 µL/min for several minutes. The introduction of thecalibration solution compound is best achieved using a large-volume Rheodyneinjector loop (50 or 100 µL) or an infusion pump (e.g., a Hamilton syringepump): When using a large-volume injection loop, the solvent delivery systemshould be set up to deliver around 5 µL/min of 50 : 50 acetonitrile/water or 50 : 50methanol/water through the injector into the source. An injection of 50 µL ofcalibration solution will then last for at least 10 min. When using an infusionpump, the syringe should be filled with the calibration solution and then connectedto the ESI probe with fused silica or peek tubing.The ions chosen for the optimization should be in the middle of the calibrationrange or in a specific region of interest (e.g., m/z 195 of caffeine or m/z 906.7 of PPG calibration solution). Before using the automatic tuning procedureto demonstrate that the transmission of ions into the MS is optimum, the ESIsource sprayer should be manually adjusted to establish a stable spray of ionsinto the MS and to ensure that enough ions are detected to calibrate the MS.The degree of adjustment changes from model to model and depends onthe source geometry. In general, sources where the spray is off axis with theinlet, such as orthogonal and z-spray, require fewer adjustments. For the on-axissources, to avoid the contamination of the instrument optics, it is important tocheck that the source is not spraying directly at the instrument’s orifice. Onaxis sources usually have a side window to provide a good view for the spraytrajectory. In both cases the sprayer should always be moved in small incrementsuntil reaching the optimum position for the highest S/N value of the ions ofinterest. The source parameters (e.g., nebulizer gas, lens voltages) are optimizedautomatically, semiautomatically, or manually.MS Calibration. In the second step, the MS in the ESI mode is calibrated usingthe calibration solution. All mass analyzers must be calibrated. For example,quadrapoles 1 and 3 are both calibrated for the triple-quadrupole mass spectrometer. Here is the calibration process:1. A mass spectrum of a calibration solution is acquired (calibration file)and matched against a table of the expected masses of the peaks in thecalibration solution that are stored in a reference file.2. Each peak in the reference file is matched to a corresponding peak in thecalibration file.
CALIBRATION PRACTICES2033. The corresponding matched peaks in the calibration file are the calibrationpoints.4. A calibration curve is fitted through the calibration points.5. The vertical distance of each calibration point from the curve is calculated.This distance represents the remaining (or residual) mass difference aftercalibration.6. The standard deviation of the residuals is also calculated. This number isthe best single indication of the accuracy of the calibration [5].Before starting the automated calibration, a number of the peak match parameters need to be set. These parameters determine the limits within which theacquired data must lie for the software to recognize the calibration masses andresult in a successful calibration. Some of these parameters are:1. Peak search range. This is the window used by the calibration software tosearch for the most intense peak. Increasing this window gives a greaterchance of incorrect peak matching. It is important to ensure that the correctpeak is located in the peak search range; otherwise, a deviation in thecalibration may arise. If an incorrect peak is located, the search peak rangeshould be adjusted to locate only the correct ion.2. Peak threshold. All peaks in the acquired spectrum below the intensitythreshold value (measured usually as a percentage of the most intense peakin the spectrum) will not be used in the calibration procedure.3. Peak maximum standard deviation or maximum difference between the predicted and actual mass. During calibration the difference between the measured mass in the acquired calibration file and the true mass in the referencefile is taken for each pair of matched peaks. If this value exceeds the setvalue, the calibration will fail. Reducing the value of the standard deviation gives a more stringent limit, while increasing the standard deviationmeans that the requirement is easier to meet, but this may allow incorrectpeak matching.4. Peak width. This is a measure used to set the resolution, usually specifiedat 50% of maximum intensity.If the acquired spectrum looks like the reference spectrum and all of the peaksexpected pass the criteria above, the calibration is acceptable. If the instrument hasnever been calibrated before or the previous calibration file has been misplaced,a more detailed calibration routine must be used. This calibration procedurerequires the location of known peaks, starting with the lowest mass ions. Whena peak has been located, a digital-to-analog conversion value is assigned to theexact mass of the ion.Once a full instrument calibration is in place, it is not always necessary torepeat the full calibration procedure when the instrument is next used. Instead of afull calibration, a calibration verification can be performed by infusing the calibration solution and setting all peak matching parameters to the values that were used
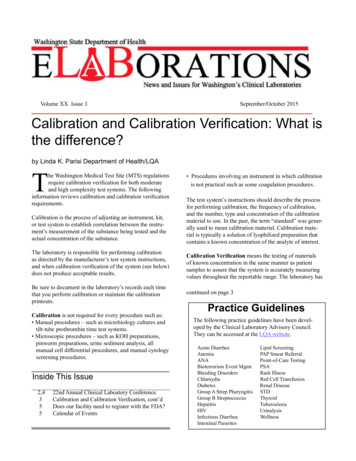
204LC-MS INSTRUMENT CALIBRATIONfor the full calibration. If the difference between the predicted and actual mass isnot significant, the original mass calibration curve is still valid. Independent ofthe instrument model/brand, it is always possible to obtain, at the end of the automated calibration, a final report that displays the predicted exact calibration solution masses, the actual mass of each peak as seen in the mass spectrum, the difference between these two masses (accuracy of the calibration), and in many casesalso the intensities and peak widths of all the ions specified in the experiment.Fine Tuning. In the third step, the detection of one or more particular ions isoptimized to tune the MS with the standard of the analyte of interest, if available,in either the ESI or APCI mode. The mass-to-charge ratio of the analyte of interestor, alternatively, when the standard of the analyte is not available, an ion in thecalibration solution that is the closest to the mass-to-charge ratio for the ion ofinterest, can be chosen (see Section 13.2.2).13.3.2 Quadrupole Mass Filter CalibrationResolution versus Sensitivity. A quadrupole mass filter can be programmed tomove through a series of RF and dc combinations. The Mathieu equation, which isused in higher mathematics, can be used to predict what parameters are necessaryfor ions to be stable in a quadrupole field. The Mathieu equations are solved forthe acceleration of the ions in the X, Y , and Z planes. A selected mass isproportional to (dc RF inner radius)/(RF frequency). For a given internalquadrupole radius and radio frequency, a plot can be made of RF and dc valuesthat predict when a given mass will be stable in a quadrupole field. This is called astability diagram (Figure 13.3). RF and dc combinations follow the value shownStabilityregionforheavy iondcdc/RF values forwhich ions areunstableStability regionfor mediumweight ionStability regionfor light ionRFFigure 13.3. Stability diagram of a quadrupole mass filter.
205CALIBRATION PRACTICESdcby the line intersecting the stability diagram. The line that reflects the RF/dc iscalled a scan line (Figure 13.4). Modifying the scan line changes the ratio of RFto dc. The gain changes the ratio of RF to dc more rapidly at high values of RFthan at low values of RF.Constant-peak-width profile scans can be achieved by adjusting the RF-to-dcratio. In this case the points of intersection on the scan line will be at the samedistance below the apices (Figure 13.5). To adjust the scan line, the amount ofdc/RF values forwhich ions areunstableStability regionfor mediumweight ionStabilityregionforheavy ionStability regionfor light ionRFFigure 13.4. Different scan lines in a quadrupole mass filter.Peak width for heavy ionPeak width for medium -weight ionScan linedcPeak width for light iondc/RF valuesfor which ions areunstableStability regionfor mediumweight ionStabilityregionforheavy ionStability regionfor light ionRFFigure 13.5. Constant peak profile scan in a quadrupole mass filter.
206LC-MS INSTRUMENT CALIBRATIONdc is changed for a given RF potential. The scan line can be adjusted in twoways: the slope and y-intercept can be adjusted to achieve high-quality spectra.The term amu gain is used to indicate the slope, and amu offset is used toindicate the y-intercept of the scan line. The amu offset value is a setting for themass filter dc voltage adjustment needed to resolve ions and achieve a constantpeak width over the entire mass range. The proper scan line produces goodresolution and thus good profile scan. This results in optimized mass spectra(Figure 13.6).Peak width for heavy ionPeak width for medium -weight ionScan linedcPeak width for light iondc/RF values for whichions are unstableStability regionfor medium-weightionStabilityregionforheavy ionStability regionfor light ionRF300600cps10060110113CLight ion30113CMedium weight ionm /z13CHeavy ionFigure 13.6. Optimized mass spectra in a quadrupole mass filter.
207CALIBRATION PRACTICESIt is usually desirable to have a consistent peak width over the entire massrange. If the dc is held constant, the peak width varies over the mass range andincreases as the mass increases (Figure 13.7). Adjusting the slope of the operatingline increase the resolution. The resolution normally obtained is not sufficientto deduce the elemental analysis. Usually, quadrupole mass spectrometers arelow-resolution instruments and operate at unit resolution.The wide peak width at higher masses results in loss of resolution. InFigure 13.8 the heavy ion and its 13 C isotope cannot be distinguished, whilePeak width for heavy ionPeak width for medium -weight iondcPeak width for light ionScan linedc/RF values forwhich ions areunstableStability regionfor light ionStability regionfor mediumweight ionStabilityregionforheavy ionRFFigure 13.7. Increase of peak width when dc is held constant in a quadrupole mass filter.cps600cps60060113CHeavy ion (m /z)(a)Heavy ion (m /z)(b)Figure 13.8. Loss of resolution at high masses in a quadrupole mass filter: (a) unit resolution; (b) low resolution.
208LC-MS INSTRUMENT CALIBRATION100cpscps10010113CLight ion (m /z)10113CLight ion (m /z)Figure 13.9. Isotope peak resolved at low masses with poor resolution at high masses ina quadrupole mass filter: (a) unit resolution; (b) low resolution at high masses.at low masses (light ion) it is still possible to resolve the isotope peak(Figure 13.9). This is a classic case of poor resolution at high masses. Thenormal trade-off between high ion transmission and narrow peak widths shouldbe optimized for each application. Most applications require unit mass resolution(i.e., isotope peaks 1 amu apart are clearly defined) which corresponds to peakwidths of approximately 0.7 0.1 amu at 50% intensity [full width at halfmaximum (FWHM)].The entire quadrupole mass range can be divided into several mass regionssuch that the resolution can be adjusted in each region without affecting theothers. This feature allows fine tuning of the instrument resolution for specificapplications. The resolution within the individual mass regions is adjusted byincreasing or decreasing the offset parameter at the masses that bracket theregion. Increasing the offset increases the resolution and decreasing the offsetdecreases the resolution. Changing offset changes the slope of the scan line. Inother words, to obtain unit mass resolution throughout the operating mass range,different scan lines are employed for different m/z ranges. For example, if theresolution of an ion at m/z 500 needs to be increased, the offset at the massthat bracket the region, for example, mass 100 and/or mass 1000, should beincreased. Both the mass settings at 100 and 1000 will change the resolution,so either setting may be adjusted. However, if the resolution of an ion at m/z999 needed to be adjusted, the offset at mass setting 1000 would have a largeeffect, whereas the mass setting at 100 would have a very small effect on itsresolution [6,7].Resolution is also affected by the actual time that ions spend in the quadrupole.Ions that have higher kinetic energy have shorter residence time and lower resolution. Reducing the kinetic energy typically leads to an improvement in resolution.A dramatic change in resolution may cause a shift in the instrument calibration.After adjusting the resolution, it is necessary to check the calibration (calibrationverification), and if it is noted that the difference between the predicted and actualmass values have shifted, the instrument should be recalibrated.
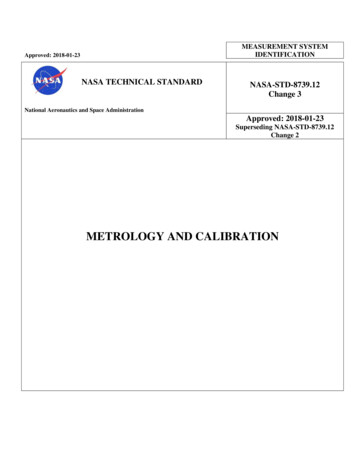
209CALIBRATION PRACTICESCalibration Curves. A quadrupole mass spectrometer can require up to threecalibration curves:1. A static calibration is used to accurately “park” the quadrupole mass analyzer on a specific mass of interest. If only a static calibration is performed,the instrument is calibrated for acquisitions where the quadrupoles are heldat a single mass as in SIM or SRM.2. A scanning calibration enables peaks acquired in a scanning acquisitionto be mass measured accurately (scan mode). If only a scanning calibration is performed, the instrument is calibrated correctly only for scanningacquisitions over the same mass range and at the same scan speed as thoseused for the calibration. The scan speed recommended for the scanningcalibration is 100 amu/s.3. A scan speed compensation calibration compensates for lag time in thesystem when the instrument is scanned rapidly. If only a scan speed compensation is performed (without a scanning calibration having been performed), the scan speed compensation is treated as a scanning calibrationand the instrument is calibrated correctly only for scanning acquisitionsover the same mass range and at the same scan speed as those used for thecalibration. The scan speed recommended for the scan speed compensationis 1000 amu/s.amuFor some MS models and brands it is recommended that all three types ofcalibration are performed so that any mode of data acquisition can be used andmass ranges and scan speeds can be changed while maintaining correct massassignment [5]. Some other instruments calibrate all together without distinctions [6–8]. When the instrument is fully calibrated, any mass range or scanspeed is allowed within the upper and lower limits dictated by the calibrations.When each peak in the reference spectrum has been matched with a corresponding peak in the spectrum acquired, the mass difference is calculated for eachpair of peaks (see Section 3.1.2). These mass differences are plotted as points ona graph; each data point has the mass of the acquired peak as its x coordinate,and the mass difference above as its y coordinate, and a smooth curve is drawnthrough the points (Figure 13.10) [5]. The polynomial order parameter controlsthe type of curve that is drawn and can be set to any value between 1 and 5:0.65 0.15500100015002000250030003500m /zFigure 13.10. Plot of the mass difference between reference spectrum and acquired spectrum. MS1 static calibration, 28 matches of 28 tested references, SD 0.0465. (Courtesyof Micromass Quattro LC.)
210žžžžžLC-MS INSTRUMENT CALIBRATIONPolynomial order 1 . A straight line is drawn through the points. Thispolynomial of order 1 is not used to calibrate quadrupole MS.Polynomial order 2 . A quadratic curve is drawn through the points. Anorder of 2 is suitable for wide mass ranges at the high end of the massscale and for calibrating with widely spaced reference peaks. This is therecommended polynomial order for calibration with sodium iodide (seeSection 13.3.3), which has widely spaced peaks (150 amu apart) and horseheart myoglobin (see Section 13.3.3), which is used to calibrate higher upthe mass scale. In general, for a typical ESI calibration where the mass rangecalibrated is from 600 amu to greater than 1000 amu, the recommendedsetting for the polynomial order parameter is 2.Polynomial order 3 . A cubic curve is used.Polynomial order 4 . Used for calibrations that include the lower end ofthe mass scale, with closely spaced reference peaks. This is suitable for calibrations with polyethylene and poly propylene glycols (see Section 13.3.3)that extend below 300 amu.Polynomial order 5 . Rarely has any benefit over a fourth order fit.For more information about the calibration procedure for a specific model orbrand quadrupole MS, it is suggested that the reader consult the operators manualprovided with the instrument.13.3.3 Calibration SolutionsCalibrants are required to calibrate the mass scale of any mass spectrometer, andit is important to find reference compounds that are compatible with a particularion source. Calibrants commonly used in electron ionization (EI) and chemicalionization (CI), such as perfluorocarbons, are not applicable in the ESI mode. Theright calibrants for LC-ESI-MS should (1) not give memory effects; (2) not causesource contamination through the introduction of nonvolatile material; (3) beapplicable in both positive- and negative-ion mode. The main calibrants usedor still in use to calibrate
Manual, semiautomatic, and automatic LC-MS calibration require introduction of the solution of the calibrant (calibration solution) into the MS at a steady rate while the procedure is running. The calibration solution is introduced directly (infused) into the MS from a syringe pump or through a loop injector connected to the LC pump.