Transcription
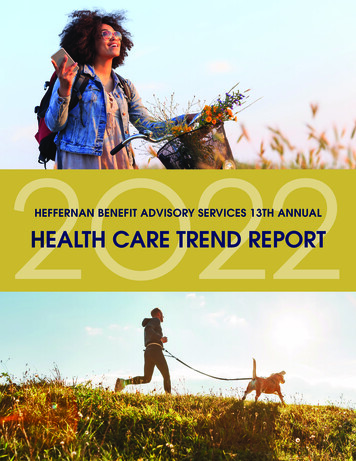
02 2HEFFERNAN BENEFIT ADVISORY SERVICES 13TH ANNUALHEALTH CARE TREND REPORT
TABLE OF CONTENTS4Executive Summary5What Is Trend?62023 Medical Trend Projections62023 Medical Plan Survey Results7Summary of Medical Trend Results8National Medical Projections9Historic National Trends9Historic National Medical Trends92022 and 2023 National Medical Trend Comparedto Prior Five-Year Average (2017 - 2021)10Summary of National Results11Dental and Vision Survey Results112022 and 2023 Dental and Vision Trends Comparedto Prior Five-Year Average (2017-2021)11Summary of Dental and Vision Trend Results12Stop Loss Trend Projections15Drivers of Trend15Covid16Rising Cost of Specialty Drugs17Controlling Health Care Costs17Health Care Literacy18Virtual Care19Employee Well-Being19Creating a Positive Company Culture19Mental Health Benefits20Physical Health22Social and Financial Health23Conclusion
Definitions:Health Maintenance Organization (HMO) – Plans that require a Primary Care Physician (PCP)gatekeeper referral for specialty servicesPreferred Provider Organization (PPO) – Benefits paid at a specific level if patient seeks carefor a preferred provider network, these plans do not require a PCP referralPoint-of Service (POS) – Plans that require a PCP referral on the first tier, and offera PPO type structure on the second and third tiersConsumer Directed Health Plans (CDHP) – Plans that have high deductibles—tax-advantaged designed to encourage consumer engagementDental HMO (DHMO) – A dental plan wherein a set group of dentists provides broadand affordable dental care at a low monthly premiumDental PPO – Benefits paid at a specific level if patient seeks care througha preferred dental provider networkDental Indemnity – Also known as traditional plan, services are paid on a feefor service basis, individuals can visit any dentist
EXECUTIVE SUMMARYThe COVID-19 pandemic has caused manyuncertainties within the health care industry.Understanding the projections that carriers will beusing to develop their trends, as well what is causingthose fluctuations and cost projections, is key to controllinghealth care costs. For the past 13 years, HeffernanInsurance Brokers has been surveying the medical, dental,and vision carriers in all the key regions that our clientscover their employees. In our survey this year, we haveadded the trend projections for two additional states,Virginia and Pennsylvania, and broken out the trend projectionsby five different geographic regions.While carrier trend projections are typically used todevelop fully insured renewal increases, trendprojections are just as critical for groups in the self-fundedmarkets. In an effort to better control costs, many employersare moving from fully insured plans to self-funded plans.Carriers are offering more creative products and fundingmodels so that self-funded options are available to smalleremployers that may not previously have been able to selffund. Our report this year expands our analysis to includesome of the key trends and factors that affect employerswith self-funded plans.The primary drivers of trend are price inflation and increasedutilization. To develop a cost-effective employee benefitspackage, employers need to understand the trendprojections for the upcoming year, and the drivers of thattrend that inflate the price of goods and services and increasethe use of services. It is no surprise that COVID-19 is akey driver of the trend for 2023. However, each year thepandemic is affecting the trend in different ways. Just asCOVID-19 has evolved in the past two years, so has itseffect on health care trend. The second key factor that hasbeen a major driver of trend for the past severalyears is the development of specialty drugs. Specialty drugclaims now represent more than 50% of the total RX spend,yet they are only prescribed to a limited, small population.Understanding why specialty drugs costs are so high willhelp employers create more cost-effective employeebenefits packages.4In addition to driving trend, the COVID-19 pandemichas had other impacts on the health care industry. Prioritiesfor both employers and their employees have shifted,bringing renewed focus to an employee’s total well-being.Despite rising costs, for the first time in many years,employers are not cost-shifting to employees andare taking on more of the financial burden,and expanding employees’ benefits packages toinclude more than just the physical health of theiremployees. Employees expect more from their employersand with the tight labor markets, employers areoffering increased mental health benefits, financial wellness tools, as well as programs that encourage emotional,social, and professional well-being.Faced with both rising costs and a demand for morerobust employee benefits packages at no additionalcost to employees, employers need to apply as manystrategies as possible to control costs. In addition toexploring the drivers of trend, our annual trend reporthighlights key methods that employers can use tomanage trend. Telemedicine, or virtual care, has beena leading strategy to eliminate costly emergency roomvisits and reduce absenteeism. The pandemic broughtvirtual care to the forefront, creating increased access tocare for more than just emergencies. As a result of thepandemic, more people suffered from stress andanxiety, bringing all mental health issues to the forefront.Virtual care made treatment more accessible andreduced the stigma around mental health issues.Long-employed cost-saving strategies such as drivingpatients to receive care in centers of excellence, increasingvoluntary products, and offering consumer-driven healthplans such as High Deductible Health plans with HealthSaving Accounts and Health Reimbursement accountsare still central tools for a well-rounded employee benefitsplan. However, it is even more critical for employers toeducate their employees and their families to becomebetter health care consumers and increase their healthliteracy. Only by truly understanding their benefits, knowingthe questions to ask their providers and pharmacists, andactively looking for the most cost-effective, best care willan employer’s benefits plan control costs in the long run.
WHAT IS TREND?Health care trend is the projected percentagechange (increase) in the cost to treat patientsfrom one year to the next, assuming that benefitsremain the same. For more than 20 years, the projectedtrend for medical, dental, and vision claims has outpaced the standard rate of inflation. While trend is not theonly factor that determines an employer group’s annualpremium increase, it is the primary component. Claimcosts typically represent 65% to 90% of the total healthcare premium.Each year, Heffernan Insurance Brokers surveys the medical,dental, and vision carriers in the key regions where ouremployers are located to identify what trend projectionsthe carriers will be using in their upcoming renewalcalculations.The primary drivers of health care trend are:Price Inflation – The average increase in the cost ofgoods and services such as medical supplies, equipment,staffing, and prescription drugs.Utilization – The usage of medical care and services.Technological Advancements – The change in cost dueto new procedures or equipment replacing older ones,or to new drug treatments or regimens.Deductible Leveraging – The cost added to a health planas a result of increases to the cost of services while benefitsremain constant.In our 2022 Health Care Trend Report, we will explorewhich factors in particular are the driving force behind thecarriers’ 2023 trend projections. An employer group’sactual renewal increase may differ from the trend projectionsfor a variety of reasons. Other factors that influence arenewal increase are:Plan Design DifferencesDemographics Group Experience Regional Cost Variations and MarketCompetition Administration and Health Care Taxes It is important to note that there are two different typesof trends––prospective trend and retrospective trend.The focus of our trend survey is on prospective healthcare trend, where health care costs are expected tobe in the future. Retrospective trend, a measure of theactual change in health care costs experienced, is alsoimportant to understand but is not as critical when lookingforward to the upcoming employer group renewal.Insurance companies will be looking at their own booksof business to determine what they expect their futurecosts to be. These are the projections used in developingrenewals.Heffernan’s annual trend report surveyed more than 50health, dental, and vision providers, asking them whattrend factors they will be using to determine their upcoming2023 renewals.Health, dental, and vision plans that HIB surveyed include:Aetna, AIG, Ameritas, Anthem, Beam Dental, Berkley Accident and Health, Berkshire Hathaway, Best Life and Health, BlueCross of North Carolina, Blue Cross Blue Shield of Alabama, Blue Cross Blue Shield of Arizona, Blue Cross Blue Shield ofKansas City, Blue Cross Blue Shield of Massachusetts, Blue Shield of California, California Dental, CareFirst Blue Cross BlueShield, Century Healthcare, Cigna, Coventry Health Care of Missouri, Crum and Forster Dearborn National, Delta Dental,Emblem Health, Empire Blue Cross, Equitable, Evolution Pan American, EyeMed, Florida Blue, Guardian, HCSC, HealthNet of California, Health Net of Oregon, Highmark, Horizon Blue Cross Blue Shield New Jersey, Inc., Humana, HCC Life,Kaiser Permanente of California, Kaiser Permanente of Oregon, Lincoln, Medical Eye Services, MetLife, Moda Health,Mutual of Omaha, PacificSource Health Plans, Premera, Premier Life Premier Access, Principal, Providence, Regence BlueCross Blue Shield of Oregon, Regence Blue Shield of Washington, Reliance, Stealth, Sun Life Financial, Superior Vision,Sutter Health Plus, Swiss Re, Symetra, The Standard, Tokio Marine, United Concordia, United Healthcare, Unum, VersantHealth, Vision Service Plan (VSP), Voya, Wellmark Blue Cross Blue Shield, Western Health Advantage, Willamette Dental5
2023 MEDICAL TRENDPROJECTIONS2023 Medical Plan Survey ResultsPlan TypeArizonaCaliforniaIllinoisMissouriNew MexicoNew YorkHMO w/RX6.3%5.0%4.8%8.9%8.1%9.2%PPO w/RX7.9%9.0%7.4%7.6%7.9%8.9%POS w/RX7.9%8.0%7.4%8.6%7.9%8.9%CDHP w/RX8.3%7.5%4.8%8.9%8.1%9.0%IND w/RX7.5%9.5%8.0%7.9%8.7%8.2%Plan shingtonHMO w/RX8.2%5.3%8.5%8.4%8.5%6.5%PPO w/RX6.2%5.7%9.1%6.8%7.9%9.0%POS w/RX6.2%5.7%9.1%7.7%7.9%8.7%CDHP w/RX8.2%7.7%9.1%7.5%8.2%9.0%IND w/RX8.3%8.0%7.9%7.1%8.0%9.3%Plan HMO w/RX6.7%5.5%8.2%7.7%8.4%7.7%PPO w/RX8.2%8.4%7.6%7.7%8.7%7.6%POS w/RX7.8%7.5%7.5%8.0%8.8%7.6%CDHP w/RX7.6%7.1%8.0%7.6%8.5%8.1%IND w/RX8.4%8.8%7.1%7.8%7.8%7.6%6
2023 MEDICAL TRENDPROJECTIONSSummary of Medical Trend Results Heffernan Benefits Advisory Services surveys the medical carriers in all 50 states to get their 2023 trend projections.The states above represent the areas with the highest concentration of employees for our clients. We have alsoaggregated the trends from all states into five geographic regions. Health Maintenance Plans (HMOs) have the highest enrollment rates in the Western Region. HMO trend projectionsin all regions, but particularly in the West, are significantly lower than the 2022 projections. In some states, the 2023trend projection is 3% lower than it was in 2022. It is likely that actual costs for HMO plans in 2022 were not as highas expected, resulting in a lowering of trend projections for 2023. Preferred Provider Organization (PPO) plans are also projecting lower trends for 2023 than for 2022 with a fewexceptions, such as California and Washington. However, the difference in 2023 compared to 2022 is not assignificant as for HMO plans with only a 1% variance between the years. The highest percentage of members areenrolled in PPO plans, particularly in the Northeast and Southeast where enrollment is over 50%.1 While HMO and PPO plans are projecting lower trends for 2023, the trend projections for the second-most-popularplan design, Consumer Driven Health Plans (CDHPs), vary widely from state to state and from region to region.In California, the trend projection for CDHPs is over 1% lower than the 2022 projection, while in Washington thetrend projection is almost 2% higher than the previous year. CDHP plans include both Health Savings Account plans(HSAs) and Health Reimbursement Account plans (HRAs), though HSAs are the most popular. Most employers offerCDHPs alongside either an HMO or a PPO plan. Enrollment in these plans have grown to 34% to 49%, with thehighest enrollment rates in the Midwest.2 Unlike in 2022, the national trend projections, though still high, are lower for 2023 across all products.7
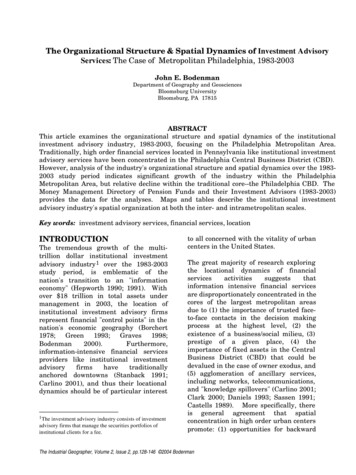
NATIONAL %MidwestNortheastSoutheastThe chart above shows the blended medical and prescription drug trend across the United States for fivekey regions: West, Southwest, Midwest, Northeast, and the Southeast. Adjustments have been madefor enrollment by region in HMO, PPO, and CDHP plans. The 2023 projected trend is within 0.5% for allregions except the Northeast, which is almost 1.5% higher than the lowest trend projection in the West.8
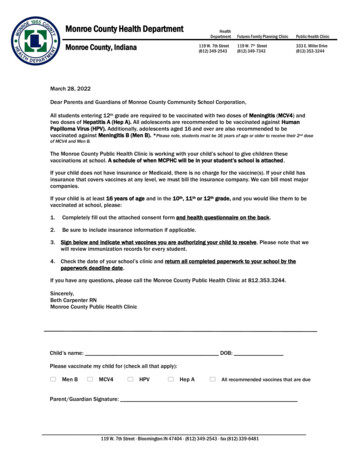
HISTORICNATIONAL TRENDSHistoric National Medical 2022RX2022 and 2023 National Medical Trend Comparedto Prior Five-Year Average (2017–2021)10%8%6%4%2%0%HMOPPOAverage of2017-20219POS2022CDHP2023RX2023
HISTORICNATIONAL TRENDSSummary of National Results The 2023 trend projections for all medical plans and Rx are not only lower than 2022 but also lower than the priorfive years as well. The national trend projection for HMOs is more than 2% lower than it was for 2022 and over 1% lower than theaverage for the prior years. HMO plans have the most significant decrease in trend projections of any medical plan. PPO plans are projected to see the same trend in 2023 as in 2022. A similar trend projection from one year to thenext generally indicates that the trend projections of the prior year were indicative of the actual trend experiencedby the market. PPO trend projections are still lower than they were on average from 2017–2021. While many carriers still offer Point of Service (POS) plans, these plans have the lowest enrollment. POS plans are ahybrid of HMO and PPO plans and will often mirror the trends of those products, depending on the carrier. In our regional projections, the trend projections for CDHP plans varied widely, but on a national level, CDHP plansare expected to trend 0.5% less than the prior year’s projections. CDHP plans are often the lowest-costing plansavailable to employees and their families. Enrollment in these plans have gradually increased over time. In four out of the last six years, the trend projections for RX have been higher than any medical product. Seven yearsago, pharmacy spend represented about 15% of the total medical spend. In 2023, pharmacy spend is estimated at22% of the total medical spend. Primarily caused by the development of specialty drugs, in years where more newprescriptions are hitting the market, the trend projections for Rx are higher than medical trend. This was particularlytrue in 2017 and 2018 as well as the last two years. In 2023, the trend for prescription drugs is once again the highesttrend projection, but it is significantly lower than it has been in the past.10
DENTAL AND VISIONSURVEY RESULTSDental and Vision Survey .9%2.7%2.2%2.3%2.1%2022 Dental and Vision Trends Compared to Prior Five-Year Average (2017–2020)6%5 Year ummary of Dental and Vision Trend Results Trend projections for Dental HMO plans, Dental PPO plans, and Indemnity plans are not only lower than the trendprojections for 2022 but are also significantly lower than they were for the prior five years. Despite an expected surge inutilization during 2021 as a result of deferred care in 2020 due to the COVID-19 pandemic, trend projections for 2023 arelower than they were pre-pandemic. Dental coverage remains a key benefits offering with 67.9% of employers sponsoring their dental plans and 32.1% ofemployers offering dental on a voluntary basis. Dental PPO plans are the most commonly offered and sold benefits plans;91% of dental plans directly contract with providers to create their own dental networks. Vision trend projections are also lower than they were both in 2022 and the prior five-year average. Vision plans are stillwidely offered by employers, but only 36% of employers sponsor their vision plan, while 64% offer vision on a voluntarybasis. Among vision carriers, 44% have a proprietary vision network, while the majority of vision providers lease their visionnetworks. Neither the COVID-19 pandemic nor rising inflation are having the same effect on dental and vision trend projections ascarriers are projecting for medical costs.11
STOP LOSSTREND PROJECTIONSFor more than 20 years, medical trend has outpaced the rate of inflation, making it increasingly difficultfor employers to control their medical benefits spend. Many employers have switched funding models fromtraditional fully insured plans to self-funded options. Self-funded plans are no longer only an option for largeemployers with over 1,000 employees. Due to the rising demand for self-funded options, there are a number of waysthat smaller employers can take on some of the claims risk and partially self-fund their medical, dental, and visionplans. According to the Kaiser Family Foundation’s annual Employer Health Benefits survey, 64% of all employeesare covered by a self-funded plan.3 Among small firms, employers with 3 to 199 employees, 21% are covered by aself-funded plan. When you add in the number of employees covered by either a self-funded or level-funded plan,this number increases to 45%.4Percentage of Covered Workers Enrolled in a Self-Funded Plan, by Firm Size, 1%200-999Workers1,000-4,999Workers5,000 WorkersAll SmallFirmsAll LargeFirmsAll FirmsKFF Employer Benefits Survey,2021Self-funding is not a miracle cure to beat medical trend, but it does allow employers more control over their costs.When employers with self-funded plans add wellness programs, telemedicine services, centers of excellence, orother cost-saving strategies to their plans, the savings directly affect the employees’ claims. Large increases areeasier to absorb when the costs are directly associated with the employer group’s population and not the market atlarge. However, employers should be aware that there are other challenges such as the rise in million dollar claims,possible lasers, and fiduciary responsibility that may outweigh the potential claim savings.In addition to surveying the medical, dental, and vision carriers in our key markets, we also surveyed a number ofstop loss carriers to get a better understanding of where stop loss trends might be headed in 2023. For specificstop loss, the average trend projection for 2023 is 8.1%; for aggregate stop loss, the trend projection is 7.5%. Bothof these trend projections include medical and prescription drugs. Similar to the fully insured market, the projectedtrends are an estimate of the increase in medical costs. Actual stop loss renewals will be determined by a group’s actual claims experience, high dollar claims exposure, any third-party administrator (TPA) or network changes, as wellas no new laser and rate cap provisions in the contract. The stop loss trend projections are also first dollar trends anddo not take into consideration leveraged trend.12
STOP LOSSTREND PROJECTIONSWhile deductible leveraging plays a key role in all trend projections, it is particularly important to understand itssignificance in specific stop loss projections. When employers self-fund their plans, they assume responsibility forclaims below a specific limit. This limit varies by employer based primarily on group size and appetite for risk. Largeremployers typically have larger deductibles and small employers have smaller deductibles. As trend increases eachyear, if employers don’t increase their deductibles, then the stop loss carriers are assuming a higher portion of therisk. An 8.1% trend becomes an 18.9% trend.Suppose an employer has a 200,000 specific deductible.Year 1 they had a claim that cost 350,000. The employer paid the first 200,000 and the stoploss carrier paid the remaining 150,000.In Year 2 that same 350,000 claim with an 8.1% trend would now cost 378,000.If the employer didn’t change their specific deductible, then the employer would still pay 200,000 for that 350,000 claim, and the stop loss carrier would pay 178,000.The claims cost has only increased 8.1% from 350,000 to 378,000, but the stop loss carrier’scost has now increased by 18.9%.If the employer were to increase their specific deductible in Year 2 from 200,000 to 210,000,then the stop loss carrier would only be paying 168,000 in reinsurance, lowering the effective trendfrom 18.1% to 12%. By taking on an additional 10,000 in risk, the employer will lower the trendbeing applied to their renewal increase.Claims paid byStop Loss Carrier 150,000Claims paid byStop Loss Carrier 178,000Claims paid byClaims paid byEmployerEmployer 200,000 200,000Year 1: 350,000 claimYear 2: 378,000 claim,no change in deductible18.9% increase to Stop LossClaims paid byStop Loss Carrier 168,000Claims paid byEmployer 210,000Year 2: 378,000 claim,deductible increased by 10,00012% increase to Stop LossEmployers may not be able to fully increase their deductibles each year to keep in pace with trend increases, butraising the specific deductible at least a little bit each year may lower costs by minimizing the effect of leveragedtrend. Additionally, while stop loss carriers typically don’t adjust their premiums by location or size, the amount ofthe specific deductible will affect the premium. As an employer increases their deductibles and assumes more of therisk, the premiums will decrease.13
STOP LOSSTREND PROJECTIONSStop loss insurance is different from fully insured plans in that the coverage only comes into play when there are largeclaims (specific stop loss) or an extremely high frequency of claims (aggregate stop loss). Conditions that may notbe rare but are costly, such as hemophilia or transplants, play a larger part in their trend projections. According toSun Life’s 10th Annual Research Report, in which the average cost of different conditions is a good benchmark forestimating the potential impact of a high-cost claim, there can be a difference of over a million dollars between theaverage cost and the highest cost for most of the highest costing conditions.5 For example, the average treatmentfor malignant neoplasms is 170,400, but the highest costing claim was 2.09 million. Employers need to be awarethat individual circumstances can greatly affect the cost of treatment for a single condition.Another stop loss trend is the rise in million dollar claims. For Tokio Marine HCC in 2013, there were 18 claims thatwere one million over the specific deductible, with the total incurred amount of 39.2 million. In 2020 this numberrose to 45 claims and 148.8 million.6 This is a dramatic increase in million dollar claims. To minimize the risks dueto these potential million dollar claims, many employers are implementing laser provisions to reduce the chance ofthese claimants being carved out (lasered) from their stop loss insurance. However, the likelihood of a self-fundedplan having a million dollar claim is only 10%.7Percentage of Employers to Have a Stop-Loss Claim86%Any stop-lossclaim70%A injectabledrug claim61%A cancerclaim11%10%A birth-relatedclaimA 1M claimSun Life 2022 High-Cost Claims and Injectable Drug Trend AnalysisRegardless of the added risks and responsibilities that self-funding options may bring, they remain a viable optionfor employers, particularly larger employers, to control costs and offer their employees tailored employee benefitspackages that best meet their employees’ needs.14
DRIVERS OF TRENDCOVID-19More than two years after COVID-19 disrupted our healthcare system, the pandemic remains one of the primarydrivers of medical trend. COVID-19 has had an impact onevery facet of medical care from an increase in the needfor mental health services, the expensive cost of treatinglong covid or covid conditions with multiple morbidities,to health care industry labor shortages, and a need forincreased virtual care options. The effects of COVID-19on both health care trend and the health care industry ingeneral will be experienced for years to come.One of the more direct drivers of the pandemic to themedical trend is the actual treatment of COVID-19 andits comorbidities. While the latest variations of COVID-19may not need hospitalization or even treatment, especiallyamong the younger populations, when a patient getslong COVID or a more severe case, the treatment is veryexpensive. In 2021, COVID-19 had the fourth-highest averagecost among the leading conditions or diseases, with anaverage cost of 231,300.8 Less directly, COVID-19 hasalso impacted medical trend due to the worsened severityof different medical conditions such as cancer, diabetes,and heart conditions because of deferred care anddisruptions to routine screenings and treatment. This impactis likely to continue for a number of years, especially giventhat outbreaks in new variants of COVID continue todisrupt care.Another way that the COVID-19 pandemic has affectedthe health care industry is the increased need for mental15health services. Mental health has long been an overlooked aspect of patient care, with many plans notoffering comparable services for mental health benefitsas for more physical conditions. The increased stress andemotional toll on millions of Americans have highlightedthe need for not only more robust mental health care options,but also the need to normalize mental health treatmentand reduce the stigma around mental health. While highlighting the need for better mental health options is apositive result of the pandemic, there are millions morepatients who have need for mental health services. Whilethe increased utilization of mental health services may bedriving up health care trend in the near future, the treatmentof mental health among patients who may not havepreviously accessed care will have a long-term, positiveimpact on both the mental and physical health of patients.Before the pandemic, hospitals were using contract laborto fill both clinical and non-clinical labor shortages. AsCOVID-19 hospitalizations reached record levels, healthcare workers faced a tremendous physical as well asemotional toll, resulting in burnout. The health careindustry labor shortage has only been exacerbated bythe pandemic, with many health care workers leavingthe industry. Before 2020, 23.7% of hospitals had anurse vacancy rate greater than 10%. In 2022, 35.8%of hospitals had a vacancy rate of more than 10%. Thestaffing shortages have forced hospitals to look to staffingagencies, driving up the costs for labor.9 Until the laborand staffing issues can be resolved, high labor costs willcontinue to drive up medical trend.
DRIVERS OF TRENDRising Cost of Specialty DrugsOver the last 10 years, the cost of prescription drugs hasbecome a critical component of the overall medical trend.An employer’s average pharmacy spend is now 22% oftheir total health care spend.10 In all regions throughoutthe United States except for the West, the trend projection for prescription drugs is more than 1% higher thanthe medical trend. The driving cost for RX trend is specialtydrugs, which while taken by a much smaller percentageof the population, now represents 50% of an employergroup’s total pharmacy spend.11 Specialty drugs requirespecific handling and administration methods that are oftencostlier to develop and are often biologic and injectable.They are typically used to treat more complex health conditionssuch as cancer, and chronic diseases such as rheumatoidarthritis and multiple sclerosis.Since 2020, specialty drugs have made up 80% of new FDAapprovals, many of these are for rare diseases and cancer.12Though few patients require specialty drugs, they offerimmense value to treating more complicated diseases.They also give patients more control in managing theirhealth.13 However, their high costs do require employersto implement strategies to manage the costs.The first method for controlling rising specialty drug costsis to encourage the use of biosimilars. A biosimilar isa biologic drug, approved by the FDA, that is similar toanother biologic medication. Biosimilars are as clinicallyeffective as the brand name drug but are significantlycheaper. One of the higher-costing specialty drugs isRemicade, which costs about 31,000 to 46,000 inthe first year. A known biosimilar to Remicade is Inflectra;though still expensive, it averages 16,000 to 24,000.Encouraging patients to take biosimilars can offersignificant savings.It is also important for employers to have targeted formulariesand utilization management programs in place. Whilespecialty drugs are a key driver of pharmacy trend, otherbrand name drugs may also be prescribed when theremay be more cost-effective, generic equivalent optionsavailable. Utilization management programs review bothspecialty and non-specialty drugs and review data on newand emerging drugs to protect patients against potentiallyharmful, ineffective or unnecessary drug treatments.14Many patients may not be aware that an alternative, lower-costdrug may be available.The recent increased development of specialty drugs ischanging the medical lands
Kansas City, Blue Cross Blue Shield of Massachusetts, Blue Shield of California, California Dental, CareFirst Blue Cross Blue Shield, Century Healthcare, Cigna, Coventry Health Care of Missouri, Crum and Forster Dearborn National, Delta Dental, . Plan Type Arizona California Illinois Missouri New Mexico New York HMO w/RX 6.3% 5.0% 4.8% 8.9% 8 .