Transcription
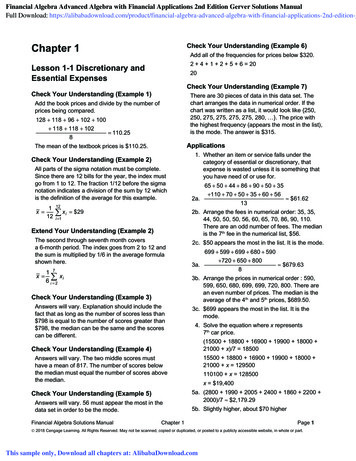
Financial Algebra Advanced Algebra with Financial Applications 2nd Edition Gerver Solutions ManualFull Download: nd-edition-gCheck Your Understanding (Example 6)Chapter 1Add all of the frequencies for prices below 320.2 4 1 2 5 6 20Lesson 1-1 Discretionary andEssential Expenses20Check Your Understanding (Example 7)Check Your Understanding (Example 1)There are 30 pieces of data in this data set. Thechart arranges the data in numerical order. If thechart was written as a list, it would look like {250,250, 275, 275, 275, 275, 280, }. The price withthe highest frequency (appears the most in the list),is the mode. The answer is 315.Add the book prices and divide by the number ofprices being compared.128 118 96 102 100 118 118 1028 110.25ApplicationsThe mean of the textbook prices is 110.25.Check Your Understanding (Example 2)All parts of the sigma notation must be complete.Since there are 12 bills for the year, the index mustgo from 1 to 12. The fraction 1/12 before the sigmanotation indicates a division of the sum by 12 whichis the definition of the average for this example.x 11212 xi 291. Whether an item or service falls under thecategory of essential or discretionary, thatexpense is wasted unless it is something thatyou have need of or use for.65 50 44 86 90 50 352a.13 61.622b. Arrange the fees in numerical order: 35, 35,44, 50, 50, 50, 56, 60, 65, 70, 86, 90, 110.There are an odd number of fees. The medianis the 7th fee in the numerical list, 56.i 1Extend Your Understanding (Example 2)The second through seventh month coversa 6-month period. The index goes from 2 to 12 andthe sum is multiplied by 1/6 in the average formulashown here.1 7x xi6 i 22c. 50 appears the most in the list. It is the mode.699 599 699 680 5903a. 720 650 8008 679.633b. Arrange the prices in numerical order : 590,599, 650, 680, 699, 699, 720, 800. There arean even number of prices. The median is theaverage of the 4th and 5th prices, 689.50.Check Your Understanding (Example 3)Answers will vary. Explanation should include thefact that as long as the number of scores less than 798 is equal to the number of scores greater than 798, the median can be the same and the scorescan be different.3c. 699 appears the most in the list. It is themode.4. Solve the equation where x represents7th car price.(15500 18800 16900 19900 18000 21000 x)/7 18500Check Your Understanding (Example 4)15500 18800 16900 19900 18000 21000 x 129500Answers will vary. The two middle scores musthave a mean of 817. The number of scores belowthe median must equal the number of scores abovethe median.Check Your Understanding (Example 5)Answers will vary. 56 must appear the most in thedata set in order to be the mode.Financial Algebra Solutions Manual 110 70 50 35 60 56110100 x 128500x 19,4005a. (2800 1990 2005 2400 1860 2200 2000)/7 2,179.295b. Slightly higher, about 70 higherChapter 1Page 1 2018 Cengage Learning. All Rights Reserved. May not be scanned, copied or duplicated, or posted to a publicly accessible website, in whole or part.This sample only, Download all chapters at: AlibabaDownload.com
5c. Let x represent Ashley’s amount.(2800 1990 2005 2400 1860 2200 2000 x)/8 21102800 1990 2005 2400 1860 2200 2000 x 1688015255 x 16880x 1,6256. All parts of the sigma notation must becomplete. Since there are 12 bills for the year,the index must go from 1 to 12. The fraction1/12 before the sigma notation indicates adivision of the sum by 12 which is the definitionof the average for this example.x 121 x i 47.3312 i 17. All parts of the sigma notation must becomplete. Since there are 6 bills for the firsthalf-year period, the index must go from 1 to 6.The fraction 1/6 before the sigma notationindicates a division of the sum by 6 which isthe definition of the average for this example.1 6x x i 43.006 i 18. All parts of the sigma notation must becomplete. Since there are 8 bills for the periodfrom April to November with April the 4th monthand November the 11th month, the index mustgo from 4 to 11. The fraction 1/8 before thesigma notation indicates a division of the sumby 8 which is the definition of the average forthis example.x 1811 xi1 9 xi3 i 7Financial Algebra Solutions Manual11. Since the index goes from 2 to 5 which coversthe 4-day period from Tuesday through Fridayinclusive, this expression is asking for theaverage of the daily cell phone usage inminutes for those 4 days. 36 is the averagedaily number of minutes used from Tuesdaythrough Friday.12. It appears that the lowest daily minutes usedover a 4-day period were from Wednesdaythrough Saturday inclusive.x 146 xi 33.75i 313a. Count the number of seats in each seatingcategory. These will be the frequencies forthose categories.Seat TypePriceNumber ofSeatsFirst Class 85016DeluxePremium 54025Preferred Plus 40033Preferred 32016Economy 2805913b. 16 850 25 540 33 400 16 320 59 280 61,94013c. Mean (16 850 25 540 33 400 16 320 59 280)/149 415.70 50.25i 49. All parts of the sigma notation must becomplete. It appears that July, August, andSeptember have the highest consecutive bills.Since there are 3 bills for the period July toSeptember with July the 7th month andSeptember the 9th month, the index must gofrom 7 to 9. The fraction 1/3 before the sigmanotation indicates a division of the sum by 3which is the definition of the average for thisexample.x 10. Since there are 7 days in the week withMonday the 1st day and Friday the 7th day andthe index goes from 1 to 7, this expressionasks for the average of the daily cell phoneusage in minutes. 43 is the average dailynumber of minutes used over the week.Median 320; Use the frequency table.There are an odd number of seat prices for thisflight. The median will occur at the middle pricewhich is the 75th price when you count downfrom the highest or up from the lowest.Mode 280. The price of 280 has thehighest frequency.14a. There are 20 prices of cases sold. The indexmust go from 1 to 20 and the sum of the pricesmultiplied by 1/20.x Chapter 112020 xi 40.34i 1Page 2 2018 Cengage Learning. All Rights Reserved. May not be scanned, copied or duplicated, or posted to a publicly accessible website, in whole or part.
14b. Make a list of the case prices in numericalorder. Count the number of occurrences in thelist for each price. These numbers will be thefrequencies for the respective prices.b.Check Your Understanding (Example 4)54.5% of the fares were at or below 499.99.Extend Your Understanding (Example 4)100(136 80 96)/1434 21.8%PriceFrequency8.99219.993100(24/80) 30%29.992Applications 1-235.99439.99149.99554.99179.99199.991Check Your Understanding (Example 5)1. Travel makes you richer by broadening yourhorizons and exposing you to newexperiences. The quote starts out by speakingof a monetary expense. But making you“richer” does not necessarily mean monetarilyricher.2a.14c. (2 8.99 3 19.99 2 29.99 4 35.99 39.99 5 49.99 54.99 79.99 99.99)/20 40.34PriceInterval14d. Median 35.99; There are 20 prices. Themedian will be the average of the 10th and 11thprice. Mode 49.99; This is the price thatappears the most in the list.15.4.10(3) 4.85(2) 8x 12 12.5(2)3 2 x 1 259 8x 8 xLesson 1-2FrequencyCumulativeFrequency 20– 29.9988 30– 39.991018 40– 49.99624 50– 59.99226 60– 69.99935 70– 79.995402b. Using the cumulative frequency entry for the 30– 39.99 category, there are 18 prices at orbelow 39.99.2c. Since there are a total of 40 prices, 18 of whichare at or below 39.99, there are 40 – 18, or22 prices at or above 40.Travel ExpensesCheck Your Understanding (Example 1)The cumulative frequency entry on the line 250 m 500 indicates that 584,730,000 trips each lessthan 500 miles were taken.2d. There are 35 prices below 70, 8 of which areat or below 29.99. So, 35 – 8, or 27 prices arebetween 29.99 and 70.3a.Check Your Understanding (Example 2)This represents two intervals on the chart. Add therelative frequencies for 700– 799.99 and 800– 899.99: 0.095 0.056 0.151. This represents15.1% of the total bookings.Check Your Understanding (Example 3) C2*100 or B2/B12*100 The relative frequency inthe chart is expressed as a decimal. It can beconverted to a percent by multiplying by 100.Financial Algebra Solutions ManualChapter 1PriceIntervalCumulative RelativeFrequency Frequency Frequency 20– 29.99880.200 30– 39.9910180.250 40– 49.996240.150 50– 59.992260.050 60– 69.999350.225 70– 79.995400.125Page 3 2018 Cengage Learning. All Rights Reserved. May not be scanned, copied or duplicated, or posted to a publicly accessible website, in whole or part.
3b. Examine the relative frequency entries. Theranges 20– 29.99, 30– 39.99, and 60– 60.99 have a relative frequency greaterthan 0.18 and less than 0.27.3c. Convert the relative frequency of 0.125 to apercent. 12.5% of the bus fares fell in thisrange.4a.–4c.4a.2015Month4b.6d.7a. C9 SUM(C2:C8)7b. D3 C3/C97c. D7 C7/C97d. E4 SUM(C2:C4) or E3 C47e. F5 E5/C94c.Relative# ofRelativeCumulative CumulativeVehicles Frequency Frequency 9September128,8500.151851,4311.0008a. If C6 is decreased by 2, then the total in C9 willalso be decreased by 2. Because every entryin the D column is dependent on the amount inC9, all cells will change in value. To see thechange in the spreadsheet, rounding wouldhave to be set to 3 decimal places.8b. The frequencies in cells C2 through C5 wouldremain unchanged. Therefore, the cumulativefrequencies in cells E2 through E5 also wouldremain unchanged. The cumulativefrequencies in cells E6 through E8 wouldchange.4d. (127355 140226 135000 145000 175000 128850)/6 141,9054e. Arrange the vehicle numbers in numericalorder: 127355, 128850, 135000, 140226,145000, 175000. There are an even number ofentries in the list. The median will be theaverage of the 3rd and 4th entry. (135000 140226)/2 137,6134f. The total number of vehicles over the6-month period is 851,431. The percentage ofvehicles for July is 100(145000/851431) 17%4g. 47.3% — in the relative cumulative frequencycolumn for June.5a. The total of the entries in the frequency columnis 805b. 3/80 0.0385c. 0.250; 20/80 0.2505d. 28; 4 2 3 12 7 285e. 66; 4 2 3 12 7 2 4 20 5 7 66or 59 7 665f. 0.425; 34/80 0.4258c. If C6 is decreased by 2, then the total in C9also will be decreased by 2. The entries incells F2 through F7 would change becausethose entries are dependent on the total in C9.To see the change in the spreadsheet,rounding would have to be set to 3 decimalplaces. The entry in cell F8 would not changesince it represents 100% of the rooms.9. 42.5%; 100(34/80) 42.5%10. 75%; 100(75/100) 75%11a. 30%. Approximately 30% of fares listed are ator below 119.11b. 91.1%. Approximately 91.1% of the fares listedare at or below 272.11c. 173. Since the fare of 272 has a percentilerank of 91%, check the fare numerically belowit. There are 74 fares listed at or below 173.100(74/90) 82%12a.5g. 1.000; 80/80 1.0006a. 12 x; 5 x 3 4 12 x6b.12b.100aa b c d e f100 (a b)a b c d e f100(a b c )12c.a b c d e f5Frequency for 190 divided by the12 xtotal 12 x6c. 8 x; 5 x 3 8 xFinancial Algebra Solutions Manual(8 x ); (5 x 3)/(5 x 3 4) (12 x )(8 x)/(12 x)12d.Chapter 1100(a b c d )a b c d e fPage 4 2018 Cengage Learning. All Rights Reserved. May not be scanned, copied or duplicated, or posted to a publicly accessible website, in whole or part.
12e.100(a b c d e)Check Your Understanding (Example 4)a b c d e f12f. 100%(x x)NumberLesson 1-3 EntertainmentExpensesCheck Your Understanding (Example 1)60. Subtract the lowest number, 8, from the highestnumber, 68. The range is the difference betweenthe highest and lowest data points.Extend Your Understanding (Example 1)( x x 63010.6112.36Add the last column. Divide by 5 to get the average.Then take the square root of the result. Thestandard deviation is 7.96 to the nearest hundredth.Check Your Understanding (Example 5)The range would not change, since 34 and 43 wereneither the maximum or minimum pieces of data.Check Your Understanding (Example 2)The mean is 35.4. The sum of the deviations is(8 – 35.4) (12 – 35.4) (34 – 35.4) (55 – 35.4) (68 – 35.4) 0, and when divided by 5 the meandeviation is 0. The mean deviation for anydistribution is always 0.Extend Your Understanding (Example 2)20.88. The mean is 35.4. The five absolute valuedeviations from the mean are 27.4, 23.4, 1.4, 19.6,and 32.6. The sum of these deviations is 104.4, sodividing by 5 gives mean absolute deviation 20.88.The mean absolute deviation must be greater thanor equal to 0. 5.57. The total frequency is 30. The mean is 12.Note that there are three different donations, butthey all must be weighted by the number of peoplewho made that donation. Students can use theircalculator or make a table manually to find thevariance:Number Frequency ( x i x )(xi)(f)( x i x )2 ( x i x )2 f56–7492941015–2460209864576n (x i x )2The standard deviation formula isi 1n294 60 576 930.Check Your Understanding (Example 3)63.44. The mean is 19.4 The data is substituted into930 30 31 and the square root of 31 to thenearest hundredth is 5.57.5 ( x i x )2the variance formulai 15Extend Your Understanding (Example 5)where n 5. The22expression becomes (11 19.4) (13 19.4) (15 19.4)2 (28 19.4)2 (30 19.4)2 and thiscan be plugged into a calculator in one keystrokesequence and then divided by 5; students do notneed to get each separate addend’s value.That column’s sum is not the mean deviation sinceit does not include the frequency. That column isonly the sum of 6 deviations, and there are 80deviations since the frequency is 80.Applications1. Answers may vary. The gist of the quote is thatsometimes, when entertainment venues getcrowded, some people avoid going to thembecause they don’t like the crowds. The charmin the expression is that it is oxymoronic to say“nobody goes there” if the venue is actuallyvery crowded.Financial Algebra Solutions ManualChapter 1Page 5 2018 Cengage Learning. All Rights Reserved. May not be scanned, copied or duplicated, or posted to a publicly accessible website, in whole or part.
5d. 1,265,390. The standard deviation formula is2. 13.964. To find the standard deviation giventhe variance, take the square root of thevariance.n (x i x )2i 1. The mean is 1,880,800 andnn 5. The standard deviation is found bysubstituting into the formula.3a. 112.80. The 10 monthly bill amounts areadded and divided by 10 to find the mean.3b. 62. The highest bill is 150 and the lowest is 88 and the difference, which is the range, is62. i 1( x i x )2 .n3c. 456.76. The variance formula isnThe mean is 112.80, and n 10. The varianceis found by substitution.3d. 21.37. The standard deviation is the squareroot of the variance, and the square root of456.76, rounded to the nearest hundredth,is 21.37.4b. 104. The highest game cost is 266 and theleast expensive game cost is 162, and therange is the difference, which is 104.8b. M – r. The minimum score can be found bysubtracting the range from the maximumscore.n ( x i x )2i 1nThe mean is 202.80, and n 5. The varianceis found by substitution.7. The customers, because the standarddeviation of 2 pounds is relatively morecompared to the mean of 60 pounds thancompared to a mean of 400 pounds. Althoughboth distributions have a standard deviation of2, they are not dispersed the same. Standarddeviations need to be viewed with respect totheir means.8a. 40. The range is the difference between theminimum and maximum number. Since theminimum is 23 and the range is 17, 17 can beadded to 23 to find the maximum, which is 40.4a. 202.80. The costs of the five games areadded and divided by 5 to find the mean.4c. 1,182.96. The variance formula is6. 25. The variance is the square of the standarddeviation, and 52 25.4d. 34.39. The standard deviation is the squareroot of the variance and the square root of1,182.96, rounded to the nearest hundredth, is34.39.4e. 40.56. The mean cost, 202.80, is divided by5 to find the cost per person.5a. 4,133, 2,369, 1,295, 928, and 679. To viewthese large numbers as “batches” of 1,000,remove the three zeroes at the right end ofeach number.9. 82.30. If 25 members spend an average of 82 each then the total spent by all 25members is found by multiplying 25 and 82.That product is 2,050. They then can add the26th person’s ticket price, 90, to the total to get2,140. Divide the new total by 26 and round tothe nearest cent to compute the new mean.10a. 1,192. This is found by adding the fourexpenses in the cost column.10b. 119.20. This is found by dividing the total costby 10.10c. 0. The standard deviation measures dispersionfrom the mean. If all of Ralph’s paychecks arethe same, then that number is the mean andthe deviations of each paycheck from themean are all 0.5b. 1,880,800. The five numbers are added andthe sum is divided by 5.5c. 3,454,000. The highest number is 4,133,000and the lowest number is 679,000. The rangeis the difference between these numbers, sothe range is 3,454,000.11a. 20. The range is found by subtracting theminimum number, 30, from the maximumnumber, 50.11b. The women did. In general, their deviationsfrom the mean were higher than the men’s.12a. 5. The median is the middle number, after thenumbers are arranged in order.Financial Algebra Solutions ManualChapter 1Page 6 2018 Cengage Learning. All Rights Reserved. May not be scanned, copied or duplicated, or posted to a publicly accessible website, in whole or part.
12b. 5.2. The mean is the sum of the five numbersdivided by 5.Lesson 1-4 Vacation Expenses12c. 2.14. The standard deviation formula isCheck Your Understanding (Example 1)n–0.67. A height of 54 represents 2/3 of a standarddeviation below the mean. ( xi x )2i 1. The mean is 5.2 and n 5. Thenstandard deviation is found by substituting intothe formula.12d. Mean 163.6; median 5; standard deviation 318.20. The mean is found by find the newsum, 818, by 5. The median is found bylooking for the middle number after thenumbers are ordered. Since 8 was the originaldistribution’s maximum, and 8 is beingreplaced by 800, the middle number does notchange. The standard deviation formula is 13.80. The z-score formula has four variables in it.Given any three of them, the fourth variable can besolved for.z x μσSubstitute: 1.5 x 121.20(1.5)(1.20) x – 121.8 x – 12n ( xi x )2i 1Check Your Understanding (Example 2)x 13.80. The mean is now 163.6 andnn 5. The standard deviation is found bysubstituting into the formula.Check Your Understanding (Example 3)9.18%. Convert 60 to a z-score using the formulax μz . Use substitution to find that the z-score12e. Median. The median is resistant to outliersbecause outliers occur at the ends of adistribution, and the median is the middlenumber.σ13a. Theme park admissions because 3.99 4.13b. The theme park admissions are more spreadout because their standard deviation is greaterrelative to its mean than the home stereoprices.14a. 0. If all numbers are the same, the maximumand minimum numbers are equal, so the rangeis 0.14b. 0. The standard deviation measure deviationfor the mean, and if all numbers are the same,the mean is that same number and thedeviations are all 0.14c. Yes. If the range is 0, then all the numbers arethe same. In that case, all of the meandeviations are 0, and the standard deviation is,as a result, 0.14d. The range is not as good a measure ofdispersion since there is an extreme numberand no other numbers near it, and the rangeignores all the intermediate values.Financial Algebra Solutions Manual60 56. To the nearest3hundredth, this is equal to 1.33. Look at the row 1.3on the z-score table and go to the 0.03 column tocreate 1.33. The table entry, .9082, is the areabelow the z-score of 1.33. Subtract .9082 from 1 tofind the answer 9.18%. A common error is thatstudents give the percent below 60 instead of above60. Using a calculator the answer is 9.12%, and thisis due to the ability of the calculator to not round theoriginal z-score. These differences areinconsequential.for a raw score of 60 is z Chapter 1Extend Your Understanding (Example 3)Convert 51 to a z-score using the formulax μz . Use substitution to find that the z-scoreσ51 56. To the nearest3hundredth, this is equal to –1.67. Look at the row–1.6 on the z-score table and go to the 0.07 columnto create –1.67. The table entry, .0475, is the areabelow the z-score of –1.67. Subtract .0475 from 1 tofind the answer 95.25%.for a raw score of 51 is z Page 7 2018 Cengage Learning. All Rights Reserved. May not be scanned, copied or duplicated, or posted to a publicly accessible website, in whole or part.
Check Your Understanding (Example 4)21%. Convert 1,000 and 2,000 to z-scores using thex μ. Use substitution to find that theformula z σz-score for a raw score of 1,000 is1000 2313z . To the nearest hundredth, this is390equal to –3.37. The area below this z-score is, fromthe table, .0004. Use substitution to find that the z2000 2313.score for a raw score of 2,000 is z 390This is equal to –0.80. The area below this z-scoreis .2119. Subtract the smaller area from the largerarea.2119 – .0004 .2115To the nearest percent, this is 21%.Check Your Understanding (Example 5)74. This rating represents the 25th percentile. Lookin the body of the z-score table for the numberclosest to .2500. That area is .2514, and it is thepercent below a z-score of –0.67. Use the z-scoreformula to convert this to a raw score.Substitute: 0.67 x 786.5σz-score for a raw score of 277 is277 247z . To the nearest hundredth, this60is equal to 0.5.2c. 1.05. Convert 310 to a z-score using thex μ. Use substitution to find thatformula z σthe z-score for a raw score of 277 is310 247z . To the nearest hundredth, this60is equal to 1.05.3. 337. Use the z-score formula to convert thisto a raw score.x 247Substitute: 1.5 60(1.5)(60) x – 24790 x – 247x 3374a. 9.12%. Convert 167 to a z-score using thex μ. Use substitution to find thatformula z σthe z-score for a raw score of 167 is167 247z . To the nearest hundredth, this60is equal to –1.33. Look at the row –1.3 on thez-score table and go to the 0.03 column tocreate –1.33. The table entry, .0918, is thearea below the z-score of –1.33.(–0.67)(6.5) x – 78–4.355 x – 78x 73.645, which, when rounded to the nearestinteger, is 74.Applications1. Answers may vary. Famous author RobertLouis Stevenson feels that the journey is as ormore important than the destination. Travel onits own can be very interesting and exciting,and that doesn't necessarily depend on theactual destination.2a. –0.83. Convert 197 to a z-score using thex μformula z . Use substitution to find thatσthe z-score for a raw score of 197 is197 247z . To the nearest hundredth, this60is equal to –0.83.Financial Algebra Solutions Manual2b. 0.5. Convert 277 to a z-score using the formulax μz . Use substitution to find that theChapter 14b. 97.72%. Convert 367 to a z-score using theformulax μz . Use substitution to find that theσz-score for a raw score of 167 is367 247z . This is equal to 2. Look at the60row 2.0 on the z-score table and go to the 0.00column to create 2.00. The table entry, .9772,is the area below the z-score of 2.4c. 50%. Since 247 is the mean, it is also themedian, and occurs in the middle. Therefore,50% of the numbers are below and 50% areabove.Page 8 2018 Cengage Learning. All Rights Reserved. May not be scanned, copied or duplicated, or posted to a publicly accessible website, in whole or part.
4d. 4.27%. Convert 350 to a z-score using thex μ. Use substitution to find thatformula z 4g. 2.44%. Convert 360 and 400 to z-scores usingx μ. Use substitution to findthe formula z the z-score for a raw score of 167 is350 247z . This is equal to 1.72 to the60nearest hundredth. Look at the row 1.7 on thez-score table and go to the 0.02 column tocreate 1.72. The table entry, .0973, is the areabelow the z-score of 1.72, and this must besubtracted from 1 to get the area above.that the z-score for a raw score of 360 is360 247z . To the nearest hundredth, this60is equal to 1.88. The area below this z-scoreis, from the table, .9699. Use substitution tofind that the z-score for a raw score of 400 is400 247z . This is equal to 2.55. The area60below this z-score is .9946. Subtract thesmaller area from the larger area.σ4e. 0.13%. Convert 67 to a z-score using thex μformula z . Use substitution to find thatσthe z-score for a raw score of 167 is67 247z . This is equal to60–3. Look at the row –3.0 on the z-score tableand go to the 0.00 column to create –3.00.The table entry, .0013, is the area below thez-score of –3.4f. 59.47%. Convert 200 and 300 to z-scoresx μ. Use substitutionusing the formula z σto find that the z-score for a raw score of 200 is200 247z . To the nearest hundredth, this60is equal to –0.78. The area below this z-scoreis, from the table, .2177. Use substitution tofind that the z-score for a raw score of 300 is300 247z . This is equal to –0.88 to the60nearest hundredth. The area below this zscore is .8106. Subtract the smaller area fromthe larger area.Financial Algebra Solutions ManualChapter 1σ4h. 50%. The median is the middle number, and50% of the numbers in the distribution liebelow the median, and 50% lie above.4i. 50%. In a normal distribution, the mean isequal to the median, and the median is themiddle number, and 50% of the numbers in thedistribution lie below the median, and 50% lieabove.5a. 2,470. The mean for one day, 247, ismultiplied by 10.5b. 600. The standard deviation is multiplied by10, since multiplication changes the deviationsfrom the mean.5c. 360,000. The variance is the square of thestandard deviation, and 6002 360,000.6a. 0.65. Convert 400 to a z-score using thex μ. Use substitution to find thatformula z σthe z-score for a raw score of 400 is400 348z . To the nearest hundredth, this80is equal to –0.65.Page 9 2018 Cengage Learning. All Rights Reserved. May not be scanned, copied or duplicated, or posted to a publicly accessible website, in whole or part.
6b. 84.13%. Convert 268 to a z-score using thex μ. Use substitution to find thatformula z σthe z-score for a raw score of 268 is268 348z . This is equal to –1. Look at the80row –1.0 on the z-score table and go to the0.00 column to create –1.00. The table entry,.1587, is the area below the z-score of –1.00,and this must be subtracted from 1 to get thearea above.7a. 7.78%. Convert 1,200 to a z-score using thex μformula z . Use substitution to find thatσthe z-score for a raw score of 268 is1200 1755z . This is equal to –1.42 to the390nearest hundredth. Look at the row –1.4 on thez-score table and go to the 0.02 column tocreate –1.42. The table entry, .0778, is thearea below the z-score of –1.42.7b. 936. Use the z-score formula to convert thisto a raw score. 2.1 Substitute:x 1755390(–2.1)(390) x – 1755–819 x – 1755x 9367c. Lower. The z-score measures the number ofstandard deviations from the mean, and if thez-score stays the same and the standarddeviation increases, the score is farther fromthe mean. Since the z-score is negative, it islower.8a. 2.28%. Convert 64 to a z-score using thex μformula z . Use substitution to find thatσthe z-score for a raw score of 64 is64 69z . This is equal to –2. Look at the2.5row –2.0 on the z-score table and go to the0.00 column to create –2.00. The table entry,.0228, is the area below the z-score of –2.00.Financial Algebra Solutions ManualChapter 18b. 71.6 inches. The z-score for the top 15% is thesame as the z-score for the bottom 85%, andthe table uses the scores below each z-scoreto do computations. Look in the body of thetable for the closest number to .8500. It is.8508, which has a z-score of 1.04. Use thez-score formula to convert this to a raw score.1.04 Substitute:x 692.5(1.04)(2.5) x – 692.6 x – 69x 71.69. Each raw score needs to be converted toa z-score.89 8812z 0.08, and this represents a score abovethe mean at Royal Ranch.90 97Substitute Angela’s score: z 14z –0.5, and this is below the mean.Although Lisa had the lower raw score, Angelais the better golfer. Her score is 0.5 standarddeviations below the mean, while Lisa’s scoreis higher than the mean for her course.10a. 100-pound weights.10b. The ping-pong ball distribution is moredispersed; the standard deviation is muchgreater relative to the mean of 2.7 than thestandard deviation of the weights is to itsmean.11. 1,945.24. Go to the body of the z-score tableand find the number closest to .8000. This is.7995, which corresponds to a z-score of 0.84.x 1600Substitute: 0.84 411(0.84)(411) x – 1600345.24 x – 1600x 1,945.24Substitute Lisa’s score: z Page 10 2018 Cengage Learning. All Rights Reserved. May not be scanned, copied or duplicated, or posted to a publicly accessible website, in whole or part.
Lesson 1-5 Personal ExpensesCheck Your Understanding (Example 8)Check Your Understanding (Example 1)r –0.998. This represents a strong negativecorrelation.About 50. Go up from the 250 mark on the x-axisto where you might expect a y-value to lie.Check Your Understanding (Example 2)Typically, sales of cold beverages will increase asthe temperature increases, so the correlationbetween temperature and cold water sales will bepositive. This correlation is probably
Check Your Understanding (Example 5) Answers will vary. 56 must appear the most in the data set in order to be the mode. Check Your Understanding (Example 6) Add all of the frequencies for prices below 320. 2 4 1 2 5 6 20 20 Check Your Understanding (Example 7) There are 30 pieces of data in this data set. The


