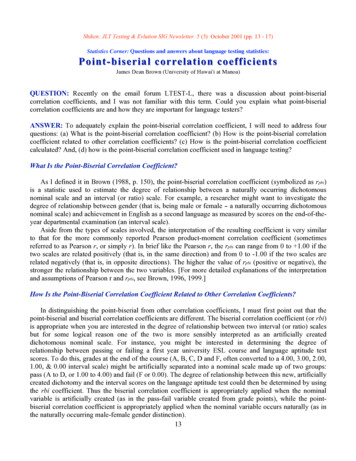
Transcription
Shiken: JLT Testing & Evlution SIG Newsletter. 5 (3) October 2001 (pp. 13 - 17)Statistics Corner: Questions and answers about language testing statistics:Point - biserial correlation coefficientsJames Dean Brown (University of Hawai'i at Manoa)QUESTION: Recently on the email forum LTEST-L, there was a discussion about point-biserialcorrelation coefficients, and I was not familiar with this term. Could you explain what point-biserialcorrelation coefficients are and how they are important for language testers?ANSWER: To adequately explain the point-biserial correlation coefficient, I will need to address fourquestions: (a) What is the point-biserial correlation coefficient? (b) How is the point-biserial correlationcoefficient related to other correlation coefficients? (c) How is the point-biserial correlation coefficientcalculated? And, (d) how is the point-biserial correlation coefficient used in language testing?What Is the Point-Biserial Correlation Coefficient?As I defined it in Brown (1988, p. 150), the point-biserial correlation coefficient (symbolized as rpbi)is a statistic used to estimate the degree of relationship between a naturally occurring dichotomousnominal scale and an interval (or ratio) scale. For example, a researcher might want to investigate thedegree of relationship between gender (that is, being male or female - a naturally occurring dichotomousnominal scale) and achievement in English as a second language as measured by scores on the end-of-theyear departmental examination (an interval scale).Aside from the types of scales involved, the interpretation of the resulting coefficient is very similarto that for the more commonly reported Pearson product-moment correlation coefficient (sometimesreferred to as Pearson r, or simply r). In brief like the Pearson r, the rpbi can range from 0 to 1.00 if thetwo scales are related positively (that is, in the same direction) and from 0 to -1.00 if the two scales arerelated negatively (that is, in opposite directions). The higher the value of rpbi (positive or negative), thestronger the relationship between the two variables. [For more detailed explanations of the interpretationand assumptions of Pearson r and rpbi, see Brown, 1996, 1999.]How Is the Point-Biserial Correlation Coefficient Related to Other Correlation Coefficients?In distinguishing the point-biserial from other correlation coefficients, I must first point out that thepoint-biserial and biserial correlation coefficients are different. The biserial correlation coefficient (or rbi)is appropriate when you are interested in the degree of relationship between two interval (or ratio) scalesbut for some logical reason one of the two is more sensibly interpreted as an artificially createddichotomous nominal scale. For instance, you might be interested in determining the degree ofrelationship between passing or failing a first year university ESL course and language aptitude testscores. To do this, grades at the end of the course (A, B, C, D and F, often converted to a 4.00, 3.00, 2.00,1.00, & 0.00 interval scale) might be artificially separated into a nominal scale made up of two groups:pass (A to D, or 1.00 to 4.00) and fail (F or 0.00). The degree of relationship between this new, artificiallycreated dichotomy and the interval scores on the language aptitude test could then be determined by usingthe rbi coefficient. Thus the biserial correlation coefficient is appropriately applied when the nominalvariable is artificially created (as in the pass-fail variable created from grade points), while the pointbiserial correlation coefficient is appropriately applied when the nominal variable occurs naturally (as inthe naturally occurring male-female gender distinction).13
Shiken: JLT Testing & Evlution SIG Newsletter. 5 (3) October 2001 (pp. 13 - 17)A variety of different correlation coefficients have been developed over the years for variouscombinations of scale types, as summarized in Table 1. The point-biserial is just one of these statisticaltools (see the fifth row of correlation coefficients).How Is the Point-Biserial Correlation Coefficient Calculated?The data in Table 2 are set up with some obvious examples to illustrate the calculation of rpbi betweenitems on a test and total test scores. Notice that the items have been coded 1 for correct and 0 for incorrect(a natural dichotomy) and that the total scores in the last column are based on a total of 50 items (most ofwhich are not shown).Table 2. Example Student Data14
Shiken: JLT Testing & Evlution SIG Newsletter. 5 (3) October 2001 (pp. 13 - 17)To calculate the rpbi for each item use the following formula:Where:rpbi point-biserial correlation coefficientMp whole-test mean for students answering item correctly (i.e., those coded as 1s)Mq whole-test mean for students answering item incorrectly (i.e., those coded as 0s)St standard deviation for whole testp proportion of students answering correctly (i.e., those coded as 1s)q proportion of students answering incorrectly (i.e., those coded as 0s)For example, let's apply the formula for rpbi to the data for Item 1 in Table 2 (which we would expectto correlate highly with the total scores), where the whole-test mean for students answering correctly is45; the whole-test mean for students answering incorrectly is 30; the standard deviation for the whole testis 8.29; the proportion of students answering correctly is .50; and the proportion answering incorrectlyis .50.Thus the correlation between item 1 and the total scores is a very high .91, and this item appears to bespreading the students out in very much the same way as the total scores are. In this sense, the pointbiserial correlation coefficient indicates that item 1 discriminates well among the students in this group(at least in terms of the way the overall test discriminates).As another example, let's apply the formula for rpbi to the data for Item 2 in Table 2 (which we wouldexpect to be highly but negatively correlated with the total scores), where the whole-test mean forstudents answering correctly is 30; the whole-test mean for students answering incorrectly is 45; thestandard deviation for the whole test is still 8.29; the proportion of students answering correctly isstill .50; and the proportion answering incorrectly is still .50.Thus the correlation between item 2 and the total scores is a very high negative value of -.91, and thisitem appears to be spreading the students out opposite to the way the total scores are. In other words, thepoint-biserial correlation coefficient shows that item 2 discriminates in a very different way from the totalscores at least for the students in this group.15
Shiken: JLT Testing & Evlution SIG Newsletter. 5 (3) October 2001 (pp. 13 - 17)As one last example, let's apply the formula for rpbi to the data for Item 3 in Table 2 (which we wouldexpect to have no correlation with the total scores), where the whole-test mean for students answeringcorrectly is 37.5; the whole-test mean for students answering incorrectly is 0.00 because it is non-existent;the standard deviation for the whole test is still 8.29; the proportion of students answering correctly is1.00; and the proportion answering incorrectly is .00.Thus the correlation between item 3 and the total scores is zero, and this item does not appear to bespreading the students out in the same way as the total scores. In other words, item 3 is not discriminatingat all among the students in this particular groupÑin this case because there is no variation in theiranswers.How Is the Point-Biserial Correlation Coefficient Used in Language Testing?As mentioned above, the point-biserial correlation coefficient can be used in any research where youare interested in understanding the degree of relationship between a naturally occurring nominal scale andan interval (or ratio) scale. For instance, I might be interested in the degree of relationship between beingmale or female and language aptitude as measured by scores on the Modern Language Aptitude Test (orMLAT; Carroll & Sapon, 1958). The point-biserial correlation coefficient could help you explore this orany other similar question. For examples of other uses for this statistic, see Guilford and Fruchter (1973).However, language testers most commonly use rpbi to calculate the item-total score correlation asanother, more accurate, way of estimating item discrimination. The correlation coefficient beingcalculated here is between a naturally occurring dichotomous nominal scale (the correct or incorrectanswer on each item usually coded as 1 or 0) with an interval scale test. Such item-total correlations areoften used to estimate item discrimination. Consider the item analysis results shown in Table 3.Table 3. Example Item Analysis (for 32 students)The goal of the analysis shown in Table 3 is to estimate how difficult eachitem is (the IF, or item facility, shown in the second column) and how highlyeach item is correlated with the total scores (the rpbi shown in the thirdcolumn). The item facility, as estimated by the IF, ranges from 0.00(everybody answered incorrectly) to 1.00 (everyone answered correctly) andshows how easy (or difficult) each item is. The rpbi shows the degree towhich each item is separating the better students on the whole test from theweaker students. Thus the higher the rpbi, the better the item is discriminating.Notice in Table 3 that asterisks refer to the p .05 at the bottom of the tableand thereby indicate the items with point-biserial correlation coefficients thatare significant at the .05 level (in other words, those items that have only afive percent chance of having occurred for chance reasons alone). [For moreinformation on how to determine these p values for rpbi, see Brown, 1996, p.178; for more information on item analysis for norm-referenced testingpurposes, see Brown, 1996 (pp. 64-74), or 2000a.]16
Shiken: JLT Testing & Evlution SIG Newsletter. 5 (3) October 2001 (pp. 13 - 17)Certainly, if you are interested in creating a shorter, more efficient, norm-referenced version of thetest, you might be wise to select those items with the highest point-biserial correlation coefficients fromamong those that are significant (numbers 2, 5-7, & 9-13) for the new revised version of the test. At thesame time, you should keep an eye on the item facility index shown in the first column so that you selecta balance of items that average out to make a test that is neither to difficult nor too easy. This strategy isvery similar to the way the discrimination index is used (for more on this statistic, see Brown, 1996, pp.66-70). Such statistics can even be useful if what you need is a longer test: simply examine those itemsthat appear to be discriminating well and write more items like them.One important caveat: remember that item analysis statistics, like the rpbi, are only tools that can helpyou in selecting the best items for a norm-referenced test, but they should never be used to replace thecommon sense notions involved in developing sound language test items. In other words, use thesestatistics to help you understand how students perform on your test items and then use that information tohelp you design a better test next time, while always keeping in mind your theoretical and practicalreasons for writing the items you did and designing the test the way you did.ReferencesBrown, J. D. (1988). Understanding research in second language learning: A teacher's guide to statistics and research design. Cambridge: Cambridge University Press.Brown, J. D. (1996). Testing in language programs. Upper Saddle River, NJ: Prentice Hall.Brown, J. D. (trans. by M. Wada). (1999). Gengo tesuto no kisochishiki. [Basic knowledge of language testing]. Tokyo: Taishukan Shoten.Brown, J. D. (2000a). Statistics Corner. Questions and answers about language testing statistics: How can we calculate item statistics for weighted items?. Shiken: JALTTesting & Evaluation SIG Newsletter, 3 (2), 19-21. Also retrieved March 1, 2001 from the World Wide Web: http://jalt.org/test/bro 6.htm.Brown, J. D. (2000b). Statistics Corner. Questions and answers about language testing statistics: What issues affect Likert-scale questionnaire formats?. Shiken: JALTTesting & Evaluation SIG Newsletter, 4(1), 18-21. Also retrieved March 1, 2001 from the World Wide Web: http://jalt.org/test/bro 7.htm.Brown, J. D. (2001). Using surveys in language programs. Cambridge: Cambridge University Press.Carroll, J. B., & Sapon, S. M. (1958). Modern language aptitude test. New York: The Psychological Corporation.Guilford, J. P., & Fruchter, B. (1973). Fundamental statistics in psychology and education. (5th ed.). New York: McGraw-Hill.HTML: http:// jlt.org/test/bro 12.htm/PDF: http:// jlt.org/test/PDF/Brown12.pdf17
Shiken: JLT Testing & Evlution SIG Newsletter. 5 (3) October 2001 (pp. 13 - 17) 15 To calculate the r pbi for each item use the following formula: Where: rpbi point-biserial correlation coefficient Mp whole-test mean for students answering item correctly (i.e., those coded as 1s) Mq whole-test mean for students answering item incorrectly (i.e., those coded as 0s)