Transcription
EMERGENCY MEDICAL SERVICES RESPONSE TIME AND MORTALITYIN AN URBAN SETTINGIan E. Blanchard, MSc, EMT-P, Christopher J. Doig, MD, MSc, FRCPC, Brent E. Hagel, PhD,Andrew R. Anton, MD, FRCPC, David A. Zygun, MD, MSc, FRCPC,John B. Kortbeek, MD, FRCSC, FACS, D. Gregory Powell, OC, MD, FRCPC,Tyler S. Williamson, PhD, Gordon H. Fick, PhD, Grant D. Innes, MD, FRCPCABSTRACTˆ ˆ ˇ ˆ ˆˆ ˇ " ! CI: 1.00, 1.69). Conclusions. These results call into question the clinical effectiveness of a dichotomous 8-minuteALS response time on decreasing mortality for the majority of adult patients identifed as having a life-threateningevent at the time of the 9-1-1 call. However, this studydoes not suggest that rapid EMS response is undesirableor unimportant for certain patients. This analysis highlights the need for further research on who may beneftfrom rapid EMS response, whether these individuals canbe identifed at the time of the 9-1-1 call, and what the optimum response time is. Key words: emergency medical services; ambulance; time factors; outcome assessment;response; mortalityBackground. A common tenet in emergency medical services (EMS) is that faster response equates to better patientoutcome, translated by some EMS operations into a goalof a response time of 8 minutes or less for advanced lifesupport (ALS) units responding to life-threatening events.Objective. To explore whether an 8-minute EMS responsetime was associated with mortality. Methods. This was aone-year retrospective cohort study of adults with a lifethreatening event as assessed at the time of the 9-1-1call (Medical Priority Dispatch System Echo- or Delta-levelevent). The study setting was an urban all-ALS EMS systemserving a population of approximately 1 million. Responsetime was defned as 9-1-1 call receipt to ALS unit arrivalon scene, and outcome was defned as all-cause mortalityat hospital discharge. Potential covariates included patientacuity, age, gender, and combined scene and transport interval time. Stratifed analysis and logistic regression wereused to assess the response time–mortality association. Results. There were 7,760 unit responses that met the inclusion criteria; 1,865 (24%) were 8 minutes. The average patient age was 56.7 years (standard deviation 21.5). Forpatients with a response time 8 minutes, 7.1% died, compared with 6.4% for patients with a response time ·7 minutes59 seconds (risk difference 0.7%; 95% confdence interval[CI]: –0.5%, 2.0%). The adjusted odds ratio of mortality for 8 minutes was 1.19 (95% CI: 0.97, 1.47). An exploratoryanalysis suggested there may be a small benefcial effect ofresponse ·7 minutes 59 seconds for those who survivedto become an inpatient (adjusted odds ratio 1.30; 95%PREHOSPITAL EMERGENCY CARE 2012;16:142–151INTRODUCTIONBackgroundModern emergency medical services (EMS) is thefrst level of health care response for out-of-hospitalmedical emergencies. Historically, one of the frstinterventions that prehospital personnel performedwas rapid response to a scene and rapid return ofa patient to hospital by use of lights and siren.1 Asthe scope of prehospital clinical practice expanded,emphasis was on rapid response of advanced lifesupport (ALS)-trained paramedics to the scene. In1979, Eisenberg and colleagues reported that survivalfrom witnessed prehospital cardiac arrest of a medicalorigin in adults was maximized if the time from collapse to cardiopulmonary resuscitation (CPR) and thetime from collapse to defnitive care (i.e., defbrillation)were 4 and 8 minutes, respectively.2 From this study,many EMS systems adopted an 8-minute responsetime for ALS units responding to life-threateningevents.1,3–5 However, generalizing these results to theresponse required for all life-threatening events maybe problematic.1,2,4–6 First, there are major differencesbetween the EMS systems of 1979 and present-daysystems, most notable of which is the substantiallyimproved access to defbrillation and CPR.7,8 Second,in EMS patients with conditions other than cardiacarrest, there is no evidence that 8 minutes is an optimalresponse that will result in improved outcomes, and incardiac arrest patients, evidence from the past 10 yearssuggests that 8 minutes may be too long.4,5,9,10 Finally, Received April 1, 2011, Received from the Emergency Medical Services (IEB) and the Department of Emergency Medicine(ARA, DGP, GDI), Alberta Health Services; the Departmentsof Community Health Sciences (CJD, BEH, DAZ, TSW, GHF),Critical Care Medicine (CJD, DAZ, JBK), Paediatrics (BEH)and Surgery (JBK), Faculty of Medicine, University of Calgary; and the Shock Trauma Air Rescue Society (DGP);Calgary Alberta Canada. Revision received May 13, 2011;accepted for publication June 2, 2011.The authors report no conficts of interest.Address correspondence and reprint requests to: Christopher JamesDoig, MD, MSc, FRCPC, Foothills Medical Centre, Critical Care,1403-29th Street NW, Calgary, Alberta, T2N 2T9 Canada. e-mail:cdoig@ucalgary.cadoi: 10.3109/10903127.2011.614046142
Blanchard et al.the economic burden of maintaining an 8-minuteresponse time goal is large.11–13Rationale for the Studyˆ ˆ ˇ ˆ ˆˆ ˇ " ! 143EMS RESPONSE TIME IN URBAN SETTINGA common tenet in modern EMS organizations is that afaster response saves lives.1,3,12 EMS systems designedto meet these response time goals have a large economic cost of maintaining rapid response.11 As EMSsystems allocate resources to achieve a rapid response,there are fnancial opportunity costs to other EMS programs such as quality assurance and continuing medical education. EMS medical directors and managersrequire empirical evidence to assess the effectivenessof present response time goals to inform the future development of response time policy. While there havebeen many calls for further research into responsetime,3,12,14–17 only a few studies have explicitly studied this topic.2,4–6,9,10,14,18 No contemporary studies,either examining specifc diagnoses such as cardiac arrest or trauma or using a pragmatic approach of examining all responses irrespective of diagnosis or patient condition, have found the optimal ALS responsetime to be based on a cutoff of less than or greaterthan 8 or 9 minutes.4,5,9,10 No known study has examined the association between ALS response time andmortality restricted to patients thought to be in a lifethreatening condition at the time of the 9-1-1 call—thepoint at which EMS systems must make the decision torespond rapidly.The primary objective of this study was to determinewhether, in a large urban ALS EMS system, a responsetime of 8 minutes or longer was associated with an increase in mortality for adult patients identifed at thetime of the 9-1-1 call as being in a life-threatening condition. Our hypothesis was that there would be no observable difference in all-cause mortality stratifed byan 8-minute response time. Secondary objectives focused on the time of death (in the emergency department [ED] or after hospital admission as an inpatient),4- and 9-minute response times, and response time asa continuous variable. The rationale for assessing a 4minute cutoff was to examine a previous fnding byPons and colleagues, which suggested a statisticallysignifcant difference with a 4-minute dichotomous response time4 ; a 9-minute cutoff was also included because this is a common response time goal for manyEMS systems.METHODSStudy DesignThis was a retrospective study (i.e., both exposure andoutcome had occurred prior to the commencement ofthe study) of a cohort of adult patients who receivedthe highest-priority EMS response between January 1,2006, and December 31, 2006.DefnitionsExposure was EMS response time, defned as the sumof activation and response intervals (interval of timebetween receipt of the 9-1-1 call and arrival of the EMSunit on scene), and outcome was defned as all-causemortality at hospital discharge.13,19Population and SettingThe study was set in an EMS system that respondsto calls for a population of approximately 1 million.This system has approximately 44 response units, allof which are ALS-equipped and -staffed. Units arestaffed with one ALS provider and one basic life support (BLS) provider, or two ALS providers, dependingon ALS staff availability. In 2006, this service recorded107,562 EMS unit responses. Based on information provided by the 9-1-1 caller, and interpreted by a registered emergency medical dispatcher using the MedicalPriority Dispatch System (MPDS), life-threatening situations were identifed and given the designation ofEcho- or Delta-level events. The MPDS is a uniformprotocol designed to obtain details on the nature ofan emergency from 9-1-1 callers to then determine theappropriate dispatch of resources to each emergencyevent.20 The MPDS rates the emergency from least serious (Alpha) to most critical (Echo).21 The dispatchof EMS units in this jurisdiction using the MPDS isconsistent with industry-accepted quality standards.In the jurisdiction for this study, an Echo- or Delta-levelevent elicited a lights-and-siren response from both thefre department, who provided BLS with defbrillation(BLS-D) frst response, and EMS, who provided ALStreatment and all transports if required. The EMS system has been designed for an EMS ALS response of·7 minutes 59 seconds on Echo and Delta emergencycalls.Human Subject Committee ReviewA health research ethics board approved this study andwaived the requirement for written informed consent.Experimental ProtocolThe study sample was constructed as follows: EMSunit responses were included if the patient was 18years of age and if the unit response resulted in atransport to an acute care facility. EMS data, whichwere collected from a single computer-aided dispatchdatabase, were linked to health system ED data employing a deterministic linkage strategy using patientcare record number (a shared tracking variable), dateof service, and frst and last names. Linked EMS–EDdata were subsequently linked to inpatient data alsoby a deterministic linkage using unique lifetime
144identifer (a health system tracking number), hospitalsite, and time of ED discharge and inpatient admission.From the EMS–ED and inpatient linked data, the studywas restricted to life-threatening events identifed atthe time of the 9-1-1 call (MPDS Echo- and Delta-leveldeterminants).Measurementsˆ ˆ ˇ ˆ ˆˆ ˇ " ! The exposure for this study was the time interval between receipt of the 9-1-1 call and arrival of the frstEMS unit on scene. The start time was automaticallycreated when the 9-1-1 call was answered and theend time was recorded when the EMS crew activatedthe mobile data terminal in the ambulance. In eventswhere multiple EMS units responded, the fastest timeto arrival on scene was used,13 as the frst EMS uniton scene would usually provide the immediate potentially time-sensitive prehospital interventions (e.g.,defbrillation).22 Unfortunately, BLS-D frst-responsedata were not available for this time period and couldnot be included.Potential covariates included patient acuity, age,gender, level of prehospital interventions (ALS or BLS),and combined scene and transport interval time (i.e.,time from arrival of the frst EMS vehicle on scene toarrival of the transporting unit at the hospital).23 Covariates were selected a priori based on clinical plausibility, previous literature on this topic, and availability.Patient acuity was assessed using the Canadian Triageand Acuity Scale (CTAS), which was scored on arrivalat the ED by the triage nurse, consistent with published standards (explained in detail in Table 1).24 Age,gender, and level of prehospital interventions were entered into the EMS database by the paramedic at thetermination of the event. Scene and transport intervalswere included to assess the effects of time to hospitalarrival on the response time and mortality association,as outcome from some conditions may be associatedwith shorter total prehospital times.25–28 All time intervals, for example, arrival of the EMS unit on scene,departure of the unit from the scene, and arrival of theunit at the hospital, were captured by the respondingcrew with a mobile data terminal in the ambulance.Analytical MethodsA univariable approach compared the risk of mortalityin patients who received a response time 8 minutes(exposed) with that of those who did not (unexposed).The risk of mortality was defned as the number ofpatients who died divided by the number of patientsin the exposure category. In addition, an odds ratio ofmortality with a 95% confdence interval (CI) was reported. Stratifed analysis and logistic regression wereused to further explore the exposure–outcome association. The potential modifying effects of covariates werePREHOSPITAL EMERGENCY CAREJANUARY/MARCH 2012VOLUME 16 / NUMBER 1assessed by the Mantel-Haenszel test of homogeneity, compared with previous study fndings, and considered within the context of clinical signifcance.29,30Confounding was assessed by comparing the crudeto adjusted odds ratios, and also considered inthe context of previous study fndings and clinicalsignifcance.30 Logistic regression was used to reportvalues adjusted for the a priori–determined covariates.The only exceptions to this were the CTAS score andthe level of prehospital interventions. The CTAS scorewas omitted prior to data analysis because of concernswith the timing of the assessment. Since this scale is applied at the time of hospital arrival, it is infuenced byexposure and prehospital treatment. It was thereforedecided to assess the potential effect of acuity only inthe sensitivity analysis. Similarly, level of prehospitalintervention may also be infuenced by the exposureand was also assessed only in the sensitivity analysis.Analyses were repeated while stratifying the dataset by those who were only cared for in the ED versus those who were admitted as an inpatient, and at4-minute (·3 minutes 59 seconds vs. 4 minutes) and9-minute (·8 minutes 59 seconds vs. 9 minutes) cutoffs. Logistic regression only was used to assess response time as a continuous variable. All analyseswere performed in Stata version 8.0 (StataCorp LP, College Station, TX).A simple sensitivity analysis was used to assessthe potential effects of selection bias, misclassifcationbias, and uncontrolled confounding on the crude8-minute effect estimate. There were two possiblesources of selection bias in this study: 1) the exclusionof unit responses that did not result in transport of thepatient to an acute care facility (i.e., because of deathat the scene) and 2) the exclusion of subjects whoseEMS and outcome data could not be linked. To assessthe potential effect of selection bias, we evaluated thechange in the crude risk estimate if we incorporatedfeld deaths from cardiac arrest of a medical origin orunit responses that were excluded because of missingdata or inability to link. In the unit responses excludedbecause of missing data or inability to link, severalscenarios were assessed, which included increasingthe mortality by 50% in those with a response time 8 minutes while decreasing it by 50% in those with aresponse time ·7 minutes 59 seconds, and vice versa.The primary area for misclassifcation bias was thedetermination of response time. It was possible thatan EMS unit was “held back” from a scene becauseof a safety concern; if this occurred, the reportedresponse time would underestimate true responsetime. Several scenarios were assessed to determine theinfuence on the crude effect estimate. It is possiblethat there was uncontrolled confounding by acuity;therefore, the CTAS score and the level of prehospitalinterventions (i.e., ALS or BLS) were assessed usingstratifed analysis and logistic regression to determine
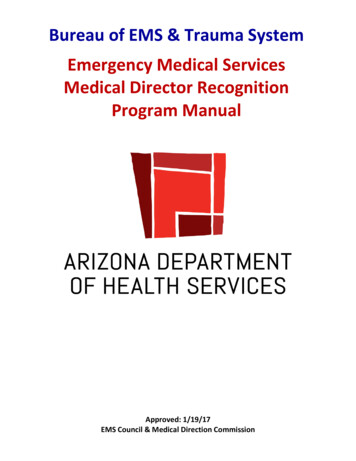
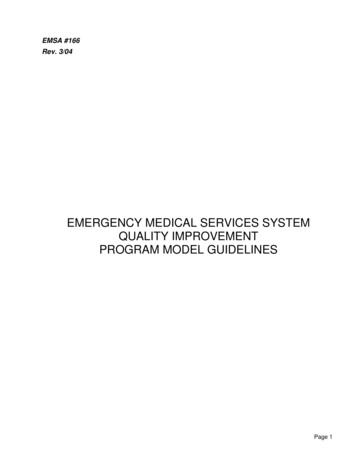
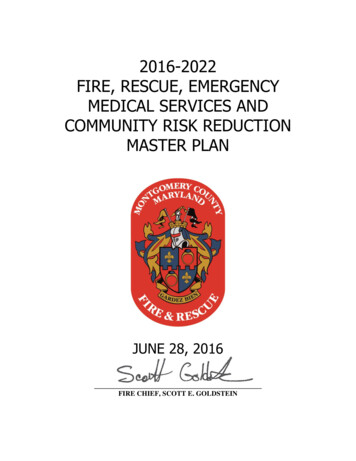
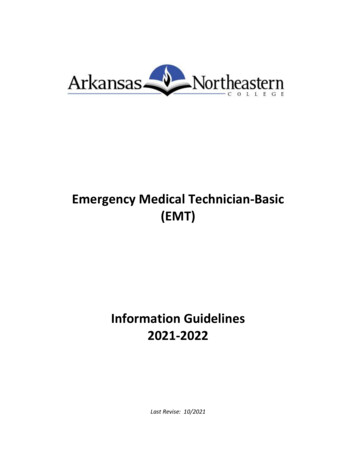
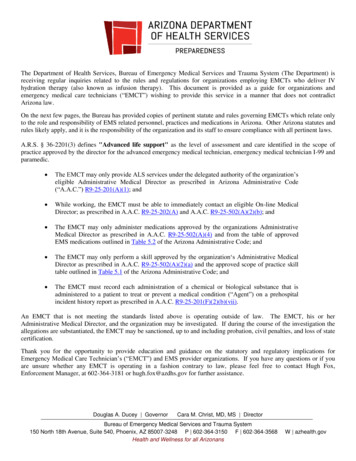
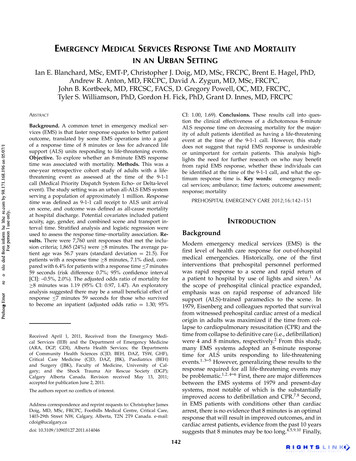
Blanchard et al.145EMS RESPONSE TIME IN URBAN SETTINGTABLE 1. Patient Characteristics 8 minutes (n 1,865)·7 minutes 59 seconds (n 5,895)Total (n 7,760)GenderFemaleMale822 (44.1%)1,043 (55.9%)2, 708 (45.9%)3,187 (54.1%)3, 530 (45.5%)4,230 (54.5%)CTAS Level 1Level 2Level 3Level 4Level 5150 (8.0%)975 (52.3%)686 (36.8%)54 (2.9%)0 (0.00%)519 (8.8%)3,025 (51.3%)2,203 (37.4%)146 (2.5%)2 (0.03%)669 (8.6%)4,000 (51.6%)2,889 (37.2%)200 (2.6%)2 (0.03%)Age—mean ( SD), years18 to 39 years40 to 64 years 65 years55.4 (21.2)488 (26.2%)670 (35.9%)707 (37.9%)57.2 (21.6)1,479 (25.1%)1,919 (32.6%)2,497 (42.4%)56.7 (21.5)1,967 (25.4%)2,589 (33.4%3,204 (41.3%)Combined scene and transport intervaltime—median (IQR), minutes39.1 (16.5)36.1 (14.1)36.7 (14.7)MPDS priorityDeltaEcho1,821 (97.6%)44 (2.4%)5,708 (96.8%)187 (3.2%)7,529 (97.0%)231 (3.0%)Level of care†‡ALSBLS917 (49.3%)943 (50.7%)2,904 (49.5%)2,968 (50.5%)3,821 (49.4%)3,911 (50.6%)Variableˆ ˆ ˇ ˆ ˆˆ ˇ " The Canadian Triage and Acuity Scale (CTAS) is used to prioritize patient care in Canadian emergency departments (EDs). It is applied on arrival at the ED by thetriage nurse. CTAS level 1 is defned as resuscitation, level 2 as emergent, level 3 as urgent, level 4 as less urgent, and level 5 as nonurgent.†All City of Calgary emergency medical services (EMS) response units are ALS-capable, but patient condition does not always warrant ALS-level care. ALS-levelcare criteria include patient’s prehospital index 4, medication administered, including fuid bolus, endotracheal intubation or attempted intubation, electricalcountershock, and surgical intervention; all other patients are categorized as BLS.‡Total N 7,732 ( 8 minutes 1,860; ·7 minutes 59 seconds 5,872).ALS advanced life support; BLS basic life support; IQR interquartile range; MPDS Medical Priority Dispatch System; SD standard deviation. ! whether including them would have changed theconclusions of this study. Sample Size DeterminationSample size was a convenience sample based on onecalendar year of data. The rationale for including onecalendar year was to capture the seasonal fuctuationsin the amount and type of events, as well as the seasonal differences on time intervals to these events, andto allow direct comparison with the results of the studyreported by Pons and colleagues.4RESULTSA total of 33,372 EMS unit responses resulted in transport of a patient 18 years of age to an acute carehospital; 31,385 such patients (94%) were successfullylinked between the EMS and ED databases (Fig. 1).Of the 31,385 linked records, 11,441 patients wereidentifed as being subsequently admitted to hospital, with 10,744 (94%) successfully linked between theED and inpatient databases. When the sample was restricted to EMS unit responses for Echo- and Deltalevel dispatches, 7,943 patients were linked betweenthe EMS and ED databases. A total of 183 of these patients could not be subsequently linked to the inpatientdatabase; therefore, 7,760 unit responses were includedin the overall analysis. There were 3,141 unit responseswhere the patient was admitted to hospital as an inpatient (Fig. 1).Overall, 1,865 out of 7,760 (24%) patients received aresponse time 8 minutes (exposed). The exposed andunexposed groups did not have clinically signifcantdifferences in key characteristics (Table 1). A total of508 patients died (6.6%), 170 in the ED and 338 afterthey were admitted to hospital.The overall risk of mortality in patients who receiveda response time 8 minutes was 7.1%, compared with6.4% with a response time ·7 minutes 59 seconds. Thedifference in the risk of mortality was 0.7% (95% CI:–0.5%, 2.0%). There was no evidence of individual effect measure modifcation or confounding by age, gender, or combined scene and transport interval time(Table 2). The odds ratio when adjusted for age, gender, and combined scene and transport interval timewas 1.19 (95% CI: 0.97, 1.47) (Table 3).When response time was treated as a continuousvariable by minute of response, there was no increased risk of mortality with increasing response time(Table 3). When response time was plotted againstthe risk of mortality by minute, the risk of mortalityappeared to increase up to 8 minutes, then becomevariable and decline with increasing response time(Fig. 2). When the analysis was restricted to patientswho were admitted to hospital as inpatients, there
146PREHOSPITAL EMERGENCY CAREEMS Datan 107,562Samplemeetinginclusioncriterian 34,394JANUARY/MARCH 2012VOLUME 16 / NUMBER 1Excluded:1. 18 years.2. Non emergency unit response (Alpha level and transfers).3. Emergency unit response without transport to an acutecare facility.n 73,168Excluded:Missing or conflicting data.n 1,022ˆ Sample forlinkagen 33,372 ˆ ˇ ˆ ˆˆExcluded:Not linked.ED n 1,987; IP n 697 ˇ " Data linked toED and IPED: n 31,385IP: n 10,744 Excluded:Bravo and Charlie unit responses.ED n 23,442; IP n 7,603 ! Final samplefor analysisED: n 7,943IP: n 3,141 Note: ED Emergency Department; IP In-patient FIGURE 1. Sample selection. ED emergency department; EMS emergency medical services; IP inpatient.was an increase in the adjusted odds ratio of mortalityat 8 minutes (1.30; 95% CI: 1.00, 1.69). At a 4-minuteresponse time, the difference in the risk of mortality fora response time of 4 minutes was 1.9% (0.3%, 3.4%),the crude odds ratio of mortality was 1.41 (1.03, 1.95),and the adjusted odds ratio was 1.35 (0.99, 1.83). Thesecondary analysis stratifed at a 9-minute responseshowed no association with mortality (Table 4).A simple sensitivity analysis suggested that sampleselection or misclassifcation of exposure, if present,was unlikely to have affected the observed results(Table 5). Patients with a CTAS level 1 were 20.59(15.50, 27.33) times, and with a level 2 were 1.64 (1.26,2.13) times, more likely to die than patients triagedwith a level 3, 4, or 5. Therefore, the CTAS score as determined at the time of ED triage did identify a moreacutely ill patient population insofar as identifying apopulation of patients at higher risk of death. Therewas no effect measure modifcation or confoundingby this scale. When the CTAS score was added tothe multiple logistic regression model, the adjustedodds ratio of mortality for those receiving a responsetime 8 minutes was 1.23 (0.98, 1.54). In addition, wealso assessed acuity by using the level of prehospital interventions applied to the patient (i.e., ALS orBLS—explained in detail in Table 1). The odds of mortality in patients receiving ALS-level care was 2.26(1.86, 2.76) times that of those receiving BLS-level care.
Blanchard et al.147EMS RESPONSE TIME IN URBAN SETTINGTABLE 2. Stratifed Analysis of Mortality by 8-Minute ResponseVariableCategoryAgeCrude18–39 years40–64 years 65 yearsMH pooledGenderFemaleMaleMH pooledˆCombined scene and transport interval time 30 min 30–35 min 36–44 min ˆ ˇ ˆ 45 min ˆˆ MH pooledˇ Exposure (min:sec)DeadAliveOR 8:00·7:59 8:00·7:59 8:00·7:59 8:00·7:59 8:00·7:59 8:00·7:59 8:00·7:59 8:00·7:59 8:00·7:59 8:00·7:59 8:00·7:59 8:00·7:59 .3495% CI " Odds of mortality given a response time 8 minutes over the odds of mortality given a response time ·7 minutes 59 seconds.Although this OR is different from those of the other strata, a reasonable biologically plausible hypothesis could not be found to account for this observation.Likewise, an examination of available literature did not demonstrate a similar fnding. In examining the data for the 18-to-39-year-olds, it was observed that thecell comprising deaths in the strata with response time 8 minutes was small. To examine the effect of the cell size on the stratum-specifc estimate, we moved twoindividuals from alive to dead in the stratum for 8 minutes, and two individuals from dead to alive in the stratum for ·7 minutes 59 seconds (four individualoutcomes were reassigned out of 1,967 observed unit responses). These changes resulted in a movement of the stratum-specifc OR for the 18-to-39-year-old groupto 0.96. In the absence of a biologically plausible explanation, or previously observed similar phenomenon, it is unlikely that this is effect-measure modifcation.CI confdence interval; MH Mantel-Haenszel; OR odds ratio.† ! The adjusted odds ratio of mortality for those receiving a response time 8 minutes when this variable wasadded to the multiple logistic regression model was1.20 (0.97, 1.48), with no effect measure modifcationor confounding. DISCUSSION Our study suggests that for adult patients identifedat the time of the 9-1-1 call as having a life-threateningevent, an EMS response of 8 minutes was not associated with an increase in all-cause mortality at hospitaldischarge. These results confrm fndings reportedby Pons and colleagues.4 These authors examined response time and mortality in a two-tiered BLS-D/ALSsystem in an American urban setting for all emergencyevents in which patients were transported to a singlereceiving facility.4 The authors reported an odds ratioof survival of 1.06 (0.80, 1.42) for an 8-minute responseadjusted for acuity, age, gender, scene, and transporttime. Blackwell and Kaufman reported no signifcant differences (p 0.10) in the median responsetime between survivors (n 5,353; 6.4 minutes) andnonsurvivors (n 71; 6.8 minutes) also in a two-tieredTABLE 3. Multivariable Models of Mortality and Response TimeContinuous Response Time†8-Minute Dichotomous Response Time VariableResponse timeAge§Gender Combined scene and transport interval time¶‡OR95% CIp-ValueOR95% 1.02–1.470.97–1.150.103 .341.02–1.470.97–1.150.285 0.0010.0330.222 8-Minute dichotomous response time 8 minutes versus ·7 minutes 59 seconds.Continuous response time response time by minute from 0 to 20 minutes, with all response times 20 minutes collapsed to the 20-minute category.‡Wald test.§ Age categories are in years: 18 to 39, 40 to 64, and 65 and greater. Female is the reference category.†¶ Combined scene and transport interval quartile category in minutes: 5 to 29.99, 30 to 35.99, 36 to 44.99, 45.CI confdence interval; OR odds ratio.
148PREHOSPITAL EMERGENCY CAREJANUARY/MARCH 201220%n1400Risk with 95% CI1200Note: CI 95% confidenceintervals calculated usingexact methods andtruncated at 0.15%100080010%6004005%Risk of MortalityFrequency1600VOLUME 16 / NUMBER 120000% 12 to 34 to 56 to 78 to 9 10 to 11 12 to 13 14 to 15 161 to 23 to 45 to 67 to 89 to 10 11 to 12 13 to 14 15 to 16Response Time (Minutes)ˆ FIGURE 2. Crude risk of mortality by response time, in minutes. CI confdence interval. ˆ ˇ ˆ ˆˆ ˇ " ! BLS-D/ALS American EMS system.5 These authorsalso reported a secondary analysis in which a convenience sample of three physicians reviewed the clinicalfeatures of the 71 nonsurvivors from their study. Thephysicians universally agreed that 59 (83%) nonsurvivors would not have survived with a faster EMSresponse time. An exploratory analysis in our studysuggested a small increase in the odds of mortalityfor patients who survived to be admitted to hospitaland who received a response time 8 minutes. Areasonable interpretation of this fnding may be thatpatients who were discharged directly from the EDwere going to live, and those who died in the EDwere going to die, either because they were too sick orbecause of some defciency in care. However, patientswho were admitted to hospital may have had a levelof acuity at which EMS response time, when combinedwith other interventions, affected the risk of death.When response time at 4 minutes was assessed, the TABLE 4. Mortality by Different Dichotomous ResponseTimesOR (95% CI) Exposure8 Minutes4 Minutes9 MinutesOutcomeCrudeAdjusted†Total mortalityED mortalityIP mortalityTotal mortalityED mortalityIP mortalityTotal mortalityED mortalityIP mortality1.13 (0.91–1.39)1.07 (0.73–1.53)1.24 (0.95–1.61)1.41 (1.03–1.95)1.23 (0.73–2.12)1.44 (0.96–2.20)0.86 (0.65–1.12)0.80 (0.49–1.27)0.94 (0.66–1.30)1.19 (0.97–1.47)1.07 (0.76–1.53)1.30 (1.00–1.69)1.35 (0.99–1.83)1.14 (0.70–1.87)1.44 (0.97–2.13)0.93 (0.72–1.21)0.83 (0.53–1.31)1.02 (0.73–1.41) 8 Minutes 8 minutes versus ·7 minutes 59 seconds; 4 minutes 4minutes versus ·3 minutes 59 seconds; and 9 minutes 9 minutes versus·8 minutes 59 seconds.†Adjusted for age, gender, and combined scene and transport interval time.CI confdence interval; ED emergency department; IP inpatient; OR odds ratio.adjusted odds ratio of mortality in this study was 1.35(0.99, 1.83), whereas Pons and colleagues reported anadjusted odds ratio of survival of 0.70 (0.52, 0.95),4 andBlackwell and Kaufman reported a statistically significant protective effect with a 5-minute response time.5While these results may suggest a small benefcial effect of decreasing response times to below 8 minutes,this study was not designed to answer the questionof what the optimum response time is. The fnancialcost of halving the response time standard would betremendous, and if this were contemplated it wouldbe benefcial to identify specifcally what conditionsmay beneft from a more rapid response, whether theseconditions can be identifed at the time of the 9-1-1call, and the cost-effectiveness of decreased responsetimes on the outcome from these conditions. When response time was treated as a continuous variable, ourresults are similar to those of Pons and colleagues,i.e., that there was no statistically signifcant increasein risk of mortality. Mortality
does not suggest that rapid EMS response is undesirable or unimportant for certain patients. This analysis high-lights the need for further research on who may beneft from rapid EMS response, whether these individuals can be identifed at the time of the 9-1-1 call, and what the op-timum response time is.