Transcription
Independent Study of Washington StateK-8 Curriculum ReviewFinal ReportOctober 27, 2008Prepared by:
Curriculum ReviewTable of ContentsIntroduction2Executive Summary2Charge to Strategic Teaching5Evaluation of OSPI’s Curriculum Review7Differences in Scoring Methods10Elementary School FindingsComparison of Content Alignment12Elementary School FindingsMathematical Soundness20Middle School FindingsComparison of Content Alignment24Middle School FindingsMathematical Soundness27Individual Mathematics Programs31Bridges in Mathematics31Holt33Investigations35Math Connects37Math Expressions39Math Thematics40Prentice Hall42Appendices44A. Descriptions of Mathematical Concepts44B. Comparison of OSPI and ST Rubrics49C. Average Difference by Grade Level Topics50D. Relationship Between OSPI and ST Scores51E. Strategic Teaching Team521
Curriculum ReviewIntroductionWith the Washington State K – 12 Mathematics Standards firmly in place,Washington has turned its attention to finding instructional programs andmaterials that align with those standards. To a large degree, curriculumcontrols what is learned and how it is learned. Sound programs can helpguide new teachers and can shore up the skills of teachers who lack astrong background in mathematics. Good curricula also provide top-notchteachers the materials they need to do their best work.The Office of the Superintendent of Public Instruction, OSPI, was tasked bythe legislature to identify programs for elementary and middle school. Aftera thorough curriculum review, OSPI presented its initial recommendations,Math Connects (K–5) and Bridges in Mathematic for elementary schoolsand Holt Mathematics and Math Connects (6–8) for middle schools, to theWashington State Board of Education, SBE, during the October SBE Boardmeeting.The SBE recognizes the importance of choosing wisely since the mathematicsprograms that school districts implement drive instruction. With so much atstake, SBE requested that Strategic Teaching, ST, work with the SBE Math Panelto study the OSPI review. The purpose is to ensure that OSPI’s highest-rankedprograms offer students the best possible opportunity to meet the state’smathematics standards.Executive SummaryDuring June of 2008, OSPI reviewed twelve elementary and thirteenmiddle school mathematics programs in order to determine which bestalign to Washington’s standards. While no one expects that a single set ofinstructional materials will match perfectly to Washington’s content, OSPIwants to identify those programs that come closest. OSPI will also identifysupplemental programs that fill content gaps.OSPI’s curriculum review process involved four independent examinationsof each program and a statistical analysis of the results. This produced twoseparate rank orderings of programs: one for grades K–5 and one for grades6–8. The final report also includes detailed information for every programthat was examined, down to the standard level.2
Curriculum ReviewAt the request of the SBE, with guidance from the SBE Math Panel,ST reviewed OSPI’s work. ST’s work included four components.Specifically, ST:Reviewed the approach used by OSPI;Judged the degree to which the content in OSPI’s top-ranked programsmatch the Washington’s standards and compared its findings to those ofOSPI;Provided an analysis, by an internationally recognized mathematician, ofcore mathematics topics in each program to determine the mathematicalsoundness of each program; andSummarized the key characteristics of each program.ST found the approach OSPI used to review curriculum rigorous andsimilar in many ways to those used in most jurisdictions. OSPI’s contractor,Relevant Strategies, was professional and thorough at each stage of theprocess. There are other methods of statistical analysis that might have beenemployed, but there is no reason to believe the outcomes would have beendifferent. Most importantly, the curriculum review was designed to be fairto all publishers.ST reviewed Bridges in Mathematics, Investigations, Math Connects,and Math Expressions for elementary school. Holt Mathematics, MathConnects, Math Thematics, and Prentice Hall Mathematics were reviewedat the middle school level. These are OSPI’s highest-scoring programs.Other programs, such as the Connected Math Project that is widely used inWashington schools, were not reviewed because they did not meet OSPI’sminimum threshold for content.The comparison between OSPI’s results and ST’s results regarding howwell the content in particular programs match to the state’s standards iscomplex. ST’s average scores were as high or higher than OSPI’s averagescores in all but two programs. However, there is a great deal of variationbetween the average scores of the two groups at the standard level andeven at the topic level.Many factors contribute to the variation in scores. OSPI and ST usedrubrics with different numbers of points, OSPI conducted twice as manyindependent reviews of each program as did ST, and ST didn’t give creditfor off-grade level content. Also, ST looked at every lesson in everyprogram while OSPI looked at the lessons identified in the publisher’salignment. This means ST looked at more material for some standards,causing higher scores.3
Curriculum ReviewAnother important consideration is that rubric-based scoring involvesapplying professional judgment. The reason one has multiple reviewers isthat reasonable people can look at the same materials and draw differentconclusions about sufficiency of practice for a standard, for example.ST believes that all of these factors contributed, in varying degrees, to thescores for each standard. Still, they converge meaning that ST’s results verifyOSPI’s work.ST included a mathematician’s review of core topics—whole numbermultiplication, area of triangle, addition, subtraction, multiplication, anddivision with fractions and proportionality—to see how each is developedacross grade levels in the programs under review. This is an examinationof whether or not the instructional materials accurately represent the fieldof mathematics and whether or not errors related to the topics exist. To beclear, a mathematician is someone who studies the field of mathematicsand is not an expert on teaching mathematics to students or on preparingteachers to do so.ST’s findings support using Math Expressions and Math Connects at theelementary level.ST determined Math Expressions to be a rare find because it includesthe conceptual underpinnings and the procedural knowledge, with clearexplanations between the two, for each of the core topics examined by themathematician. Math Connects offers an acceptable choice, because itsfew shortcomings are easily remedied.ST found problems in the presentation of some of the mathematics inboth Bridges and Investigations. While no program can be expected to bea perfect fit for Washington, these programs will need more support andsupplementation than the other two programs under consideration.ST’s findings support using Math Connects, Holt Mathematics, and PrenticeHall Mathematics at the middle school level.At the middle school level, Math Connects is the strongest program,because it is better aligned to the state’s standards than the other reviewedprograms and because it needs only a small amount of supplementationto be mathematically complete for the examined topics. Holt Mathematicsand Prentice Hall Mathematics are acceptable choices because they, too,include most of the content in the standards. Student success with thesetwo programs is more dependent on knowledgeable teachers to makeconnections among mathematical topics and to explain why procedureswork.Math Thematics, which has many characteristics ST liked, is mathematicallyproblematic in its treatment of proportionality.4
Curriculum ReviewCharge to Strategic TeachingSBE asked ST to do three tasks.First, SBE asked ST to evaluate the process used by OSPI. A detaileddiscussion of OSPI’s methods, including a comparison to those used by ST,begins on page 7 of this report. What is most important to know is thatOSPI rigorously applied practices commonly used to review curriculum.The process afforded every program an equal opportunity to be selected.Second, SBE asked ST to determine how well the content in OSPI’s highestranking programs matches the content in Washington’s standards ingrades two, four, and seven. At the elementary school level, Bridges inMathematics, Investigations, Math Connects, and Math Expressions wereexamined. At the middle school level Holt Mathematics, Math Connects,Math Thematics, and Prentice Hall were reviewed.The relationship between the amount of matching content OSPI found ina program and the amount of matching content ST found in a matchingprogram is complicated. In general the results converge, but scores forindividual standards and for grade level topics often differ. Even when thetotal content for a program is similar, the content is often found in differentstandards.More details about the comparison can be found in the sections for“Elementary School Findings” and “Middle School Findings.”Third, SBE requested that a mathematician review the programs todetermine whether or not each is mathematically sound. To do this, STidentified core topics and examined their development across grade levels,from introduction to consolidation. ST looked at both the conceptual andthe procedural sides of the topics, as well as how thoroughly proceduresare explained. The topics of whole number multiplication, area of a triangle,arithmetic of fractions, and proportionality were examined.Results can be found in the sections for “Elementary School Findings,”“Middle School Findings,” and “Individual Mathematics Programs.”Organanizing the information this way does cause duplication but hopefullyincreases the report’s usefullness to the reader.In addition to SBE’s charge, the SBE Math Panel expressed concerns for STto investigate.One concern was that OSPI’s statistical analysis eliminated two programsat the elementary school level and two programs at the middle school levelthat should be included in ST’s review. A strong case can be made that these5
Curriculum Reviewprograms are statistical ties to programs that are included in the top fourranked programs. ST appreciates this concern, noting that ST would alsohave taken a different approach to the analysis. However, OSPI’s methodsare both sound and common, so ST was only tasked with the job of revisingthe four programs identified by OSPI.Another concern centered around the weighting of some standards or strands.There was a discussion about some standards being more important thanothers and that important standards should be accorded more weight inthe scoring process. Given the difficulty of finding consensus about whichstandards are most important, ST believes that reporting information by strandwill at least provide information about where strong content matches exist.ST looked at the differences in alignment scores in topics across gradelevels to see if any troublesome patterns or inconsistencies appeared. Thisdoes not seem to be the case: there are no patterns to the discrepanciesbetween OSPI and ST scores. The chart in Appendix C summarizes thedifferences by topics and grade levels.The Panel also had questions about how OSPI and ST score standards thatreceive middle scores. A detailed discussion can be found in Appendix D,but broadly speaking, standards that receive a low total score from OSPItend to receive a low total score from ST. Standards that receive a high totalscore from OSPI, tend to receive a high total score from ST.One last point about the curriculum review should be noted. New programsand updated editions are published every year. Washington needs to establisha system of regularly and methodically considering new instructional materialsfor all subject areas.6
Curriculum ReviewEvaluation of OSPI’s Curriculum ReviewOSPI contracted with Relevant Strategies to conduct a review of allcomprehensive elementary and middle school mathematics programs.Relevant Strategies applied the highest standards of professionalism tocomplete this task. It is clear that the review was designed to answer anopen question, “Which sets of instructional materials meet the WashingtonState standards?” and not to support a foregone conclusion.Meticulous attention to details throughout the process minimized thepossibility that unconsidered factors would influence outcomes. Forexample, each publisher had the same amount of square footage to displayits materials. Serious effort was made to eliminate or at least minimize biasfrom usual sources. In particular, each reviewer was asked if he or she couldreview a specific program fairly—without bias—before he or she was giventhat program to evaluate.OSPI convened a group of forty-two peoplebetween June 22 and June 27, 2008, to reviewthe instructional materials. During that time thereviewers received training on the standardsand training related to scoring. The work wassupported with daily meetings to discussissues related to scoring and continuous onsite access to expertise. Almost every program had four reviews, but timeconstraints meant that one program at one grade level was reviewed by three,rather than four, reviewers.It is clear that the review was designedto answer an open question, “Whichsets of instructional materials meetWashington’s standards?” and not tosupport a foregone conclusion.Reviewers used a three-point rubric to match and score every standard forevery program at every grade level, kindergarten through eight. The points onOSPI’s rubric for content ranged from zero, meaning the standard is not met, totwo, meaning the standard is fully met.Reviewers who scored the same standard zero and two—a differenceof two points—were given the opportunity to discuss their rationaleand change their scores. The reviewers were systematically assignedand reassigned in ways that reduced the possibility of “scorer drift,” thetendency of a group that works together for an extended period of timeto begin to think7and score alike in ways that may be different than themain group.A total of 12 elementary programs and 13 middle school programs wereevaluated.7
Curriculum ReviewOSPI scored and ranked the programs on multiple components. Specificallyit examined the degree to which each program aligns with the content inWashington’s K – 8 Mathematics Standards and 1) quality of the program’sorganization and design, 2) balance of student experience, 3) assessment,4) instructional planning and professional support, and 5) equity and access.The scores were used to compute scaled composite scores1 that weightedcontent 70 percent of the overall score. There is some variation in theweights given to the other attributes, but the total contribution of the noncontent factors is 30 percent. The average of all of the scaled compositescores of the standards across all of the grade levels produced a rankordering of elementary school programs and another rank ordering ofmiddle school programs.Particularly commendable aspects ofOSPI’s review are 1) the amount of inputand feedback from stakeholder groups,2) the rigorous attention to detail ininventory, training, and scoring, and 3)the specificity of the results and theirusefulness to school districts.OSPI applied a particularly formal and systematicapproach to its process—the type often associated withassessment events. Given the interest and tension aroundcurriculum in Washington, the exceptional attention todetail was probably wise.There is probably no best way for a jurisdiction to reviewcurriculum. OSPI’s methods are well within the typicalrange and meet the most critical criteria: the process wasinclusive and it fairly considered all viable programs.Particularly commendable aspects of OSPI’s review are 1) the amount of inputand feedback from stakeholder groups, 2) the rigorous attention to detail ininventory, training, and scoring, and 3) the specificity of the results and theirusefulness to school districts.All this said there are three areas that ST would have approached differently.First, mathematicians should have been involved in reviewing theinstructional materials. Content can be included but presented in ways thatbuild long-term misunderstandings among students. While mathematiciansdo not necessarily understand the pedagogical issues related to teachingmathematics, they bring a knowledge of the discipline of mathematics thatmost mathematics educators lack.Second, a four-point rubric has inherent advantages over a three-pointrubric. The additional score point forces more refined decisions and the evennumber of levels forces the reviewer to make a decision about whether thestandard is closer to “completely met” or “completely missing.” Last, the1 The score that is given divided by the maximum possible score, which converts the score to a scale of “1”. Thismeans a standard judged fully met all the points gets “1” no matter how many actual points are awarded and allowscomparisons to be made because the scale is the same.8
Curriculum Reviewmiddle level in odd-numbered rubric tends to become a catchall and toreceive a disproportionate number of scores.2Third, there are two questions about the statistical analysis. To be clear,ST is not suggesting that the results would be different from thoseproduced by OSPI because of the data analysis.ST questions how well the data set stands up to the amount of analysisthat has been done. The simplest example can be seen in the scaled score.This is the average of four scores that range from zero to two translatedto a one-point scale. To take the scaled average of these professionaljudgments, opinions really, out beyond one or two decimal places gives afalse impression about precision of the data.ST also questions the method employed by OSPI tolook at reviewer bias. OSPI chose to use t-test andadjust for multiple comparisons, which is a soundeducational statistics method. ST believes that amore appropriate approach would have been toapply the generalizability theory, a methodologydesigned for situations exactly like curriculum review. That being said, OSPI’sapproach is able to identify programs that align to Washington’s standards andother methods most likely would not have altered on these results.To take the scaled average of theseprofessional judgments, opinions really, outbeyond one or two decimal places gives a falseimpression about the precision of the data.2 Wiggins, Grant P. Educative Assessment: Designing Assessment to Inform and Improve Student Performance(San Francisco: Jossey-Bass, 1998), VI-5:1. Retrieved from Knowledge Quest on the Web on October 4, fm#Ref69
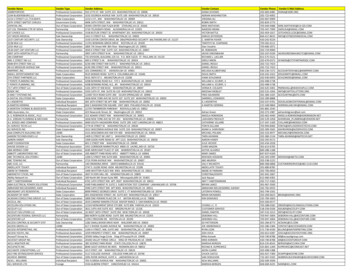
Curriculum ReviewDifferences in Scoring MethodsThere are differences—important differences—between the approaches ofOPSI and ST that are largely driven by the differences in project goals. OSPIhad the task of reviewing all viable comprehensive mathematics programsin order to recommend up to three programs for the elementary schoolsand up to three programs for middle schools. ST has the task of reviewingOSPI’s work and so has only to sample and verify OSPI’s results. Thesedifferences are summarized in the following chart.OSPIReviewed ProgramsContent IdentificationScored AttributesST12 Elementary4 top-ranked elementary13 Middle4 top-ranked middlePublisher’s alignment is usedto locate matching lessons.Reviewers examine lessonsto determine if the contentmatches the standard. Aftercontent is scored, reviewersmake overall judgments aboutthe other attributes that areevaluated.Every lesson is reviewed and the content in thelesson mapped to the standards. After the scoring iscomplete, the publisher’s alignment is used to doublecheck that all identified lessons are considered. Notesabout the program are taken throughout the processand then used to discuss the non-scored attributes atthe end.ContentProgram organization and designBalance of student experienceAssessmentInstructional planning andprofessional supportContentEquity and accessST mathematician, W. Stephen Wilson, Ph.D., reviewskey topics and their development across grade levels.For this review, grade placement is not importantMathematician ReviewProgram organization and designInstructional approachesNon-Scored AnalysisPresence of extra content in the program and not inthe standardsGeneral program usabilityNumber of Reviews4 independent reviews2 independent reviewsNumber of Reviewers424*An average of 3.5 hours is spentper review.This time was not carefully monitored, but reviewersreport spending between 6 and 18 hours on a programat a grade level. The majority of the reviews, includingdiscussion time between reviewers, range from 9 to 12hours.Time Spent on ReviewNon-matching ScoresGrade LevelsTrainingRubricReviewers who have scores with2-point spreads, discuss thosedifferences and make changesbased on their own discretion.Reviewers discuss all non-matching scores (1-pointspread) and make changes based on their owndiscretion.All grades, K – 8Extensive training on standards;training on rubric and reviewprocess; daily calibrationmeetings2, 4, 7Reviewers had intimate knowledge of standards;collaborative rubric development; calibration trainingusing curriculum materials from project3-point rubric4-point rubric*Biographical information on ST reviewers can be found in Appendix E10
Curriculum ReviewThere are some differences that cannot be mitigated. While there is theadditional detail that naturally travels with additional score points in ST’srubric, there is one missing element that should be noted. OSPI considerscontent that is above or below grade level by a year to be partially meetingthe standard and deserving of a “one” score. Since ST only reviewedselected grade levels and reviewers did not have access to off-gradematerials, it did not do this. Such standards would receive a zero fromST. Appendix B offers a side-by-side comparison of the score points thatmatch to each other on the OSPI and ST rubrics.The effects of some of the differences in scoring approaches can beminimized. For example, as previously discussed, using scaled scores allowscomparisons between three-point rubrics and four-point rubrics.Focusing ST’s work to look at OSPI’s scores related to the content matchalso helps. This defines the work as an apples-to-apples comparison bycreating a common core—content—that both groups examine. Fortunately,OSPI maintained separate data for its content scores.In both reviews, trained and skilledadults apply a rubric to determinethe degree to which the content in astandard is covered in a particularmathematics program.The effects of some of the differences, such as theadditional time spent by ST, are hard to determine.It seems reasonable there will be an effect, and thatthis effect will vary. Publishers should have identifiedthe important content matches for OSPI reviewersto examine, but this is not the same as ST havingunlimited time to examine every lesson in detail.Some of the differences, such as the mathematician’s review, will have noeffect on the numerical scores. This is a separate analysis and the results arenot co-mingled.Despite these differences, the reviews are more similar than not. In bothreviews, trained and skilled adults apply a rubric to determine the degreeto which the content in a standard is covered in a particular mathematicsprogram. Both OSPI and ST are interested in identifying programs thatmake it likely the typical student in an ordinary classroom will meet thestandard.While it is not reasonable to expect the numbers to match exactly, it isreasonable to expect ST’s process to verify OSPI’s results.11
Curriculum ReviewElementary School FindingsComparison of Content AlignmentThe major purpose of this study is to determine whether or not ST agreeswith OSPI’s findings related to how well the content in selected mathematics programs aligns to Washington’s standards.In order to compare ST’s results to those of OSPI, the average scaled scoreis computed for each standard for both groups. To do this all of the scoresare added together and divided by the total possible points. This puts eachgroup’s average score on a scale of one, making comparison much easier.For example, if four OSPI reviewers scored a particular standard 0-1-1-1, thescaled score would be 3 8 0.38, since 8 is the maximum number of pointspossible based on the OSPI rubric that was used. SupposingThere is danger in reading that two ST reviewers gave this hypothetical standard thetoo much into these scores of 1-2, the corresponding scaled score would benumbers, particularly at 3 6 0.50, since ST uses a rubric with three at the highestscore. This allows the results to be compared on the samethe standard level. scale and shows a difference of 0.12.There is danger in reading too much into these numbers, particularly at thestandard level. At first glance, in the example above, one might think thatST found a better content alignment in the particular standard than didOSPI. Actually, OSPI and ST agree that the program is missing content and/or key teaching strategies. The difference is due to the combination of OSPIhaving more reviews of the program and ST having more score points on itsrubric. The point is, there will frequently be differences in scores, even whenreviewers agree.As scores are aggregated, the artificial differences related to scoring methodology should disappear. For that reason, ST is comparing results at themathematical topic and at the grade level, rather than at the individualstandard level.In an attempt to make sense of the differences, ST is using the percentform. It is easier to talk and think about a 12 percent difference, thanone of 0.12. Another word of caution is in order. Even with a literalinterpretation, a difference of 12 percent means that ST found 12 percentmore total alignment between the content and the program than OSPI. Itdoes not mean ST found 12 percent more content alignment than did OSPI,which would be an increase of 0.12 over 0.38 or an increase in alignmentof 32%.12
Curriculum ReviewA false sense of precision can be implied when averages are calculated tomultiple decimal places. For this reason, ST will use only two decimal placesin its tables.Another danger associated with over analysis of this data is that rubricbased evaluation is not a precise science. Reasonable people, making everyattempt to make fair decisions, can draw rational conclusions that differ.All that said, quantifying the numbers offers precious insight into reviewerthinking and allows systematic evaluation and comparison that wouldn’totherwise be possible. With the limits of the methodology clearly in mind,ST will assume that differences at the mathematical topic and grade levelrepresent real differences in the evaluation of content alignment, even ifthose differences are not perfectly captured by the numbers.Grade 2Bridges in Mathematics2.1. Place value and the base ten system2.2. Addition and subtraction2.3. Measurement2.4. Additional key content2.5. Reasoning, problem solving, and communicationBridges Grade 2 Average Scale ScoreInvestigations2.1. Place value and the base ten system2.2. Addition and subtraction2.3. Measurement2.4. Additional key content2.5. Reasoning, problem solving, and communicationInvestigations Grade 2 Average Scale ScoreMath Connects2.1. Place value and the base ten system2.2. Addition and subtraction2.3. Measurement2.4. Additional key content2.5. Reasoning, problem solving, and communicationMath Connects Grade 2 Average Scale ScoreMath Expressions2.1. Place value and the base ten system2.2. Addition and subtraction2.3. Measurement2.4. Additional key content2.5. Reasoning, problem solving, and communicationMath Expressions Grade 2 Average Scale Score* Apparent discrepencies in the difference are the result of roundingOSPI Scores by ST ScoresSectionby -2%-3%18%13%-6%2%24%6%16%-7%1%11%13
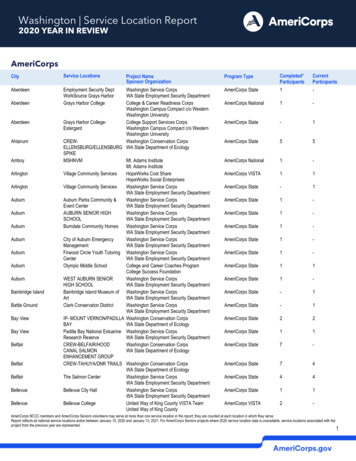
Curriculum ReviewGrade 4OSPI Scores by ST ScoresSectionby SectionDifferenceBridges in 80.620.854.1 Multi-digit Multiplication4.2 Fractions, decimals, and mixed numbers4.3 Concept of area0.680.340.440.580.350.61-9%1%17%4.4 Additional key content4.5 Reasoning, problem solving, and communication0.410.600.540.4814%-12%Investigations Grade 4 Average Scale 90.773%-6%-4%-2%8%4.1 Multi-digit Multiplication4.2 Fractions, decimals, and mixed numbers4.3 Concept of area4.4 Additional key content4.5 Reasoning, problem solving, and communicationBridges Grade 4 Average Scale Score31%32%30%7%27%26%InvestigationsMath Connects4.1 Multi-digit Multiplication4.2 Fractions, decimals, and mixed numbers4.3 Concept of area4.4 Additional key content4.5 Reasoning, problem solving, and communicationMath Connects Grade 4 Average Scale Score0.760.760%Math Expressions4.1 Multi-digit Multiplication4.2 Fractions, decimals, and mixed numbers4.3 Concept of area0.690.640.600.920.870.9723%23%37%4.4 Additional key content0.380.9456%4.5 Reasoning, problem solving, and communication0.350.7742%0.530.9037%Math Expressions Grade 4 Average Scale ScoreThere is a lot to say about how ST’s results compare to OSPI’s results.In a perfect world, there would be a more consistent relationship betweenST’s results and OSPI’s results. Sometimes, as in grade 2 Investigationsand Math Connects ST virtually matches OSPI’s scores. Other times, as ingrade 2 Bridges, ST scored a much weaker content match. And still othertimes ST finds the content alignment between a program and Washington’sstandards to be stronger than
ST reviewed Bridges in Mathematics, Investigations, Math Connects, and Math Expressions for elementary school. Holt Mathematics, Math Connects, Math Thematics, and Prentice Hall Mathematics were reviewed at the middle school level. These are OSPI's highest-scoring programs. Other programs, such as the Connected Math Project that is widely used in