Transcription
Volume 11, Number 1ISSN 1524-7252ACADEMY OF INFORMATION ANDMANAGEMENT SCIENCES JOURNALSharad K. MaheshwariEditorHampton UniversityEditorial and Academy Informationmay be found on the Allied Academies web pagewww.alliedacademies.orgThe Academy of Information and Management Sciences Journal is owned andpublished by the DreamCatchers Group, LLC, and printed by Whitney Press, Inc.Editorial Content is controlled by the Allied Academies, a non-profit association ofscholars, whose purpose is to support and encourage research and the sharing andexchange of ideas and insights throughout the world.Whitney Press, Inc.Printed by Whitney Press, Inc.PO Box 1064, Cullowhee, NC 28723www.whitneypress.com
iiAll authors must execute a publication permission agreement taking soleresponsibility for the information in the manuscript. The DreamCatchers Group,LLC is not responsible for the content of any individual manuscripts. Any omissionsor errors are the sole responsibility of the individual authors.The Academy of Information and Management Sciences Journal is owned andpublished by the DreamCatchers Group, LLC, PO Box 2689, Cullowhee, NC 28723,USA. Those interested in subscribing to the Journal, advertising in the Journal,submitting manuscripts to the Journal, or otherwise communicating with theJournal, should contact the Executive Director of the Allied Academies atinfo@.alliedacademies.org.Copyright 2008 by the DreamCatchers Group, LLC, Cullowhee, NCAcademy of Information and Management Sciences Journal, Volume 11, Number 1, 2008
iiiACADEMY OF INFORMATION AND MANAGEMENT SCIENCES JOURNALEDITORIAL BOARD MEMBERSKhaled AlshareEmporia State UniversityStephen E. LunceTexas A&M International UniversityCarol BrutonPalomar CollegeSamia MassoudPrairie View A&M UniversityEugene J. CalvasinaSouthern University and A&M CollegeJames R. MaxwellState University of New YorkRobert F. Cope IIISoutheastern Louisiana UniversitySteve MossGeorgia Southern UniversityRobert CordnerBusiness Solutions Consultants Ltd.James P. MurphyTroy State UniversityPaul Sheldon FooteCalifornia State University FullertonJames A. NelsonNew Mexico State UniversityCarter FranklinDeVry UniversityLinus OsuagwuFederal University of Technology Owerri NigeriaJohnny C. HoColumbus State UniversityAllam Appa RaoAndhra University College of EngineeringRichard C. HicksFlorida Atlantic UnivesityLee RevereUniversity of Houston Clear LakeI-Lin HuangLangston UniversityGary P. SchneiderQuinnipiac UniversityAdam S. HuarngCalifornia State University Los AngelesCharlotte StephensLouisiana Tech UniversityT. Prasanna JacksonKarunya Institute of TechnologyPeter Wibawa SutantoPrairie View A&M UniversityRaghu KorrapatiWebster UniversityLloyd J. Taylor IIIUniversity of Texas of the Permian BasinOjoung KwonCalifornia State University FresnoJiaqin YangGeorgia College and State UniversityRod LievanoUniversity of Minnesota DeluthSehwan YooUniversity of Advancing TechnologyStephen L. LoyEastern Kentucky UniversityAcademy of Information and Management Sciences Journal, Volume 11, Number 1, 2008
ivACADEMY OF INFORMATION ANDMANAGEMENT SCIENCES JOURNALCONTENTSEDITORIAL BOARD MEMBERS . . . . . . . . . . . . . . . . . . . . . . . . . . . . . . . . . . . . . . . . . . . . . . . iiiLETTER FROM THE EDITOR . . . . . . . . . . . . . . . . . . . . . . . . . . . . . . . . . . . . . . . . . . . . . . . . viiREDUCING PERCEPTUAL DIFFERENCES INEND USERS: POTENTIAL AND POSSIBILITIESFOR CONTINUING TRAINING PROGRAMS . . . . . . . . . . . . . . . . . . . . . . . . . . . . . . . 1TerryAnn Glandon,University of Texas at El PasoSid Glandon, University of Texas at El PasoMichael W. Boyd, Western Carolina UniversityVALUE CHAIN MANAGEMENT IN ONLINEREVERSE AUCTION: TOWARDS STRATEGICAND OPERATIONAL EXCELLENCE . . . . . . . . . . . . . . . . . . . . . . . . . . . . . . . . . . . . . 13Leslie Leong, Central Connecticut State UniversityTHE REVOLUTION OF SIX-SIGMA:AN ANALYSIS OF ITS THEORY AND APPLICATION . . . . . . . . . . . . . . . . . . . . . . 29Dominique Drake, Florida A&M UniversityJ. S. Sutterfield, Florida A&M UniversityChristopher Ngassam, Florida A&M UniversityAcademy of Information and Management Sciences Journal, Volume 11, Number 1, 2008
vCOMPARISONS OF PERFORMANCES BETWEENONLINE LEARNERS AND OFFLINE LEARNERSACROSS DIFFERENT TYPES OF TESTS . . . . . . . . . . . . . . . . . . . . . . . . . . . . . . . . . . 45Sungkyoo Huh, California State University-San BernardinoSehwan Yoo, University of Advancing TechnologyJongdae Jin, University of Maryland-Eastern ShoreKyungjoo Lee, Cheju National UniversityIS PROCESS INNOVATION EVOLUTION INORGANISATIONS . . . . . . . . . . . . . . . . . . . . . . . . . . . . . . . . . . . . . . . . . . . . . . . . . . . . 65Erja Mustonen-Ollila, Lappeenranta University of Technology, FinlandJukka Heikkonen, European Commission-Joint Research Centre Institutefor the Protection and Security of the Citizen, ItalyLONG TERM SURVIVAL AND QUALITYINFORMATION SYSTEMS:A LONGITUDINAL CASE STUDY . . . . . . . . . . . . . . . . . . . . . . . . . . . . . . . . . . . . . . . 89Judith A. Harris, Nova Southeastern UniversityThomas M. Tworoger, Nova Southeastern UniversityLeslie C. Tworoger, Nova Southeastern UniversityAcademy of Information and Management Sciences Journal, Volume 11, Number 1, 2008
viAcademy of Information and Management Sciences Journal, Volume 11, Number 1, 2008
viiLETTER FROM THE EDITORWe are extremely pleased to present the Academy of Information and Sciences Journal, anofficial journal of the Academy of Information and Management Sciences. The AIMS is an affiliateof the Allied Academies, Inc., a non profit association of scholars whose purpose is to encourageand support the advancement and exchange of knowledge, understanding and teaching throughoutthe world. The AIMSJ is a principal vehicle for achieving the objectives of the organization. Theeditorial mission of this journal is to advance the knowledge and understanding of information andmanagement science throughout the world. To that end, the journal publishes high quality,theoretical and empirical manuscripts which advance the discipline.The manuscripts contained in this volume have been double blind refereed. The acceptancerate for manuscripts in this issue, 25%, conforms to our editorial policies.Our editorial policy is to foster a supportive, mentoring effort on the part of the refereeswhich will result in encouraging and supporting writers. We welcome different viewpoints becausein differences we find learning; in differences we develop understanding; in differences we gainknowledge and in differences we develop the discipline into a more comprehensive, less esoteric,and dynamic metier.The Editorial Policy, background and history of the organization and of the AlliedAcademies, and calls for conferences are published on the Allied Academies website. Please visitour site and know that we welcome hearing from you at any time.Sharad K. MaheshwariHampton Universitywww.alliedacademies.orgAcademy of Information and Management Sciences Journal, Volume 11, Number 1, 2008
viiiAcademy of Information and Management Sciences Journal, Volume 11, Number 1, 2008
1REDUCING PERCEPTUAL DIFFERENCES INEND USERS: POTENTIAL AND POSSIBILITIESFOR CONTINUING TRAINING PROGRAMSTerryAnn Glandon,University of Texas at El PasoSid Glandon, University of Texas at El PasoMichael W. Boyd, Western Carolina UniversityABSTRACTPerceptions of two groups of end users were compared on importance of and satisfactionwith support services provided by information technology (IT) personnel. Importance ratings of onegroup of users were significantly higher than the other group. Surprisingly, satisfaction ratingswere virtually identical. In prior research, users who placed higher importance on IT support wereless satisfied than the comparison group when those expectations were not met. Establishment ofcontinuous training programs for end users is encouraged to reduce perceptual differences, improveend user satisfaction, job satisfaction for IT personnel, and meet organizational requirements.INTRODUCTIONThis research compares the perceptions of different groups of end users on two dimensionsof information technology (IT) support.1 One dimension is the level of importance of certainfeatures (response time, follow through, etc.) associated with IT support. The second dimension isthe users’ reported level of satisfaction associated with these IT support features. If a particularfeature is very important to the user it is expected that such user will not be satisfied unless his orher expectations are met.Various aspects of end user satisfaction have been studied in prior research.2 However, theseissues continue to be important to researchers and to organizations. Indeed, Lee, Kim and Lee(1995) call for increased research into the personal and organizational impact of end user computingin an organizational context because of the use of end user computing as a “competitive weapon.”To achieve competitive advantage organizations must ensure that IT support helps end usersmaximize use of information technology. The first step in designing effective IT support is to obtainan understanding of what end users believe are important services. Focusing resources on these ITsupport features can improve efficiency and satisfaction among end users. If IT support is able tomeet end user needs in the initial contact, waiting time and callbacks can be reduced or eliminated.Nevertheless, it is unlikely that all users have identical perceptions of IT support. Evenwithin one organization, users are rarely homogeneous – they have different skills, use differentAcademy of Information and Management Sciences Journal, Volume 11, Number 1, 2008
2software and hardware, and may have different expectations of what computers should be able todo. Shaw, Partidge and Ang (2003) referred to these differences as the user’s technological frameof reference. They found that users reporting overall satisfaction with IT support were self-directedlearners, viewed the computer’s role as a “task completer” and typically used more complexapplications. On the other hand, dissatisfied users were not self-directed learners, viewed thecomputer’s role as a “task enhancer,” and usually worked with less complex applications.In the Shaw et al. (2003) study, IT personnel preferred to solve non-routine problems,displaying “little patience” with repetitive requests, and responding more readily to technical issuerequests. This would imply that IT personnel are more responsive to users who use more complexapplications and are more technologically sophisticated. Working with such users may providegreater professional job satisfaction for IT staff; however, it probably does not adequately addressthe overall needs of the organization.To address the gap between individual and organizational needs, a separate function of ITsupport could be created to provide continuous training for users. In most organizations the skillsand knowledge of users varies widely depending on the education, training and job function of theusers. Improving the technological competency of all users could reduce the need for routinerequests, allowing IT support personnel to focus on the more complex issues. This would improveend user satisfaction with IT support, job satisfaction for IT personnel, as well as benefit theorganization.HYPOTHESIS DEVELOPMENTA user’s technological frame of reference may be molded by a number of personal andenvironmental factors. Because of the technical nature of their education and the early use oftechnology in their professional careers, accountants may be more familiar with informationtechnology and more comfortable using a variety of software packages. In terms of functionalresponsibilities accountants utilize information technology to capture, record, and report financialinformation that is used by management and other stakeholders. Jiang et al. (2000) suggested thatend users employed in various functional areas of organizations may have different perceptions ofthe importance of, and performance of, certain information technology support. We postulate thatbecause of their education, training and functional responsibilities, accountants may have uniqueperceptions of the importance of certain IT services. Hypothesis H1 compares the importanceaccountant end users place on IT services with those of other end users. It is stated in the alternativeform below:H1:There is a difference in perceived importance of information technologyservices between accountant end users and other end users.Academy of Information and Management Sciences Journal, Volume 11, Number 1, 2008
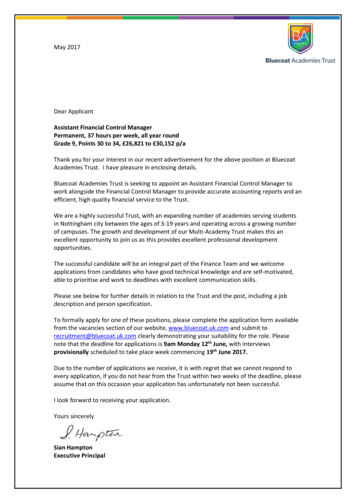
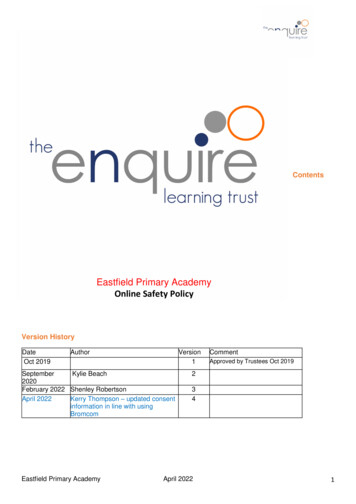
3In their development of a technological frame of reference, Shaw et al. (2003) found thatusers who expected less from the computer were more easily satisfied, and users with higherexpectations were more easily dissatisfied. It could be argued that a similar situation exists for userswho place low (high) importance on IT support: those who place low importance on IT supportwould be easier to satisfy, while users who place high importance would be less satisfied with ITsupport. This is depicted graphically in Figure 1.Figure 1. Proposed modelHighSatisfactionLowImportanceHighFollowing the results of Shaw et al. (2003), we expect that users who place high importanceon IT support will be less satisfied than users who place low importance on IT support. Based onour previous argument that accountants will have a different perception of importance of IT support,we anticipate their satisfaction level will be different than the non-accountant group. Stated in thealternative form, Hypothesis 2 tests this proposal as follows:H2:There is a difference in perceived satisfaction of information technologyservices between accountant end users and other end users.Survey InstrumentA questionnaire was used to measure two dimensions of IT support. Users were requestedto rate the importance of 18 items on a 5-point Likert-type scale, from not important (1) to veryimportant (5). The second portion of the survey contained identical items, but asked users howsatisfied they were with support they received. A similar 5-point scale was used, ranging from notsatisfied to very satisfied.Academy of Information and Management Sciences Journal, Volume 11, Number 1, 2008
4Comparing the importance and satisfaction on identical measurement items can help assesssatisfaction (Davis, Misra and Van Auken 2002, p. 219). For example:1.2.3.4.It has the potential to provide more insight than a one-dimensional satisfactionsurvey that simply asks users whether they are satisfied with IT support. If they aresatisfied with one aspect of IT support that is not very important to them, but notsatisfied with another aspect that is important, one might infer that users would beless satisfied with IT support, in general.It can be used for a baseline for continuous improvement for the IT function. Byidentifying initial gaps between importance and satisfaction, management can directresources to issues that warrant improvement.It allows for development of longitudinal trends in IT support. End users’requirements change with technological advances and organizational innovation. Byadministering the importance/satisfaction survey on a periodic (annual, bi-annual)basis, the organization can track the changes and alter IT support accordingly.Measuring two dimensions using the same questions provides a quantitative basis foranalysis, a scientific approach that can be validated.Measurement ItemsThe survey consisted of two sections: the first section contained questions designed tomeasure the importance of quality, interpersonal skills, dependability, teamwork or leadership, andresponsiveness. The second section asked users whether they were satisfied with IT support on thosesame items. Asking questions that measure different perceptions on identical issues allows analysisof a positive (negative) gap; if the difference is positive, the user’s satisfaction rating is greater thanhis or her importance rating. Conversely, if the difference is negative, the user is suggesting thatimportant IT issues are not being adequately addressed. For example, if users rated “follow through”as very important, but indicated they were only somewhat satisfied with IT’s performance, anegative gap would result. A complete list of the measurement items is provided in the Resultssection.RESEARCH METHODOLOGYTwo hundred twenty surveys were hand delivered to local business enterprises in thesouthern region of the U.S. The surveys were accompanied by a cover letter and a return envelope.The cover letter requested that management distribute the survey forms to accountant or nonaccountant end users and assured the respondents of the confidentiality of their answers. Nopersonal identifying information was requested on the questionnaire. The accountant end users wereemployed in a variety of accounting positions in the organizations. The non-accountant end usersAcademy of Information and Management Sciences Journal, Volume 11, Number 1, 2008
5were employed in positions such as personnel, marketing and management. Approximately twoweeks after initially distributing the surveys, phone calls were made to management to assure thatthe designated employees had completed the survey. One hundred ten accountant end users and 93other end users completed and returned the survey.A simple comparative ranking of the survey questions was performed by listing each group’smean score for all questions and rearranging one column (accountants) from 1 (highest mean) to 18(lowest mean). This ranking allows visual comparison of the groups of the most important ITsupport features. Although this is not a statistical test, it provides important information regardingdifferences (and similarities) between the two groups.Mean scores of Importance and of Satisfaction were created using these same 18 items. Ttests were used to compare the means between the groups to test Hypotheses 1 and 2. Item rankingsand results of hypothesis testing are discussed in the following section.RESULTSDemographics of the respondents are presented in Table 1. As shown, more women thanmen are represented in the accounting profession (male 48 or 44%, female 57 or 51%, notreported 5 or 5%), and more men are employed in the other-user category (male 56 or 60%,female 37 or 40%). The average of participants’ ages was 43 for accountants and 38 for the otherend users. The industry breakdown also is presented, indicating that most respondents wereemployed in manufacturing, with service and the public sector following closely.Table 1. Descriptive StatisticsGender:Accountant UsersOther %Service54Not reported55%--Public Sector45110100%93100%Retail & x6361Min2220Average4338Not reported72Total203The survey was modified from one developed and validated by Jiang, et al. (2000) tocompare satisfaction perceptions of end users and information systems personnel. To ensure dataAcademy of Information and Management Sciences Journal, Volume 11, Number 1, 2008
6from the current study remain appropriate for the model, we conducted a confirmatory factoranalysis and found that items from two of the constructs loaded on the same factor. It isunderstandable that “follow through” (dependability construct) is quite similar to “applypreventative/permanent solutions” or “stick with user’s problem until resolved” (responsivenessconstruct). The new factor was revised to include the measurement items from both constructs andwas renamed Dependability and Responsiveness.Tests for internal reliability and goodness-of-fit were also conducted. Internal reliability,which refers to the extent to which the survey instrument is free from measurement error, wasverified using Cronbach’s alpha. As presented in Table 2, Cronbach’s alpha values range from .70to .89, considered to be acceptable levels of internal reliability. Goodness-of-fit statistics includethe Goodness of Fit Index (GFI), Root Mean Squared Residual (RMR), Bentler’s Comparative FitIndex, and Bollen’s Non-normed Index. They are presented in Table 2, along with normallyaccepted values.Table 2. Construct Reliability and Goodness-of Fit IndicesConstructCronbach AlphaQuality0.70Interpersonal Skills0.81Dependability and Responsiveness0.89Teamwork and Leadership0.82Goodness of Fit IndicesCurrent StudyAcceptable ValuesGoodness of Fit Index (GFI)0.92 0.90Root Mean Square Residual (RMR)0.03 0.05Bentler's Comparative Fit Index0.95 0.90Bollen's Non-normed Index0.96 0.90n 203Simple item rankings by each group are presented in Table 3. The left column depictsaccountant users that have been ranked from 1 – 18. The right column shows the comparativerankings of the other end users. It is easy to see that, for the most part, the rankings were relativelyconsistent between the groups. For example, a timely response was ranked very important by bothgroups, #1 for accountants and #2 for other users. Only three questions were rated substantiallydifferent: “sticking with the problem” was ranked #1 by non-accountant users, although it onlyranked #8 for the accountants. It is possible that other users felt somewhat abandoned prior tosatisfactory resolution of their issues, while it was not so for the accountants. “Follow through” wasranked much higher for other users (#5) than accountants (#11). This seems related to “sticking withthe problem,” which was ranked higher by other users, so this result is not unexpected. Interestingly,Academy of Information and Management Sciences Journal, Volume 11, Number 1, 2008
7another difference is the importance for IT personnel to “understand and follow procedures andinstructions.” This was ranked #2 for accountants, but #8 for other users. Perhaps this is becausethe accounting function usually includes a series of steps or established procedures – accountantsmight expect IT personnel to work in a similar fashion.Table 3. Simple Rankings of Measurement ItemsItemAccountant UsersOther UsersRespond in timely fashion12Understand and follow applicable procedures and instructions28Implement changes without errors or rework33Make ideas understood44Make an effort to listen to and understand the users56Apply preventative or permanent solutions to problems67Stick with the problem until it is resolved71Meet commitments89Show respect; build cooperative relationships; facilitate dialog910Recommend ways to be more effective and efficient1011Follow through115Use tools and standards properly and consistently1212Anticipate user’s needs; giving high priority to user satisfaction1313Willingness/ability to accept new assignments1414Lead a team toward its stated objectives1515Coach, instruct, and/or support other IT personnel1616Contribute actively to project and non-project related efforts1718Keep users informed about technologies related to user’s job (hardware,software, books)1817Gap AnalysisGap analysis has been used in prior studies to compare the individual’s perception ofimportance of an activity with his or her satisfaction with the completion of that activity (c.f. Davis,et al. 2002). As described earlier, a positive gap exists when the satisfaction score exceeds the scorefor importance on the same measurement item. In the current study, only one construct resulted ina positive gap: the other user group rated satisfaction of teamwork and leadership higher thanimportance. Teamwork and leadership also had the lowest mean of any of the constructs. For bothAcademy of Information and Management Sciences Journal, Volume 11, Number 1, 2008
8groups, importance of all other constructs was ranked higher than satisfaction, resulting in negativegaps. Table 4 presents the importance and satisfaction scores, along with the gaps for each item.Table 4. Gap r Users:n 203Tests of hypothesesAn independent-samples t-test was used to determine whether there were reliable differencesof mean importance scores between the two groups. As presented in Table 5, the accountants placedgreater importance on the IT support features (Mean of 4.46, S.D. of .42) than the other end users(Mean of 4.23, S.D. of .49). The data support Hypothesis 1 at p 0.001.Table 5. Results of Hypothesis TestsAccountant UsersH1:Other UserspMeansS.D.MeansS.D.Importance4.460.424.230.49 0.001Satisfaction4.060.654.140.75n/sH2:n 203To assess the possible impact of these differences, the standardized effect size was calculatedby dividing the mean difference by the average standard deviations. In the current study, thestandardized effect size is .50, considered to be a medium effect according to Cohen’s (1988)guidelines (.2 for a small effect, .5 as medium, and .8 as large).3 A medium effect can be relativelyeasy to visualize when describing tangible evidence, such as an algae bloom in an otherwise crystalAcademy of Information and Management Sciences Journal, Volume 11, Number 1, 2008
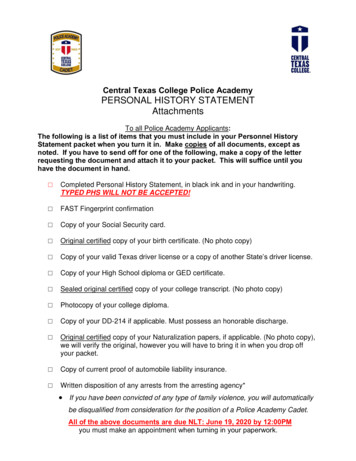
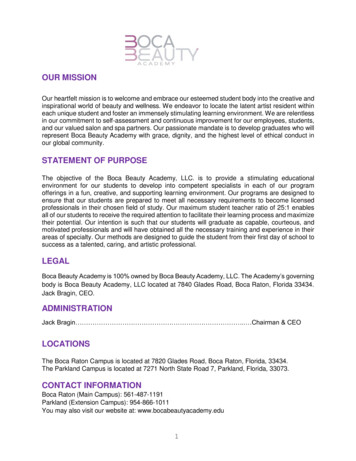
9clear mountain lake. It becomes more difficult when applied to differences in perceptions ofimportance of IT support. Nevertheless, that does not mean the effect is inconsequential ornonexistent. Such perceptual differences may have an overall impact on organizational resources.It was expected that users who placed higher importance on attributes of IT support would be lesssatisfied than those who seemed less concerned (by placing less importance on the measurementitems). Hypothesis 2 was tested using an independent-samples t-test. The results indicate thatalthough the accountant users were less satisfied, there was only a very small difference, which wasnot statistically significant, as shown in Table 5. This leads to the revised illustration shown inFigure 2, which suggests that regardless of the importance attributed to IT support, users werealmost equally satisfied.Figure 2. Revised modelHighSatisfactionLowImportanceHighDISCUSSIONAs predicted, the accountants’ perspective on the importance on information technologyservices was distinctly different from other end users. Our research included responses from a largecross section of business entities; therefore, organizational climate is not a factor in explaining thesedifferences. It is more likely explained by the psychological and subunit (departmental) climate inwhich accountants work (Glick 1985). Accountants begin their formal education using technologyto solve problems and assemble financial information. Upon graduation, they become professionalswho operate in an environment where technology is utilized extensively and they are likely to betechnologically proficient. As sophisticated end users, it is expected they would place greaterimportance on the delivery of information technology services.Nonetheless, it is unclear why they are not less satisfied than the other user group that didnot place as much importance on technology support. It is possible that accountants are more awareAcademy of Information and Management Sciences Journal, Volume 11, Number 1, 2008
10of the difficulties encountered in installing and supporting software. Increased experience makesone sensitive to the possibilities of software programming deficiencies, equipment incompatibilities,and other possible problems involved in getting an application to run properly. Because of theirexperience, accountants may have more realistic expectations as to the ability of IT personnel tosolve problems.In addition to the psychological climate that accountants bring to the work place, personalitytraits may also play a role in explaining the differences between accountants and non-accountants.Day and Silverman (1989) found significant correlations between some personality traits ofaccountants and certain job performance dimensions. Using a well-established personality test, thestudy found that work orientation, degree of ascendancy, and degree and quality of interpersonalorientation were significantly correlated with the job performance dimensions of 1) potential forsuccess, 2) technical ability, 3) client relations, and 4) cooperation with other personnel.4 Althoughcognitive ability explains much of the reasoning in how individuals select a career in accounting,personality traits appear to be a key factor as well.It is important to examine how the differences between the two groups potentially impactthe organization. There is much research indicating that user involvement in information systemsdesign improves user satisfaction with the system (c.f., Hunton and Beeler 1997; Baroudi, Olson,Ives and Blake 1986, and others). This same principle should apply to information technologysupport. When users and systems personnel work together during installation and support of newsoftware it would seem likely that they would have a greater understanding of the benefits of thesoftware and the deficiencies that must be overcome. Satisfaction with performance should improvewhen perceptions of importance are more closely aligned between IT personnel and end users.Technology skill levels among end users in most organizations are uneven, at best. To alarge extent, the end user’s technological frame of reference influences the perception of the valueof IT support services and how they can best be utilized. End users who have minimal technologicalexperience are likely to expect IT support to solve all problems and make the system work.Experienced end users will be more realistic as to the ability of IT personnel to solve problems andwill be better prepared to maximize available support services.This research supports the notion of equalizing users’ techno
DeVry University Linus Osuagwu Federal University of Technology Owerri Nigeria Johnny C. Ho Columbus State University Allam Appa Rao Andhra University College of Engineering Richard C. Hicks Florida Atlantic Univesity Lee Revere University of Houston Clear Lake I-Lin Huang Langston University Gary P. Schneider Quinnipiac University Adam S. Huarng