Transcription
CONS UMER FINANCIAL P ROTECTION BUREAU MAY 2021Consumer use of payday,auto title, and pawn loansInsights from the Making Ends MeetSurveyCFPB Office of ResearchResearch Brief No. 2021-1Scott Fulford and Cortnie Shupe prepared this report
IntroductionPayday loans, auto title loans, and pawn loans are often called alternative financial services(AFS) because the typical lender is not a bank. These loans are typically for relatively lowamounts—typically less than 1,000—high interest rates, and short durations—typically amonth or less. While the exact terms and structure of these loans can differ from lender tolender, payday loans are typically given in advance of a consumer’s payday for a fee; auto titleloans use the title to the consumer’s auto or other vehicle as collateral; and pawn loans typicallyuse some valuable item, like a computer or jewelry, as collateral.The “mosaic” of existing research on these products is still incomplete, leaving manyunanswered questions. 1 In this research brief, we examine the prevalence, persistence of use,and alternate credit sources available for consumers who use payday, auto title, and pawn loans.We use the first two waves of the Bureau’s Making Ends Meet survey, conducted in June 2019and June 2020, to examine how consumers use these services over time. The survey isassociated with traditional credit bureau data, allowing us to examine other creditcharacteristics such as whether these consumers appear to have readily available credit on creditcards. The Making Ends Meet survey thus gives us a rare opportunity to combine a survey of thesame consumers over two years with credit record data to understand consumers’ decisionsabout debt.In June 2019, 4.4 percent of consumers had taken out a payday loan in the previous six months,2.0 percent had taken out an auto title loan, and 2.5 percent had taken out a pawn loan. Becausethe number of consumers using these loans in the survey is small, there is some surveyuncertainty in these estimates, but the estimates are similar to other sources. 2 The share ofconsumers who had used these services in the 12 months before June 2020 was similar, but theincreased length of time considered and the start of the pandemic means the results are notcompletely comparable across waves.The survey results show that consumers frequently roll over these loans or take out a new loansoon after re-paying the previous loan. In June 2019, of the consumers who had taken out a loanin the previous six months, 63 percent still owed money on a payday loan; 83 percent still owedmoney on an auto title loan; and 73 percent still owed money on pawn loans. Repeatedly rollingover or revolving loans is not unique for these kinds of loans. For the 79 percent of consumers1J. Brandon Bolen, Gregory Elliehausen, and Thomas W. Miller Jr. “Do Consumers Need More Protection fromSmall-Dollar Lenders? Historical Evidence and a Roadmap for Future Research,” 2020, Economic Inquiry 58: 15771613. Available: https://doi.org/10.1111/ecin.12894.2We compare these results to the FDIC Survey of Household Use of Bank ing and Financial Services below.2CONSUMER USE OF PAYDAY, AUTO TITLE, AND PAWN LOANS
with a credit card in the survey, for example, 51 percent did not pay the full bill in the previousmonth in June 2019.Use of alternative financial services appears to have fallen early in the pandemic. In June 2020,the share of consumers who still owed money on a payday loan fell to 48 percent (from 63percent), the share for auto title loans was mostly unchanged, and the share for pawn loans fellto 34 percent (from 73 percent). The longer time period covered in June 2020 may also haveallowed consumers who took loans out more than six months ago longer to repay. These changesduring the pandemic are consistent with other reporting suggesting that many consumers paidcredit card debt, pawns loans, payday loans, and other debts during the pandemic as consumerspending fell while average incomes rose because of government transfers. 3For each of these loan types, use tends to be persistent from year to year. Comparing across thetwo waves, 52 percent of consumers who had taken out a payday loan in the six months beforeJune 2019 had also taken out a payday loan in the 12 months before June 2020. Thecorresponding numbers are 32 percent for auto title loans and 56 percent for pawn loans. Forcomparison, 81 percent of consumers who were revolving credit card debt in June 2019 werealso revolving in June 2020.Consumers using alternative financial services frequently have difficulty paying a bill or expenseand are more likely to have experienced a negative financial shock. In the survey, 77 percent ofconsumers using alternative financial services experienced a shock and had difficulty paying abill or expense during the same timeframe in which they also reported borrowing a payday, autotitle, or pawn loan. For consumers who had difficulty paying a bill or expense, the average costof that difficulty tended to exceed the amount of liquidity available immediately to them fromsavings and credit cards.Many consumers who experienced difficulty paying a bill or expense use AFS as part of theiroverall strategy for dealing with the difficulty. Among consumers who experienced difficultypaying a bill or expense, 50 percent borrowed money either using formal or informal credit and,33Consumers largely used their economic impact payments for saving or paying down debt. See: Olivier Coibion, YuriyGorodnichenko, and Michael Weber, “How Did U.S. Consumers Use Their Stimulus Payments?” August 2020,NBER Work ing Paper No. 27693. Available: https://www.nber.org/papers/w27693. On trends in saving andspending and government transfers, see: Josh Mitchell, “U.S. Household Income, Savings Rose at End of Last Year,”January 29, 2021, The Wall Street Journal. Available: sonalincome-coronavirus-december-2020-11611873351. On credit card debt, see: Ryan Sandler and Judith Ricks, “TheEarly Effects of the COVID-19 Pandemic on Consumer Credit,” August 2020. ments/cfpb early-effects-covid-19-consumer-credit issue-brief.pdf. Onpawn loans, see: Emily Stuart, “It’s easy to assume pawnshops are doing great in the pandemic. It’s also wrong. It’snot just about the guns and gold: Loans are at the core of the pawn business,” Vox, November 30, 2020. awn-shop-covid-19-economy. On payday loans, see: Veritec Solution“Update: COVID-19 Impact Study on Small-Dollar Lending,” October 22, 2020. -impact-study-on-small-dollar-lending/CONSUMER USE OF PAYDAY, AUTO TITLE, AND PAWN LOANS
of those who borrowed, 21 percent turned to an AFS in order to pay for the expense. Using theMaking Ends Meet survey, we find that for AFS users, speed, discretion, and the lack of a creditcheck were important for deciding on their credit source.Many AFS users appear to have few other credit options while others have significant alternativesources of credit. A majority of AFS users have poor or very poor credit scores and are oftenturned down for mainstream credit or not granted the full requested amount. Yet a significantportion of consumers using these services had 300 or more in available credit card credit atabout the same time they owed money on one of these loans. Using the association with thecredit bureau data, we find 28 percent of consumers who owed money on a payday loan whenthey took the survey had at least 300 in available credit card credit at the end of June 2019. Forauto title borrowers, 33 percent had 300 in available credit, while 16 percent of pawnborrowers had 300 in available credit. Other research has reached similar conclusions. 4This finding presents a significant puzzle. The interest rate for credit cards is typically muchlower than for AFS. 5 Why do so many consumers not use their credit card for liquidity instead ofthese high-cost loans?We explore two possibilities. First, we show that AFS users describe themselves as less likely toshop for the best terms. Perhaps consumers who shop less for the best terms find theconvenience of an AFS more compelling or are less likely to be aware of the cost differential. Yetin the very small sample, the AFS users who have available credit card credit are more likely tosay they search for the best terms, compared to AFS users without available credit card credit,offering suggestive evidence that shopping among these borrowers is not the explanation.Second, we examine income and expenditure shocks that trigger difficulties for consumers topay bills and expenses. These shocks tend to be larger than other available credit or savingssources. AFS users who experience difficulty paying a bill or expense tend to also use otheravailable credit, suggesting that for some consumers AFS might be part of a broader and more4Sumit Agarwal, Paige Marta Sk iba and Jeremy Tobacman, "Payday Loans and Credit Cards: New Liquidity andCredit Scoring Puzzles?" 2009, American Economic Review, 99(2):412-17.5The average APR on revolving credit cards assessed interest was 16.04 percent in 2019 according to the G.19 FederalReserve Statistical Release (February 2021). Available: t/.Meanwhile, the average payday rate is much higher. AFS users typically have lower credit scores (see Figure 10), sowould typically be charged a higher rate. The average “effective interest rate” for subprime and deep subprimeborrowers was approximately 21 percent in 2018. See: Consumer Financial Protection Bureau, “The ConsumerCredit Card Mark et,” August 2019, p. 55. ments/cfpb consumer-credit-card-market-report 2019.pdf. Meanwhile,a fee of 15 for every 100 dollars borrowed for a two-week loan caries an APR equivalent of nearly 400 percent.See: SUMER USE OF PAYDAY, AUTO TITLE, AND PAWN LOANS
complicated debt portfolio to deal with difficulties. Understanding the tradeoffs among differentways of dealing with financial difficulties is an important direction for future research.The Making Ends Meet SurveyWe use the first two waves of the Making Ends Meet survey. The survey results provide a deeperunderstanding of how often U.S. consumers have difficulty making ends meet, how they copewith these shortfalls, and the consequences of the shortfalls. The Bureau conducted Wave 1 ofthe survey starting in May 2019 and Wave 2 starting in May 2020. Most respondents tookseveral weeks to respond, so typical responses occurred in June in each year. We refer to June asthe month the surveys occurred in this brief.The Wave 2 sample consisted of all respondents, including partial respondents to Wave 1.Repeated surveying of the same consumers allows us to examine how the same individuals’economic circumstances changed and how they react to those changes. Ultimately, 2,990consumers responded to Wave 1 either on paper or online. Of those, 1,834—or about 61percent—responded to at least the first questions in Wave 2.The survey sample is drawn from the Bureau’s Consumer Credit Panel (CCP), a comprehensive,national, 1-in-48 sample of credit records maintained by one of the three nationwide consumerreporting agencies. 6 The Wave 1 survey oversampled consumers with lower credit scores, withrecent credit delinquencies, and those living in rural areas to help give enough representation toallow analyses among these smaller groups. Using the CCP strengthens the survey by allowingthis kind of oversampling.The Making Ends Meet sample frame will generally not capture AFS users who do not appear intraditional credit bureau data. Therefore, one limitation of the study is that while it is generallyrepresentative of individuals with a record at a nationwide consumer reporting agency theseconsumers may differ from individuals without such a credit record in important ways. In theFDIC survey, for example, pawn use was more common among unbanked households. 7 On theother hand, because the Making Ends Meet survey oversamples among consumers with6The CCP excludes any information that might reveal consumers’ identities, such as names, addresses, and SocialSecurity numbers. For more information on the privacy protections associated with this survey, see the ConsumerExperience Research Privacy Impact gov/f/201406 cfpb consumer-experience-research pia.pdf and System ofRecords Notice CFPB.022, Mark et and Consumer Research Records. -records-2/.7Federal Deposit Insurance Corporation, “How America Bank s: Household Use of Bank ing and Financial Services:2019 FDIC Survey,” October 2020, at 48. 2019 FDIC Unbank ed HH Survey Report.pdf.5CONSUMER USE OF PAYDAY, AUTO TITLE, AND PAWN LOANS
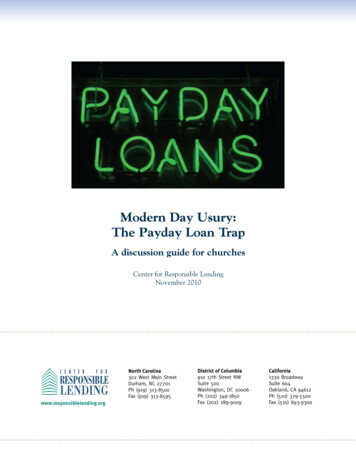
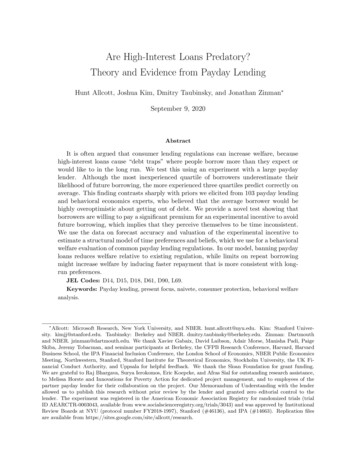
delinquencies and low credit scores, it may have more precise estimates for these consumersthan surveys without the ability to oversample effectively. For simplicity, we refer to consumersin this study with this caveat in mind.All the results in this report use survey weights to align with the CCP. We use two different setsof weights, depending on the analysis. For analysis only from Wave 1, we use Wave 1 weights.These weights adjust for non-response to the survey using characteristics observable in the CCPfor both responders and non-responders. 8When we examine both Wave 1 and Wave 2 and transitions between them, we use Wave 2weights. These weights adjust for the additional attrition between waves. Because the surveysample is drawn from the CCP, we can observe changes in the financial status of bothrespondents and non-respondents and use those changes in developing weights that adjust forattrition between Wave 1 and Wave 2. The ability to adjust for attrition between Wave 1 andWave 2, using not just Wave 1 variables, but also observable changes in the CCP between Wave 1and Wave 2, is another key advantage of the survey and makes the survey results generallyreflect the range of consumers’ experiences since Wave 1. 9Share using Alternative Financial ServicesIn Figure 1, 4.4 percent of consumers had taken out a payday loan in the six months prior toJune 2019, 2.0 percent had taken out an auto title loan, and 2.5 percent had taken out a pawnloan. To help respondents determine whether they had used the service, the survey included ashort definition with the question. The survey defined a payday loan as “a loan that you mustrepay, make a payment on, or rollover on your next payday.” This definition might includesingle-payment payday loans and newer payday installment loans that are payable over time,although depending on the marketing a respondent might not consider these loans to be“payday loans.” These installment loans have become more common. 108 See the initialMaking Ends Meet report for a more detailed discussion of Wave 1 weights: Scott Fulford and MarieRush, “Insights from the Mak ing Ends Meet Survey,” July 13, 2020, CFPB Office of Research, Research Brief No2020-1. Available: b making-ends-meet surveyresults 2020-07.pdf.9See the report on Wave 2 for a more detailed discussion of Wave 2 weights: Scott Fulford, Marie Rush, and EricWilson, “Changes in consumer financial status during the early months of the pandemic,” April 30, 2021, CFPBOffice of Research, Data Point No 2021-2. Available: https://files.consumerfinance.gov/f/documents/cfpb makingends-meet survey-results 2020-07.pdf10Caroline Malone and Paige Marta Sk iba, “Installment Loans,” December 2, 2019, Vanderbilt Law Research PaperNo. 20-04, Available: https://ssrn.com/abstract 3497095 or http://dx.doi.org/10.2139/ssrn.3497095.6CONSUMER USE OF PAYDAY, AUTO TITLE, AND PAWN LOANS
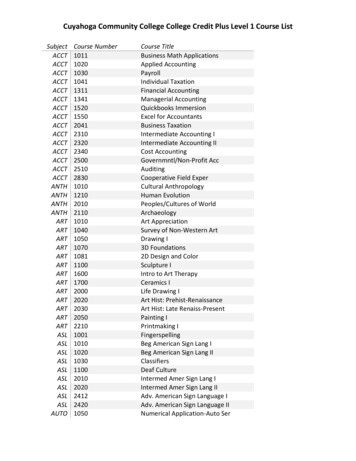
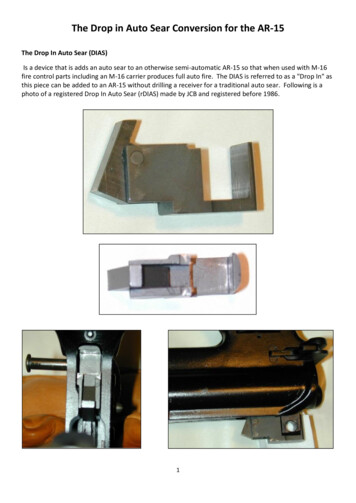
FIGURE 1: PERCENT OF CONSUMERS THAT HAD TAKEN OUT THIS TYPE OF LOAN IN SIX MONTHS PRIORTO JUNE 2019Payday4.4Auto title2.0Pawn2.50.00.51.01.52.02.53.03.54.0Have taken out a loan in previous 6 months (percent)4.55.0These shares are broadly similar in magnitude to the shares found in other studies. Respondentsto the 2019 FDIC Survey of Household Use of Banking and Financial Services were askedwhether they had used payday, auto title or pawn loans in the previous 12 months. 11 For allhouseholds in the FDIC survey, 1.3 percent used payday, 0.9 percent used auto title, and 1.3percent pawn loans. Because relatively few people use payday, auto title, or pawn loans, theestimates in both Making Ends Meet and the FDIC survey are subject to some surveyuncertainty. The 95 percent confidence intervals for estimates of these services in Making EndsMeet include approximately two percentage points on either side, so the FDIC estimates, thoughconsistently lower, are typically within the 95 percent confidence interval. One reason for thedifference in estimates for payday loans specifically may also be that the Making Ends Meetsurvey defines these loans, while the FDIC survey does not, so more Making Ends Meetrespondents may consider their loan as a payday loan. 12Figure 2 shows the percent of the population who had taken out a payday, auto title, or pawnloan in the 12 months prior to June 2020. Because the second wave came approximately 12months after the first wave, we asked about using these services during the prior year, not theprevious six months as in Wave 1. The questions are thus not fully comparable between waves.11Federal Deposit Insurance Corporation, “How America Bank s: Household Use of Bank ing and Financial Services:2019 FDIC Survey,” October 2020. 2019 FDIC Unbank ed HH Survey Report.pdf.127See the FDIC survey instrument. Available: ment 2019.pdf.CONSUMER USE OF PAYDAY, AUTO TITLE, AND PAWN LOANS
Figure 2 shows that, while the recall period doubled, the share using these products increasedsomewhat less.FIGURE 2: PERCENT OF POPULATION THAT HAS TAKEN OUT THIS TYPE OF LOAN IN 12 MONTHS PRIORTO JUNE 2020Payday5.7Auto title2.9Pawn2.50.01.02.03.04.05.0Have taken out a loan in previous 12 months (percent)6.0Who uses Alternative Financial Services?Using the first wave of the survey, Table 1 depicts the characteristics of consumers who haveused at least one form of AFS in the six months preceding June 2019. Approximately eightpercent of consumers used one of these products. Comparing characteristics of consumers whoused AFS and those who did not reveals some key differences. AFS users are more concentratedamong the age group between 40-61, consumers with at most a high school degree, Black andHispanic consumers, low-income consumers, and women. However, as depicted in Table 1below, AFS users can be found across a diverse spectrum of characteristics in the population andare not limited to these consumer groups. We do not observe substantial changes incharacteristics during the second wave of the survey in June 2020, despite this period coveringseveral months of the coronavirus pandemic.8CONSUMER USE OF PAYDAY, AUTO TITLE, AND PAWN LOANS
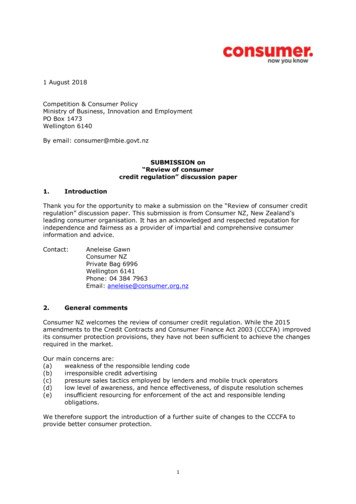
TABLE 1:DEMOGRAPHIC CHARACTERISTICS OF AFS AND NON-AFS USERS IN JUNE 2019, PERCENTOF POPULATION IN EACH GROUP.GroupAge groupAge 40Age 40-61Age 62Children in householdYes, children in householdEducation groupAt most HS degreeTechnical or 2-year degreeAt least 4-year degreeRace and ethnicityWhiteBlackHispanicGenderMaleHousehold income 15,000 or less 15,001 to 20,000 20,001 to 40,000 40,001 to 70,000 70,001 to 100,000More than 100,000RuralYes, in a rural areaOverall weighted share ofsampleObservationsNon-AFS users323831394416416912115097182519234AFS Rollover and repeat borrowingFor the consumers who use these services, borrowing repeatedly or rolling over is very common.While the terms vary, payday, auto title, and pawn loans are typically for 30 days or fewer. Giventhe short-term nature of these loans, if a consumer took out a loan in the previous six monthsand still owes money on that type of loan, the consumer is likely to have rolled over the loan ortaken out a new loan. Figure 3 shows that, among consumers who had taken out a payday loanin the previous six months to June 2019, 63 percent still owed money on a payday loan at thetime of the survey; for auto title loans, 83 percent still owed money; and pawnshop loans 73percent still owed money. Some forms of auto title and pawn loans can be longer than 30 days9CONSUMER USE OF PAYDAY, AUTO TITLE, AND PAWN LOANS
which may explain why many consumers still owe money on a loan taken out within the last sixmonths.FIGURE 3: PERCENT OF POPULATION THAT STILL OWED MONEY ON THIS TYPE OF LOAN, IF HAD TAKENONE OUT IN SIX MONTHS PRIOR TO JUNE 2019Payday62.9Auto title83.4Pawn72.7Credit card50.9010203040506070Still owe money on this type of loan (percent)8090For payday loans, respondents were asked directly about rolling over loans. In the survey, 48percent of consumers who had taken out a payday loan in the previous six months had rolledover at least one payday loan in the previous six months.For comparison, consumers roll over other types of loans frequently as well: 51 percent ofconsumers with a credit card did not pay the full bill in the previous month in June 2019. In thesurvey, 79 percent of consumers had a credit card.Previous research has also found that rolling over payday loans or borrowing a new loan withina short period of time is very common. For example, a 2014 Bureau study of all payday loansextended by several lenders over a period of at least 12 months found that 80 percent of paydayloans are rolled over or followed by another loan within 14 days. 13 Making Ends Meet is a surveyof consumers not a data set of accounts, so it offers a slightly different perspective. This differentperspective makes it difficult to compare whether rollover patterns have changed compared toaccount-level studies. For example, some consumers may not consider taking out a new loansoon after paying back an old loan a “rollover” and the survey did not define the term for13Kathleen Burk e, Jonathan Lanning, Jesse Leary, Jialan Wang, “Payday Lending,” March 2014, The CFPB Office ofResearch, Data Point. Available: https://files.consumerfinance.gov/f/201403 cfpb report payday-lending.pdf.10CONSUMER USE OF PAYDAY, AUTO TITLE, AND PAWN LOANS
respondents. Other recent work surveying consumers when they took out a payday loan findsthat 74 percent borrowed again within eight weeks. 14Because of the disruptions of the pandemic, the use of these services may have changed. Forexample, while unemployment increased, the CARES Act provided substantial increases inunemployment benefits and one-time Economic Impact Payments. Together with reductions inspending, these transfers contributed to improvements in average consumer financial statusduring the first several months of the pandemic 15 and to a fall in credit card debt, 16 even for themost financially vulnerable consumers. 17 Reports from interviews with pawn shop owners andoperators suggest that many patrons used their newfound liquidity to redeem longstandingloans. 18Figure 4 suggests that AFS use changed during the initial months of the pandemic. Figure 4shows that consumers were much less likely to still owe money on payday and pawn loans,conditional on having taken one out in the previous 12 months. The fall in pawn loans wasparticularly dramatic, more than halving from 73 to 34 percent. However, the change in therecall period from six to twelve months may be responsible for some of this change. A consumerwho took out a loan more than six months ago may be less likely to still owe money on that typeof loan. Meanwhile, more than 80 percent of consumers who had taken out an auto title loanstill owed money and 51 percent of consumers were revolving credit card debt, the samepercentage as in June 2019.14Hunt Allcott, Joshua Kim, Dmitry Taubinsky, and Jonathan Zinman, “Are High-Interest Loans Predatory? Theoryand Evidence from Payday Lending” February 2021, work ing paper. Available: ist/6/1996/files/2021/02/Payday.pdf15Scott Fulford, Marie Rush and Eric Wilson, “Changes in consumer financial status during the early months of thepandemic,” April 2021.1617Sandler and Rick s, “The Early Effects of the COVID-19 Pandemic on Consumer Credit.”Scott Fulford and Marie Rush, “Credit card debt fell even for consumers who were having financial difficultiesbefore the pandemic”, December 17, 2020. Available: ifficulties-before-pandemic/18 Emily Stuart, “It’s easy to assume pawnshops are doing great in the pandemic. It’s also wrong. It’s not just aboutthe guns and gold: Loans are at the core of the pawn business,” Vox, November 30, 2020. awn-shop-covid-19-economy.11CONSUMER USE OF PAYDAY, AUTO TITLE, AND PAWN LOANS
FIGURE 4: PERCENT OF POPULATION THAT STILL OWED MONEY ON THIS TYPE OF LOAN, IF HAVE TAKENONE OUT IN 12 MONTHS PRIOR TO JUNE 2020 (PERCENT)Payday47.9Auto title89.7Pawn34.1Credit card50.901020304050607080Still owe money on this type of loan (percent)90100Persistence of useThe previous section showed a snapshot of use in the two waves. This section examines thetransitions into and out of using these products for the same consumers across the two waves.Figure 5 shows the transitions into and out of using payday from the two waves of the survey.The upper bar shows that 52 percent of consumers who took out a payday loan in the six monthspreceding June 2019 had borrowed at least one payday loan between June 2019 and June 2020.Payday use is thus quite persistent. The bottom bar is for consumers who did not take out apayday loan in the six months before June 2019. Of these consumers, only 3.5 percent newlytook out a payday loan between June 2019 and June 2020.12CONSUMER USE OF PAYDAY, AUTO TITLE, AND PAWN LOANS
FIGURE 5: TRANSITION INTO AND OUT OF PAYDAY USE FROM JUNE 2019 TO JUNE 2020 (PERCENT)Took out apayday loanin six monthsbeforeJune 60Took out a payday loan from June 2019 to June 2020 (percent)?80Yes100NoFigure 6 shows a similar transition for auto title use, which is also persistent. In June 2020, 32.1percent of the consumers who had taken out an auto title loan in the six months before June2019 had also taken out an auto title loan in the 12 months before June 2020. Only 2.2 percentof consumers who were not using auto title loans in the six months to June 2019 were newlyusing auto title loans between June 2019 and June 2020.FIGURE 6: TRANSITION INTO AND OUT OF AUTO TITLE LOAN USE FROM JUNE 2019 TO JUNE 2020(PERCENT)Took out anauto title loanin six monthsbeforeJune 60Took out an auto-title loan from June 2019 to June 2020 (percent)?80Yes100NoFigure 7 shows the transition for pawn loan use. In June 2020, 56 percent of the consumers whohad taken out a pawn loan in the six months before June 2019 had also taken out a pawn loan inthe 12 months before June 2020. Only 0.7 percent of consumers who were not using pawn loans13CONSUMER USE OF PAYDAY, AUTO TITLE, AND PAWN LOANS
in the six months before June 2019 were newly using pawn loans between June 2019 and June2020.FIGURE 7: TRANSITION INTO AND OUT OF PAWN LOAN USE FROM JUNE 2019 TO JUNE 2020 (PERCENT)Took out apawn loanin six monthsbeforeJune 6080100YesTook out an pawn loan from June 2019 to June 2020 (percent)?NoFor comparison, Figure 8 shows the transition into and out of revolving credit card debt. InJune 2020, 81 percent of consumers who were revolving credit card debt in June 2019 were stillrevolving. Meanwhile, 21 percent of consumers who were not revolving in June 2019 had startedby June 2020.FIGURE 8: TRANSITION INTO AND OUT OF REVOLVING CREDIT CARD USE FROM JUNE 2019 TO JUNE 2020(PERCENT)Revolvingcredit carddebt inJune ing credit card debt in June 2020 (percent)?14CONSUMER USE OF PAYDAY, AUTO TITLE, AND PAWN LOANS80100YesNo
Is lower-cost credit available?The connection to the CCP allows us to examine whether the users of these services also usemore traditional forms of credit and whether they have other available credit. Figure 9 displaysthe percent of AFS users in June 2019 who also have other types of credit, compared to thepercent among AFS non-users. Compared to consumers who do not use any type of AFS, AFSusers are much less likely to have a mortgage or home equity product. While the share of AFSusers with a credit card is lower than non-AFS users, 63 percent do have an active credit card.FIGURE 9: FORMAL CREDIT USE AMONG CONSUMERS WHO USE AND DO NOT USE AFS (JUNE 2019)Poor credit may hinder some AFS users from accessing formal credit products with morefavorable terms. The survey’s association with credit bureau data allows us to observerespondent’s credit score in addition to other traditional credit usage. Figure 10 shows thedistribution of Vantage credit scores by broad credit score category for consumers with andwithout AFS use. 19 Over 60 percent of AFS users have credit scores that are either poor or verypoor. Still, 24 percent have scores considered good or excellent which might allow them toaccess other sources of credit.19We use standard scoring categories of: Excellent 781-850, Good 661-780, Fair 601-660, Poor 500-600, and VeryPoor 300-499. See: Louis DeNicola, “What is a Good Credit Score,” February 11, 2021, Exp
Payday loans, auto title loans, and pawn loans are often called alternative financial services (AFS) because the typical lender is not a ban k. These loans are typically for relatively low amounts—typically less than 1 ,000—high interest rates , and short durations—typically a month or less. .