Transcription
IOSR Journal of Mathematics (IOSR-JM)e-ISSN: 2278-5728, p-ISSN: 2319-765X. Volume 15, Issue 2 Ser. I (Mar – Apr 2019), PP 28-32www.iosrjournals.orgComparative Study of Pearson’s Chi-Square and Some OrdinalContingency Tables ModelsBushirat T. BolarinwaDepartment of Statistics Federal Polytechnic, P.M.B. 55, Bida, NigeriaCorresponding Author: Bushirat T. BolarinwaAbstract: The aim of this article was to compare Pearson’s Chi-square to Uniform (U), Column (C), Row (R),and R C ordinal contingency tables models. Data on gender, university attended for B.Sc., B.Sc. and M.Sc.grades of 116 M.Sc. graduates were collected from Department of Statistics, University of Ilorin, Nigeria.Model estimation was carried out by maximum likelihood method and goodness of fit was assessed by likelihoodratio statistic. Pearson’s chi-square rejected the null hypothesis of independence in all cases; the U modelrejected in 2 of 6 cases while R rejected in 4 cases. The C model rejected in 3 cases while R C rejected in 5 outof 6 cases. Pearson’s chi-square reached same conclusion with U model on 2 occasions, with C model on 3occasions, with R on 4 and with R C on 5 occasions. It reached same conclusion with U model on the onlyoccasion the assumption of U was satisfied and reached same conclusion with R model on 3 out 5 occasions inwhich the assumption of the latter was satisfied. However, it reached a contrary conclusion with C and R Cmodels on the only occasion the assumptions of C and R C models were met. While the four ordinal associationmodels reached same conclusion of independence as did the Pearson’s chi-square on the only occasion theassumption of the latter was met, Pearson’s chi-square reached same conclusion only on 4 out of the 8occasions on which the assumptions of ordinal association models were met, suggesting higher robustness ofordinal association models. It was found that Pearson’s chi-square agreed mostly with R C, followed by R,then C and lastly, U model when each ordinal model underlying assumption was not taken into cognizanceHowever, when taken into consideration, it agreed mostly with R and then, U model. The need to conduct largerscale study was recommended.Keywords: Contingency table, Chi-square, Row model, Colum model, Likelihood ------------------------------ ---------Date of Submission: 11-03-2019Date of acceptance: ----------------------------------- ----------I. IntroductionOccasions often arise when one is interested in studying association in contingency tables involvingtwo variables. That is, when interest lies in studying association between row and column variables. Thepractice has always been to use Pearson’s chi-square statistic due to Pearson (1900). A shortcoming of thestatistic is that it does not take into consideration the fact that either of the two variables involved may beordinal, it simply takes variables as nominal. This led to the development of models that recognize ordering.Such models termed ordinal contingency tables models include Uniform (U), Row (R), Column (C), R C, andRC association models. Each of these models is applicable under different circumstances. The Uniformassociation model relies on method of integer scoring that assumes that distance between any two adjacentcategories is uniform across all values, hence, the name of the model. Integer scoring is imposed on both rowand column variables. For the R association model, integer scoring is imposed on the column variable onlywhile for the C association model it is imposed on the row variable only.The R C association model, also referred to as Model I by Goodman (1979) requires that the rows andthe columns variables be correctly ordered, hence, the name. It is therefore, very suitable when we have doublyordered categories with integer spacings of the categories known. Occasions arise when the row and columnscores are unknown, this rules out the possibility of using any of R, C and R C models; a model tagged RCAssociation model, proposed by Goodman (1979) becomes readily applicable. It is sometimes referred to asmodel II in comparison to the R C model.A lot of researches have been conducted on association models. Pecker and Clogg (1989) reviewed thegeneral RC model, RC (M) and proposed alternative weighting systems for identifying interaction parameters.Gokhale and Klein (1995) proposed a way of assigning scores to category level based on the marginal frequencytotals of the variable.Takare (1987) proposed a method for handling contingency table based on ideal point discriminantanalysis as an alternative to loglinear modeling and correspondence analysis. Ritov and Gilula (1991) derivedorder restricted maximum likelihood estimators for parametric scores assigned variable levels in RC model.DOI: 10.9790/5728-1502012832www.iosrjournals.org28 Page
Comparative Study Of Pearson’s Chi-Square And Some Ordinal Contingency Tables ModelsEshima, Tubata, and Tsujitani (2001) derived property of the RC (M) model and a summary measure ofassociation in contingency table. Aktas and Saracbasi (2003) compared uniform association and quassiindependence models.Altunay and Saracbasi (2009) proposed symmetric disagreement plus uniform association model aimedat separating the association from the disagreement. Krampe, Kateri and Kuhnt (2011) proposed algebraicapproach to modeling asymmetric models. Camminatielo, D’Ambra and Sarnacchiaro (2014) proposed ageneral framework for the analysis of the complete set of log-odds ratios generated by two-way contingencytable.The aim of this research is to compare inferences drawn from Pearson’s chi-square to those of U, R, Cand R C association models using academic performance data. The article is organized as follows: Section 2presents the Theoretical Framework; Section 3 presents the Methodology; Section 4 presents the Results andDiscussion while the last section concludes the article.II. Theoretical FrameworkDiscussion on uniform association model can be motivated from the linear-by-linear association model.For two-way tables with ordinal variables, X and Y, let us assign scores xi and yj to row and column categoriesrespectively.The linear-by-linear association model isln( mˆ ij ) iX Yj xi y j(1)When 0, the independence model results. The parameter specifies the direction and strength ofassociation; when 0, the tendency is that as X increases, Y also increases and when 0, the tendency isˆ ij ) from independence is linearfor Y to decrease as X decreases. The term xi y j being the deviation of ln( min the Y scores at fixed X and linear in the X scores at fixed Y; the model obtains its name from this linearproperty (Agresti, 2007). The uniform association model is a special case of the linear-by-linear model in whichinteger scoring is used.The row association model is a consequence of relaxation of restrictions of the uniform association model.When the integer scoring is imposed on the columns variable, the resulting model is termed row associationmodel. With one restriction removed from equation 1, the resulting row association model is of the formln( mˆ ij ) iX Yj i (v j v )wherev v jjJand iX Yj i 0(2)(3) i 0 for all i, model reduces to that of independence. Parameter i is the deviation within a particularˆ ij ) from row independence of a known function of the ordinal variable with slope, i (Lawal,row of ln( mWhen2003).The column association model is also a consequence of relaxation of restrictions of the uniform model. Unlikethe row association model which requires correct integer ordering of the column variables, the columnassociation model requires correct integer ordering of the row variables. Still leaning on Equation 1, the form ofthe column association model isln( mˆ ij ) iX Yj j (ui u )whereu uiiIand iX Yj j 0Equation 4 reduces to that of independence whendeviation within a particular column ofvariable with slope j(4)(5) j 0 for all j. The column association Parameter j is theˆ ij ) from column independence of a known function of the ordinalln( m(Lawal, 2003).DOI: 10.9790/5728-1502012832www.iosrjournals.org29 Page
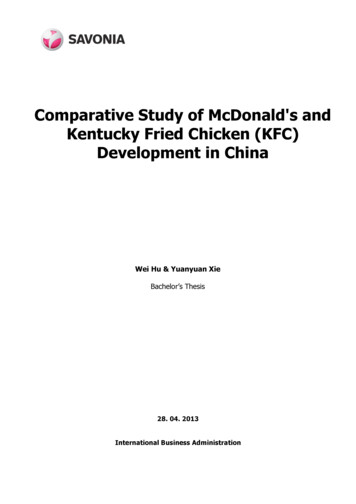
Comparative Study Of Pearson’s Chi-Square And Some Ordinal Contingency Tables ModelsThis model requires that the rows and the column variables be correctly ordered, hence, the name. It is alsoreferred to as Model I by Goodman (1979). Since both the row and column variables are ordinal, any changes inthe order of the row or the column change the structure of the model (Lawal, 2003). This means that the modelis not invariant to possible changes in the categories of the row and column variables (Powers & Xie, 1999). It isbased on (I-2) (J-2) degrees of freedom. The model is of the formln( mˆ ij ) iX Yj i (v j v ) j (ui u )(6)III. MethodologyThis section presents data collection, model, model estimation, and goodness of fit tests.DataData are gender, university attended for B.Sc., B.Sc. Grade, and M.Sc. Grade of 116 M.Sc. Statistics graduatesof University of Ilorin, Nigeria.Gender is classified as: Male and female. Male is coded 0 while Female is coded 1.University attended is classified as follows: Group 1 for University of Ilorin, Group 2 for other universities.University of Ilorin is coded 1 while “other universities” is coded 0.B.Sc. Grade is classified as: First Class, Second Class Upper, and Second Class Lower. Second Class Lower iscoded 1, Second Class Upper is coded 2 while First Class is coded 3.M.Sc. Grade is classified as: Terminal, M.Phil./Ph.D Grade and Ph.D. Grade. Terminal Grade is coded 1,M.Phil./Ph.D. Grade is coded 2 and Ph.D. Grade is coded 3.ModelPearson’s chi-square statistic is defined 2 O Eij ijOij2 (2r 1)( c 1)(7)where Oij and Eij are observed and expected frequencies for the (i, j)th class.The ordinal models involved: U, C, R, and R C models are discussed in Section 2.Model EstimationMode was estimated by maximum likelihood estimation method.Goodness of Fit TestsThe article utilized the likelihood ratio statistic due to (G2) by Wilks (1938)The G2 statistic is defined nG 2 2 ni log ii mi (8)whereni is the observed frequency and mi is the expected frequencyG2 is Chi-square distributed with degrees of freedom equal to number of cells in the table less number ofindependent parameters estimated.IV. Results and DiscussionTable1 presents each model and its assumption violation status.Table 1. Model assumption statusCombination 2URCR CGender Vs B.Sc.Gender Vs M.Sc.University Vs B.Sc.University Vs M.Sc.B.Sc. Vs M.Sc.University Vs GenderVVVVVSVVVVSVSSSSSVVVVVSVVVVVSVKey: V- Assumption violatedS- Assumption satisfiedDOI: 10.9790/5728-1502012832www.iosrjournals.org30 Page
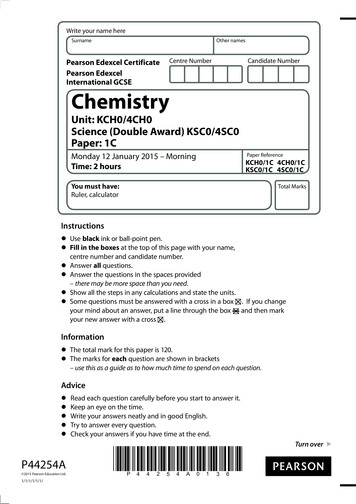
Comparative Study Of Pearson’s Chi-Square And Some Ordinal Contingency Tables ModelsThe Pearson’s chi-square violates all but university-gender combination. The assumptions of U, C and R Cmodels are satisfied by all but B.Sc.- M.Sc. classification.Table 2. Inferences of Models for various combinationsCombination 2URCR CGender Vs B.Sc.Gender Vs M.Sc.University Vs B.Sc.University Vs M.Sc.B.Sc. Vs M.Sc.University Vs GenderSSSSSSNNNNSSSSNNSSNNSSNSSSSSNSKey: S- SignificantN- Not significantInferences drawn from each model application on the data are presented in Table 2. Pearson’s chisquare rejected the null hypothesis of independence in all cases; the U model rejected in 2 of 6 cases while Rrejected in 4 cases. The C model rejected in 3 cases while R C rejected in 5 out of 6 cases. Pearson’s chi-squarehence, rejected most frequently, followed by R C, then R, C and U that rejected least frequently. Pearson’s chisquare reached same conclusion with U model on 2 occasions; it reached same conclusion with C model on 3occasions, with R on 4 and with R C on 5 occasions. This implies that Pearson’s chi-square agreed mostly withR C, followed by R, then C and lastly, U model.Pearson’s chi-square reached same conclusion with U model on the only occasion the assumption of Uwas satisfied. It reached same conclusion with R model on 3 out 5 occasions in which the assumption of thelatter was satisfied; however, it reached a contrary conclusion with C and R C models on the only occasion theassumption C and R C models had their respective assumptions satisfied. The ordinal association modelsreached same conclusion of independence as did the Pearson’s chi-square on the only occasion the assumptionof the latter was met. This is unique and may be a pointer to higher robustness of ordinal association modelsthan Pearson’s chi-square, although larger scale work may be required to validate this. Generally, out of the 8occasions in which assumptions of ordinal association models were satisfied, Pearson’s chi-square reached sameconclusion only 4 times. When satisfaction of each ordinal model assumption was taken into consideration,Pearson’s chi-square agreed mostly with R and then, U model.V. ConclusionThis article has compared inferences from Pearson’s chi-square to those of some ordinal associationmodels. It was found that Pearson’s chi-square agreed mostly with R C, followed by R, then C and lastly, Umodel when each model underlying assumption was not taken into cognizance. However, when taken intoconsideration, it agreed mostly with R, followed by U model. The ordinal association models demonstratedhigher robustness than Pearson’s chi-square. The need to conduct larger scale study is [8].[9].[10].[11].[12].Agresti, A. (2007). An Introduction to Categorical Data Analysis (2nd ed.). New Jersey: John Wiley.Aktas, S. & Saracbasi, T. (2003). Analysis of triangular contingency tables. Hacettepe J. of Math. & Stat., 32, 43-51.Altunay, S.A. & Saracbasi, T. (2009). Estimation of symmetric disagreement using a uniform association model for ordinalagreement data. ASTA Advances in Sta. Anal., 93(3), 335-343.Camminatiello, I., D’Ambra, A. & Sannacchiaro, A. (2014). The association in a two-way contingency table through logodds ratio analysis: the case of Sarno river pollution. Springer Plus, 3. DOI 10.1186/2193-1801-3-384.Eshima, N., Tubata, M. & Tsujitani,, M. (2001). Property of the RC(M) association model and a summary measure ofassociation in the contingency table. J. Japan Stat. Soc., 31(1), 15-26.Gokhale, D.V. & Klein, R. (1995). Analysis of contingency tables by marginal scores. Brazillian J. of Prob. & Stat., 25-42.Goodman, L.A. (1979). Simple models for the analysis of association in cross-classification having ordered categories.American Journal of Sociology, 84, 804-829.Krampe, A., Katari, M. & Kuhnt, S. (2011). Assymetry models for square contingency tables: exact tests via algebraicstatistics. Statistics and Computing, 21(1), 55-67.Lawal, B. (2003). Categorical Data Analysis with SAS & SPSS Applications. New Jersey: Lawrence Erlbaum. System (2nded.). SAS Institute.Symposium on Mathematical Statistics and Probability, 239-273.Pearson, K. (1900). On a criterion that a given system of deviations from the probable in the case of a correlated system ofvariables is such that it can be reasonably supposed to have arisen from random sampling. Philo. Mag., Series, 5(50), 157175.Pecker, M.P. & Clogg, C.C. (1989). Analysis of sets of two-way contingency tables using asymmetric models. JASA,84(405), 142-151.Powers, D. & Xie, Y. (1999). Statistical methods for categorical data analysis (2nd ed.). Texas: Academic Press.production and hinders pollen performance in cucurbita texana. Ecology, 76, 437-443.DOI: 10.9790/5728-1502012832www.iosrjournals.org31 Page
Comparative Study Of Pearson’s Chi-Square And Some Ordinal Contingency Tables Models[13].[14].[15].Ritov, Y. & Giluta, Z. (1991). The ordered-restricted RC model for ordered contingency tables: estimation and testing of fit.The Annals of Statistics, 19(4), 2090-2101.Takare, Y. (1987). Analysis of contingency tables by ideal point discriminant analysis. Psychometrics, 52(4), 493-513.Wilks, S.S. (1938). The large-sample distribution of the likelihood ratio for testing composite hypotheses. Ann. Math.Statist., 9, 60-62.Bushirat T. Bolarinwa. "Comparative Study of Pearson’s Chi-Square and Some OrdinalContingency Tables Models." IOSR Journal of Mathematics (IOSR-JM) 15.2 (2019): 28-32.DOI: 10.9790/5728-1502012832www.iosrjournals.org32 Page
assumption of the latter was met, Pearson's chi-square reached same conclusion only on 4 out of the 8 occasions on which the assumptions of ordinal association models were met, suggesting higher robustness of ordinal association models. It was found that Pearson's chi-square agreed mostly with R C, followed by R,