Transcription
INTERNATIONAL JOURNAL OF SCIENTIFIC & TECHNOLOGY RESEARCH VOLUME 5, ISSUE 12, DECEMBER 2016ISSN 2277-8616Occupational Health And Safety Management InRMG Sector Of BangladeshKallol Kumar SamaddarAbstract: The ready-made garments (RMG) industry plays a vital role to augment the socio-economic development of Bangladesh. However, workershealth and safety issue in this sector still less focused even though recent time increasing accident rate and loss of lives in some deadly incidents likeaccidents in Rana Plaza and Tazreen Fashion attack keen attention from home and abroad regarding fire hazards and building safety. In thiscircumstances, this study aims to depict overall scenario about occupational health and safety of workers in RMG factories and identify occupationalhealth and safety factors which have an impact on workers performance as well as factories efficiency. Fire risk index (FRI) of various factories isoccupied to get an overview of fire safety and relative importance of occupational health and safety factors are identified by relative important index (RII).Principal component analysis (PCA) is conducted to investigate the significance of occupational health and safety factors categorized in the variables.Then cause and effect diagram is developed to identify key causes behind musculoskeletal disorder and occupational accident. The relative importantindex (RII) shows that factories are relatively more concern about health hazard and emergency situation rather than working condition. Prolong workingtime is the most common in the factories which result in workers sufferings from lower back pain. Most of the workers are injured through needle piercingas negligence of using needle guard which is the root cause. The study also reveals that standard working condition augments factories performance interm of efficiency while accident rate impediment the factories from achieving target efficiency.Index Terms: Factories Efficiency, Fire Risk Index (FRI), Musculoskeletal Disorder, Occupational Accident, Occupational Health and Safety Factors,Relative Important Index (RII)—————————— ——————————1 IntroductionThe readymade garments industry acts as a promoter of theprosperity of Bangladesh, has been making a crucialcontribution rebuilding the country and its economy which isnow the single largest export earner for Bangladesh. Textilesand clothing account for about 85% of total export earnings ofBangladesh. Out of which, 76% comes from the apparel sector[4]. From a humble beginning of 12 industries in 1978, thegarment industry currently consists of 5,600 factories ofvarious sizes and about 4.4 million people, mostly women,worked in this sector [1]. Around 20 million people are directlyand indirectly depending on RMG sector for their immediatelivelihood [6]. Despite many difficulties faced by the sectorover the past few years, it has engraved an appropriate placein the world market and kept displaying outstandingperformance. Despite the epic growth of the RMG industry andits luminous expectations, there are affluent challenges thatneed to be surpassed. One of the biggest challenge currentlyfaced by the RMG industry is to ensure better occupationalhealth and safety condition for the millions of garment workers.RMG industry is to ensure better occupational health andsafety condition for the millions of garment workers. InBangladesh, higher production and greater economic returnsare considered as the prime goal rather than other majorconsiderations in industries. The even petite significance isconcentrated on the communal value in terms of influences onworkers, workplaces, society, and environment. Theimpressions are adulterated by the incompatible worth of lifedecisions, pain, and suffering, opportunity costs and questionsof equity [6].The estimates of direct economic costs and benefits areusually made keeping aside from the ethical liabilities to thesociety as a whole. Industrialists often consider the regulatorycompliances and related administrative costs deterrent toproductivity. As such occupational health and safetyconsiderations remains ignored. As the issue of workplacesafety has been ushered to the onwards due to the twoegregious mishaps, the Tazreen fire and the Rana Plazacollapse of recent time, all stakeholders and investors aredriven to act appropriately. Several institutions such as theBangladesh Accord on fire and building safety, the Alliance forBangladesh worker safety and national plan of action havebeen designed to ameliorate building and fire safety ofBangladesh’s garment industry with a view to abstaining thesaddening occurrences [1].Maximum workers in thesegarment factories are almost illiterate and they have verylimited knowledge of human rights, working conditions andlabor standards [6]. Also, management of maximum factoriesis not concern about occupational health and safety conditioninside their factory. However, ensuring better occupationalhealth and safety conditions at all garment factories is animmense undertaking and will take a time to attain. However,with the support of global brands and internationaldevelopment partners, we believe the government ofBangladesh, Bangladesh Garment Manufacturers andExporters Association (BGMEA) and Bangladesh KnitwearManufacturers and Exporters Association (BKMEA) will beable to ascertain healthier occupational health and safetycircumstances of the RMG industry and preserve the impetusof socio-economic advancement of the country.2 BACKGROUND OF THE STUDY Kallol Kumar Samaddar has completed a bachelor ofengineering in Industrial and Production Engineering inShahjalal University of Science and Technology,Bangladesh, PH- 8801710996086. E-mail: kallol.ipe@gmail.comThe International Labour Organization (ILO) projected thatevery year about 2.3 million people dies from occupationalmishaps and ailments whereas around 270 million sufferegregious non-fatal injuries and another 160 million become illfor shorter or longer periods from work-related causes in allover the world [2]. This epitomizes a colossal toll of anguish forworkers and their families. Moreover, the ILO estimated thatthe total costs of such accidents and ill health amount toapproximately 4 percent of the world’s GDP (Gross Domestic176IJSTR 2016www.ijstr.org
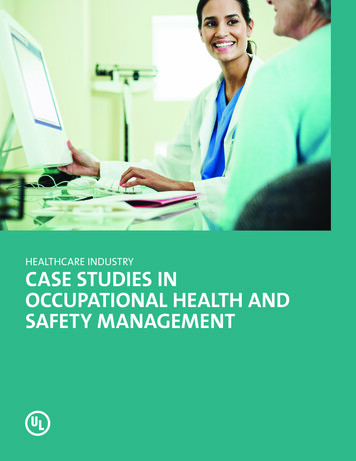
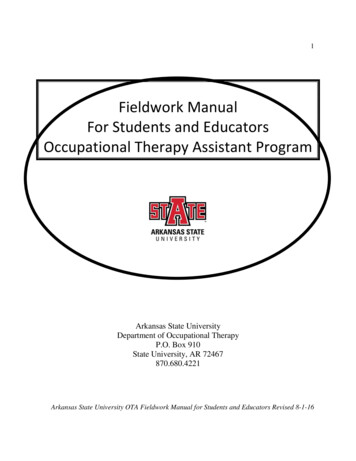
INTERNATIONAL JOURNAL OF SCIENTIFIC & TECHNOLOGY RESEARCH VOLUME 5, ISSUE 12, DECEMBER 2016ISSN 2277-8616Product). Besides about 5 percent of the encumbrance ofdiseases and injury in firm market economies can be ascribedto work which resembles approximately to the ILO’s figure [2].Therefore avoiding occupational accidents and diseasesshould make economic sense for the community as well asbeing good business practice for industries as these significantlosses have an adverse influence on economic accrual andputs a burden on society. If there are a deficiency of effectiveprotection at work to assure health and safety variousconsequences such as absenteeism workplace accidents andoccupational illnesses can lead to permanent occupationaldisability. The huge economic expenses of difficultiesconnected with health and safety at work that impedeeconomic growth and affect the competitiveness ofbusinesses. As a result, social security systems and publicfinances have to deal with a significant share of these costs.3 METHODOLOGYThis research paper is based on survey methodologyapproach that has been applied to collect and analyze data bymix strategy. Five hundred (500) respondents are randomlyselected from thirty-six (36) industries as the sample for themusculoskeletal disorder study while all the factories areconsidered for fire safety, occupational health and safetyfactors, accident and efficiency. The target group isinterviewed via questionnaire and sometimes directobservation approach is applied. Various inspection reportsand previous documents are also a great source ofaccumulating information about performance criteria of theparticular environment. After the information is collected(retrieved from the factories and respondent successfully),some descriptive statistics such as mean standard deviation,fire risk index (FRI), relative important index (RII) and factoranalysis, principal components analysis (PCA) and cause andeffect diagram have been used for this analysis. For fire riskindex is calculated by an equation that includes all nineteen(19) parameter weights and grades which are presented inappendix A. Reliability of questionnaires (in terms of internalconsistency) is tested by the Cronbach’s alpha (Cα) of eachvariable. Kaiser-Meyer-Olkin measure of sampling adequacy(KMO-MSA) and Bartlett’s test of sphericity are applied to testthe adequacy of the collected data for factor analysis. Toexplore all the potential or real causes (or inputs) that result ina single effect, causes are arranged according to their level ofimportance or detail, resulting in a depiction of relationshipsand hierarchy of events. Spearman correlation is applied tomeasure a non-parametric correlation between variables suchas efficiency, occupational accident, occupational health andsafety factors. In our study, for efficiency calculation six (6)months of individual factories’ efficiency is considered andtheir average is calculated that is included in appendix C.Likewise, the data of musculoskeletal disorder (MSD) arerepresented in appendix B.Fig. 1. Flow chart of research study4 FINDINGS AND ANALYSISAn overview of the results obtained in the study are presentedand discussed in this chapter. In this research work, data havebeen collected from thirty-six (36) garment factories inBangladesh. The demographic information in the context oflocation, membership, establishment period, employeenumber which has been depicted in table 1.Table 1: Demography according to various attributesAttributeLocationMembershipEmployee numberEstablishmentperiodNumber %None513.89%Below 200038.33%2001-35001130.56%3501-50005001-6500Above 6500After year 2000Before the year200014621738.89%16.67%5.56%47.22%1952.78%The above table 1 recounts that maximum factories areselected from Dhaka and Gazipur. Most factories are amember of BGMEA while BKMEA in second whereas fivefactories do not have any membership. According to employeenumber factories are divided five major sections and amongthem, maximum factories are placed 2001-5000 in number.4.1 Fire Risk IndexRisk indexing is a way of evaluating multiple attributes into asingle value and various risk indexes differ primarily in thenumber and types of parameters (attributes) considered andthe arithmetic functions used to summarize these parameters.For current research work a linear additive model of the177IJSTR 2016www.ijstr.org
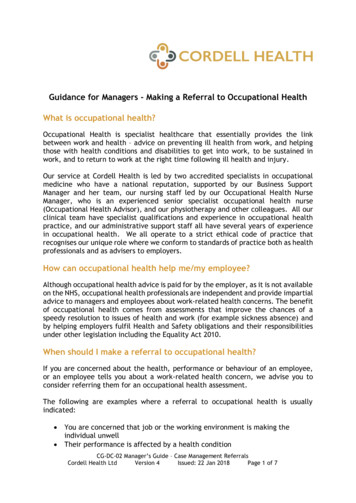
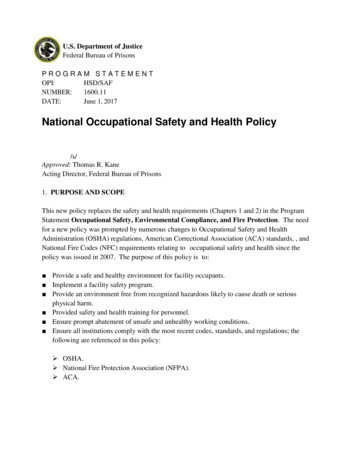
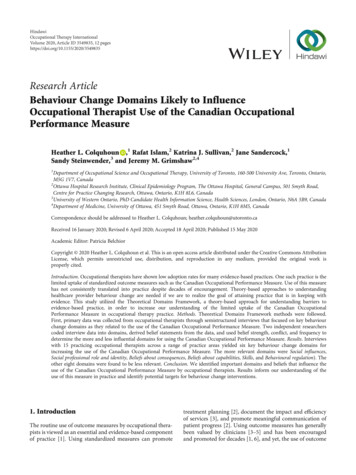
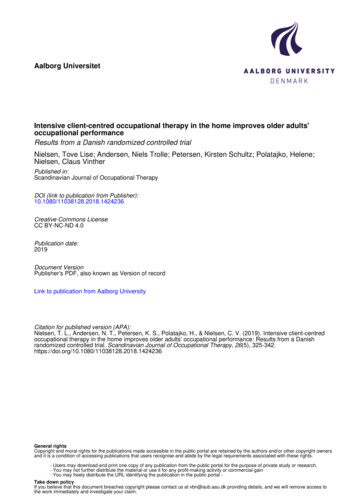
INTERNATIONAL JOURNAL OF SCIENTIFIC & TECHNOLOGY RESEARCH VOLUME 5, ISSUE 12, DECEMBER 2016ISSN 2277-8616following form has been used in order to determine Fire RiskIndex [7]:comparing with the ideal case through direct investigation. Forthe first factory,FRI (Wi*Xi )/ WiFRI (366.2/81.6) 4.49Where, Xi is a dimensionless score or grade points forparameter i, Wi is the importance of parameter i. Wi has beenfound by calculating the average of weight given by expert foreach parameter.Xi has been given to parameter byAverage FRI (Fire Risk Index) shows the scenario ofBangladeshi readymade knitting garment factories in case offire safety by providing a value in the scale of 5.Table 2: FRI (Fire Risk Index) for 36 Garment Factories.Factory Number123456789101112131415161718Fire Risk .494.173.434.263.813.384.34Average Fire Risk Index,Factory Number192021222324252627282930313233343536Fire Risk .432.894.064.564.783.804.18of the FRI situated in that location)/ (No. of factories in thatlocation).( FRI)/n (137.8/36) 3.83;Where n number of garment factories.A graphical representation through histogram for Fire RiskIndex versus a number of garment factory has been shownbelow.Figure 3: Comparison of average FRI among different locationof factoriesFigure 2: Fire Risk Index vs FrequencyFrom figure 2, it has been found that FRI ranged from 2.01 to3.00 for 3 factories among 36 factories. This range of FRIindicates the poor condition of fire safety in those factories.Other 16 factories’ FRI is ranged from 3.01 to 4.0 thatindicates the average condition of fire safety in those factories.Rest 17 factories among 36 factories are ranged from 4.01 to5.00 which indicate a good condition of fire safety in thosefactories. Location based average FRI is calculated using theformula as shown below, Average FRI in each location (SumFrom the above figure 3, it has been found that Factories ofSavar area have more precautions about fire safety than otherareas (Gazipur, Dhaka, Narayanganj area). Factories ofGazipur and its surroundings have more concern about firesafety after Savar area. Factories of Narayanganj and itssurroundings have more concern about fire safety afterGazipur area. Factories of the capital city have the lowestaverage fire risk index which concludes that factories from thecapital city have the lowest concern about fire safety. Thosefactories either are members of BGMEA, BKMEA or memberof none these two organizations. Average FRI (Fire Risk178IJSTR 2016www.ijstr.org
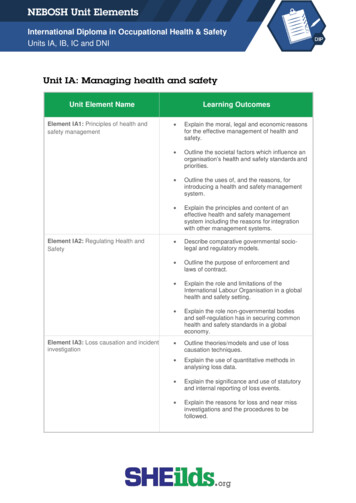
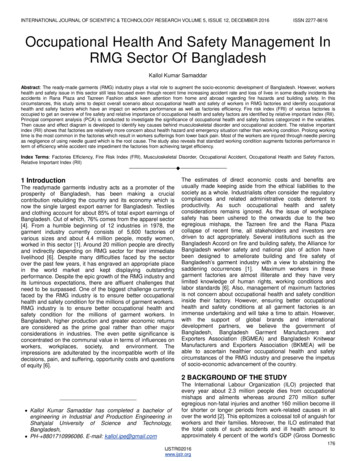
INTERNATIONAL JOURNAL OF SCIENTIFIC & TECHNOLOGY RESEARCH VOLUME 5, ISSUE 12, DECEMBER 2016Index) has been calculated using the formula as shown below,Average FRI for members of each organization (Sum of theFRI member of that organization)/ (No. of factories in thatorganization).Figure 4: Comparing average FRI among differentorganizationsFrom the bar chart, figure 4, it is noticeable that factoriesunder the membership of BKMEA have more concern aboutfire safety than others (BGMEA and others who are notmembers of both BGMEA and BKMEA). BKMEA and BGMEAboth pressurizes their organization’s members to follow safetycode. Nonmembers of both organizations have no strict rule tofollow about fire safety, therefore, has the lowest average FRI.Regular health inspectionSafe operating procedureHeat insulatorHealth & safety trainingHand glovesNeedle guardEarmuffWorking timeReview and update safe workNoise levelTemperature levelCleanness of workplaceDust control systemFactorsWidth of stairsFirst Aid BoxNoise levelVibration levelLightTemperature on.810.877.715.807.771.693Air circulationCleanness of workplaceSanitation systemPure drinking waterDust control systemWorking spaceWorking 2.752.768.686.750Needle guardEye guardPaddle guardHeat insulatorEarmuffFace maskHand 803.732.872.870.768ApronRegular health inspectionHealth and safety trainingSafe operating y related inspection1.000.868Safety sign1.000.871Reports on safety incidents1.000.832Review and update safe work1.000.816For first aid box, RII 158/(5*36) 0.878Where, W, Summation of the weight given to first aid box bythe respondents 158. A, Highest weight 5.00. And N, Totalnumber of respondents 36.Table 3: Comparison of ranking of the overall factorsFirst Aid BoxLightWidth of stairsAir circulationSanitation systemPure drinking waterWorking spaceVibration levelSafety signPaddle guardEye guardReports on safety incidentsApronSafety related inspectionFace 25262728Table 4: Communalities of each factorRII W/(A*N)RII(RelativeImportant 5610.5560.550.5440.5330.4940.4780.3940.389Table 3 reveals that the factors affecting occupational healthand safety in RMG with an overall ranking. In this study tableshows that the level of overall occupational health and safetyhas been mostly emphasized on the factor “first aid box” andless emphasized factor “dust control system”, that indicatesthe level of occupational health and safety among RMG inBangladesh is working condition oriented. On the other hand,another factors such as “dust control system” and “cleanlinessof workplace” have been less emphasized which alsoindicates that health hazards are still neglected and healthcondition worsen day by day in RMG. Prior to principalcomponent analysis, the strength of each factor is examinedby communality to decide the accuracy of factor analysis.4.2 Factor AnalysisRanking of occupational health & safety measurement factorsrepresents the importance of particular factors that influencethe level of occupational health & safety in RMG. A total of 28factors is ranked in descending order of RII (Relative ImportantIndex) based on the answers to particular questions. RII iscalculated by following equation [5]:FactorsISSN 2277-8616The communities of all factors are shown in table 4. It revealsthat each factor has communality greater than 0.5, which179IJSTR 2016www.ijstr.org
INTERNATIONAL JOURNAL OF SCIENTIFIC & TECHNOLOGY RESEARCH VOLUME 5, ISSUE 12, DECEMBER 2016suggests their accuracy valid for factor analysis. Principalcomponent analysis with Varimax orthogonal rotation is usedto reduce 28 factors into highly predictive variables ofoccupational health and safety in RMG.5.Table 5: Reduction of the factors into six (6) critical igenvalue10.798Percentage ofvariance39.992FactorsFactorloadingsEar muff.930Face Musk.893Apron.866Eye atorHealth andsafetytrainingSafety eviewand updatesafe workSafetyrelatedinspectionReports ustcontrolsystemCleannessofworkplaceNoise levelTemperature water.5521.1084.071First AidBox.9241.0753.841Width ofstairs.826Table 5 narrates that total of 6 variables is developed, namedas safety equipment, working condition, management, healthhazard, emergency situation and infrastructure factor withEigen values greater than 1.00. The total percentage ofvariance of this study is 83.204 which means the six (6)variables can explain 83.204 percentage (%) of the totalvariation of the data set. KMO MSA and Bartlett’s test ofsphericity are measured to test the adequacy of the collecteddata from respondents used in factor analysis.Table 6: KMO MSA and Bartlett’s test result.844.833EmergencySituationInfrastructureISSN 2277-8616Kaiser-Meyer-Olkin of Sampling of Sampling AdequacyBartlett’s Test of Sphericity (Approx. Chi-Square)df (degree of freedom)Sig.0.8205230.313860.000In this study, the result of Bartlett’s test of sphericity is approx.Chi-square 5230.313, df 86 and significant level, p 0.000and KMO MSA value is 0.820 which is suggested to beacceptable for factor analysis. A statistic Cronbach’s alpha(Cα) for investigating the internal consistency of questionnaireis examined for each variable (shown in Table 7).890.870Table 7: Cronbach’s alpha (Cα) reliability test results for 76.864.708VariablesCronbach’salpha (Cα)Safety Equipment.955Management.958Working Condition.900Health Hazard.866The validity and reliability of questionnaires (in terms ofinternal consistency) is tested by the Cronbach’s alpha (Cα) ofeach variable. Table 7 presents that, the variables “safetyequipment”,” management”, “working condition”, and” healthhazard ” respectively has Cronbach’s alpha (Cα) value of0.955, 0.958, 0.900 and 0.866. Each of the Cronbach’s alpha(Cα) values of these four variables is considerably high whichindicates high validity and reliability in term of internalconsistency.4.3 Musculoskeletal Disorder AnalysisThe chapter commences with an analysis of thedemographical data gathered from the study sample (n 500).The data analyzed are presented in the form of pie charts.This followed by a description of the most leading samplecharacteristics by means of frequencies and percentages.663180IJSTR 2016www.ijstr.org
INTERNATIONAL JOURNAL OF SCIENTIFIC & TECHNOLOGY RESEARCH VOLUME 5, ISSUE 12, DECEMBER 2016ISSN 2277-8616Figure 5: Frequency of workers vs. gender classificationFigure 8: Frequency of workers vs. existence of painFigure 5 delineates the gender distribution of the sample. Thesample respondents of a larger number of female respondents tothat of male respondents. Female respondents comprised of 83%(n 415) compared to 17% (n 85) male respondents.Figure 8 displays the existence of pain of the sample. Thedifferent kinds of pain exist in 90.6% (n 453) of workers whereas9.4% (47) of the sample has no pain.Figure 6: Frequency of workers vs. age.The graphical presentation of the age distribution of the sample isdepicted in figure 6. The majority of the respondents (n 290 or58%) fall in the age category 18-30 years. This is followed by 140(28%) of the respondents in the age category 31-45 years old.The minority of the respondents fall in the age category 46 yearsand older, constitutes 14% (n 70) of the sample. From theensuing results, it can, therefore, be concluded that the majority ofthe workforce participating in the study is very young, rangingfrom the ages 18-30 years old.Figure 9: Frequency of workers vs. types of MSDFigure 9 depictures the graphic presentation of types of MSDdistribution of the sample. The majority of the respondents(n 310, 68.43%) suffer from lower back pain while the secondmajor is neck pain (n 221, 48.78%). In addition, pain in shoulderjoint (n 153, 33.77%) and headache (n 190, 41.94%) are alsofound constantly among the sample. There are observed almostsimilarity between upper back pain (n 83, 18.32%) and pain inhip joint (n 88, 19.42%) as well as pain in elbow joint (n 60,13.24%) and respiratory problems (n 74, 16.33%). On the otherhand, eye strain (n 13, 2.87%) is the minor MSD which is abouthalf of pain in wrist joint (n 30, 6.62%).Figure 7: Frequency of workers vs. education levelFigure 7 illustrates the education level of the sample. The graphindicates that the majority of the respondents, 53.2% (n 266) hasan educational level of class 6 to class8 and 30.8 (n 154)possess an educational level of class up to 5. Eighty (80)respondents (16%) has an education level up to class 10 andabove.FIGURE 10: CAUSE AND EFFECT DIAGRAM OF MUSCULOSKELETALDISORDERThis fishbone diagram 10 is marked to fathom the origin of181IJSTR 2016www.ijstr.org
INTERNATIONAL JOURNAL OF SCIENTIFIC & TECHNOLOGY RESEARCH VOLUME 5, ISSUE 12, DECEMBER 2016musculoskeletal disorder at the workplace in the garmentindustry of Bangladesh. We used the eight (8) genericheadings to prompt ideas. Layers of branches show throughthinking about the causes of the problem. Pain in the neck,shoulder, elbow joint, wrist joint, hip joint and in lower backhave some commonly determined causes as repetitive andinvariable work, prolong working time, awkward posture due tolacking in ergonomic application and break time. Anotherimportant factor inefficient lighting and continuous work areresponsible for eye strain and neck pain. At the end, dust is aplausible cause of respiratory-related injuries. SpearmanCorrelation between Occupational Health and Safety Factorsand musculoskeletal disorder to represent the relationshipamong workers in particular factories.Table 8: Spearman correlation between MSD andoccupational health and safety factors.OccupationalHealth and SafetyFactors (OHSF)Standard workingtimeAppropriate lightingat the workplaceAllowable vibrationlevelEffective dustcontrol systemMusculoskeletalDisorder (MSD)Pain in elbow jointPain in neckPain in shoulder jointPain in hip jointHeadachePain in lower backPain in neckHeadacheEye strainPain in elbow jointPain in shoulder jointRespiratoryproblemsCorrelations betweenOHSF with thePresence of -0.778**-0.675**-0.827**-0.710**-0.672**ISSN 2277-8616negatively strong correlated and pain in shoulder negativelymoderate correlated with vibration level at same significancelevel. Moreover, dust control system shows moderate negativecorrelation with respiratory problems of workers whichrepresent workers suffer most in those factories in whichsystem fails to control dust as for 8 hours working period dustshould not exceed the limit of 2.5 mg/m3 for cotton dust and10 mg/m3 for [3] . Therefore we can draw an outline fromabove relationships that when the factories fail to providestandard occupational environment and equipment the rate ofMSD increases with considerably.4.3 Occupational Accident AnalysisThe chapter begins with an analysis of the number ofaccidental data documented from thirty-six (36) garmentsfactories the study sample (n 3948). The analyzed data arepresented in the form of column charts. This followed by adescription of the most leading sample characteristics bymeans of frequencies and percentages.-0.571****. Correlation is significant at the 0.01 level (2-tailed).The above table 8 represents the relationship between theoccupational health and safety factors with regards to thepresence of musculoskeletal disorder (MSD) among workersin particular factories. From the table, we can summarize thatstandard working time, appropriate lighting at the workplace,allowable vibration level, and effective dust control systemhave great influence over different MSD problem. According toBangladesh National Garments Worker’s federation, themaximum working hour per day is 10 hours including 2 hourovertime [2]. In our study, we have found that the factories thatfail to follow standard working time, workers are sufferingsfrom pain in the hip joint. Similarly, pain in elbow joint,headache and pain in the shoulder are weakly correlated whilea pain in the neck has moderately correlated at thesignificance level of 0.01 level (2-tailed). According tooccupational health and safety manual, the requirement oflighting in a garment factory is 500-1000 lux [3], varies due toworking category. In our research, eye strain is a very commonproblem among workers because of lighting problem andillumination in garments which indicates a strong negativecorrelation with appropriate lighting at the workplace. In thesame way, lighting system has a moderate negativecorrelation with pain in lower back and headache while strongnegative with pain in the neck that means a situation of neckpain is worst or presence highly in those factories in whichsufficient lighting system cannot be managed. In our analysis,we have found that the factories are exposed to high vibrationmachines, the existence of elbow and shoulder pain alsoincrease among workers which suggest pain in elbow joint isFigure 11 Frequency of accidents vs. agents of accidentThe figure 11 exhibits a graphical presentation of the agentsthat are accountable for accidents have occurred during thespecific time period of one year in thirty-six (36) garmentsfactories. The majority of the accidents occur due to the agentabout 1608 workers (40.73%) by a needle while second bestoccurrence, almost one-fifth (1/5th) in comparison with aneedle, is chair or table in agronomical point of view. There arealmost similar frequency has been observed for scissors(n 232, 5.88%), slippery surface (n 222, 5.62%), trolley(n 219, 5.55%), stairs (n 211, 5.34%) and cloth iron (n 198,5.01%). The spindle (n 145, 3.67%) and others (n 155,3.96%) categories also show almost similarity as well aselectricity (n 174, 4.40%) is about double compared to theagent pump or boiler or generator (n 89, 2.25%) in relationwith the accidents. In addition, knife edge plays a vital role inthe causation of accidents about 308 workers (7.80%) and theleast responsible agents are toxic chemicals (n 29, 0.73%)and dust (n 24, 0.60) where dust is the lowest of all.182IJSTR 2016www.ijstr.org
INTERNATIONAL JOURNAL OF SCIENTIFIC & TECHNOLOGY RESEARCH VOLUME 5, ISSUE 12, DECEMBER 2016Figure 12: Cause and effect diagram for an accident in thegarment industry.This fishbone diagram 12 was drawn to understand the sourceof periodic accidents occurs in garments of Bangladesh. Weuse the six generic headings to prompt ideas. Layers ofbranches depict thorough thinking about the causes of theproblem. Under the heading “Machines,” the idea shows six(6) kinds of equipment such as a needle, pump, trolley,screws, sharp cutting edge and heat of printing machine thatare greatly responsible for occupational accidents atworkplace. In addition, there are only three causes areidentified like dust and dirt, chemical disposal and temperaturelevel in “Environment”. However, the inconsistency oftechniques, unawareness, over confident, failure to follow thestandard procedure as well as lacking in using PPE is listedunder the category of “Man”. In “Method” category of cause,absence of specific procedure, limitation in specifications andadministration, ineffective work set up and wrong loop size Management” is the most important section as the effects ofmanagement are always not as visible like others whichinclude poor supervision, lacking in motivation, inadequatetraining and lacking in supplying PPE. At last, there are onlytwo possible causes documented for “Material” heading.Spearman correlation between occupational health & safetymeasurement factors and accident rate to illustrate therelationship between the occupational health and safetyfactors with regards to the occurrence of the accident forcertain period of the time interval in particular factories.Table 9: Spearman correlation between Accident rate andOccupational health and safety factors.Occupational Health and SafetyFactors (OHSF)Standard working spaceCorrelations betweenOHSF with accident rate-0.527**Allowab
RMG Sector Of Bangladesh Kallol Kumar Samaddar Abstract: The ready-made garments (RMG) industry plays a vital role to augment the socio-economic development of Bangladesh. However, workers health and safety issue in this sector still less focused even though recent time increasing accident rate and loss of lives in some deadly incidents like