Transcription
Dimodelo SolutionsData Warehousing and Business IntelligenceConcepts Copyright Dimodelo Solutions 2010. All Rights Reserved. No part of this document may be reproduced without written consent fromthe author
TABLE OF CONTENTSDATA WAREHOUSING . 2WHAT IS A DATA WAREHOUSE ? . 2WHY DO YOU NEED A DATA WAREHOUSE? . 2Why you need Data Warehouse Automation . 2DESIGN OF A DATA WAREHOUSE . 3Facts tables and Measures . 3Dimensions and Attributes . 3Star Schema. 3Types of Fact Tables . 5Slowly Changing Dimensions . 6ETL (EXTRACT TRANSFORM LOAD) . 6Extract and Staging. 6Transformation and Load . 7Build Cube/Column Store . 7BUSINESS INTELLIGENCE AND DATA WAREHOUSING SOLUTION COMPONENTS . 8BUSINESS INTELLIGENCE APPLICATIONS. 10Performance Management . 10Management Reporting . 12Ad Hoc Analysis . 12Data Mining, Predictive Analysis and Planning . 13Task Based Reporting. 13DATA WAREHOUSE COMPONENTS . 13RDMS Server . 13ETL Server . 13Cube/OLAP/Multidimensional Database . 13Column Store/ In Memory/ Tabular Database . 14OLAP SERVER . 14BI PORTAL. 14ABOUT ‘DIMODELO SOLUTIONS’ . 14Dimodelo Solutions.Page 1Data Warehousing and Business Intelligence Concepts.
DATA WAREHOUSINGWHAT IS A DATA WAREHOUSE?A Data Warehouse is to be a database that contains data integrated from multiple source systems. It exists tosupport reporting and analysis in the organisation. It contains historical data, and is structured in what isknown as a star schema. It is optimized for high speed loading, and for responding to queries over large datasetsWHY DO YOU NEED A DATA WAREHOUSE?The benefits of a data warehouse include: The ability to integrate data from multiples source to provide analysis across business domains. I.e.across financial, HR, operations, sales etc.End User Productivity. In any organization there is a subset of people who spend part, or all of theirday producing information in one form or another. Typically they spend much of their time wranglingdirty data. One of the benefits of a data warehouse is end user productivity. All that data manipulationis already done, and the users can concentrate on analysing and responding to information, ratherthan producing it.Single version of the truth. One of the issues encountered when users report from operationalsystems, is the inconsistencies they can create between reports using their own queries, formulas anddefinitions. Meetings become about measure definitions, instead of about strategy. A data warehouseprovides consistent measures, periods, rollups, ranges, KPIs etc. across the business.Keep historical data and do analysis of the past as it was in the past. For example, imagine a salesperson who works in region A. All the sales made by the sales person roll up into the sales figures forregion A. Imagine said sales person moves from region A to region B. Now suddenly, if you arereporting directly from the operational system, the sales person’s past sales now roll up to the salesfigures for region B. Undesirable. A Data Warehouse has methods of preventing this issue, keepingpast sales associated with region A, and new sales are attributed to region B.Remove load from operational systems. A single analytical query can cause major performance issuesfor an operational system. Separating reporting and analysis load to a data warehouse removesadverse impacts on operational systems.Complex measures and data augmentation. A Data Warehouse provides consistent data augmentationfor reporting purposes that aren’t available in a source system. A data warehouse provides analyticsfunctions like relative period (e.g. MTD, YTD etc), periodic and rolling calendars (e.g. Christmas Period,Public holidays etc.) , definition of acceptable ranges, targets, KPIs, aggregation or disaggregation ofdata, and periodic balances (e.g. end of month balances).A Data Warehouse can keep historical data beyond the normal retention period of operationalsystems.WHY YOU NEED DATA WAREHOUSE AUTOMATIONDimodelo solutions provides a Data Warehouse automation tool called Dimodelo Architect.Traditional methods of building data warehouses have taken too long and the result have been too inflexible.A 2006 survey by DM Review and IDC and revel these statistics: 17 months is the average implementation time for a BI project.5 months on average to deploy the first usable BI artefact.Dimodelo Solutions.Page 2Data Warehousing and Business Intelligence Concepts.
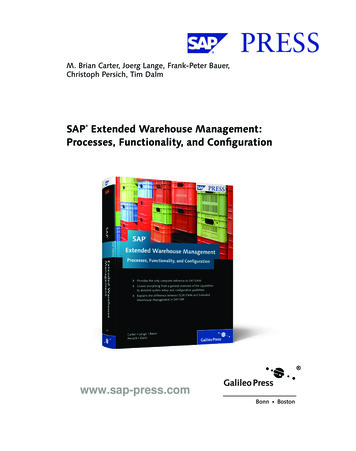
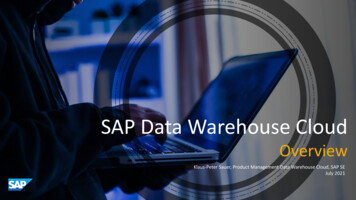
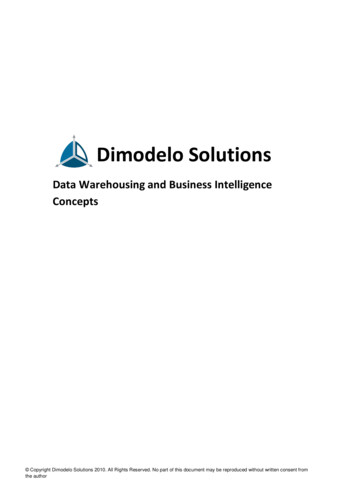
1.1m is the mean, annual expenditure on a BI project for business with greater than 1,000employees.Only 31% of BI projects are recognized as successfulA confidence rate of 36% that the right data is available to the right people.Not a great result!While a Data Warehouse is an extremely effective way of managing data for reporting and analysis purposes, itcan be difficult to create. This is where Data Warehouse automation comes in. It makes building a DataWarehouse much easier and faster, and makes the data warehouse more flexible and capable of changing asbusiness requirements change.DESIGN OF A DATA WAREHOUSEFACTS TABLES AND MEASURESA Fact table holds rows of data containing the measures/numbers you wish to analysis. For example, a Salesfact table contains one row per invoice line item with sale amounts, discounts and other measures. A Fact tableusually represents a business process or an event in a business process that you want to analyse. Fact tablesare often defined by their grain. The grain of a fact table represents the most atomic level by which the factsmay be analysed. The grain of a Sales fact table might be individual invoice line items.DIMENSIONS AND ATTRIBUTESA standard Dimension defines an entity in a business (e.g. Product, Customer etc), and groups the attributes ofthat entity together. A Dimension holds the attributes (i.e. fields) you want to analyse your facts by. E.g.Product Type, Product Colour etc. The attributes are used to constrain and group fact data when performingdata warehousing queries. E.g. Sales Amounts Fact, where Product Colour Silver. Other dimensions like Timeand Calendar are common.STAR SCHEMAA Star Schema refers to the way Facts and Dimensions are related in a Data Warehouse. A Star Schema isorganized around a central fact table that is joined to its dimension tables using foreign keys. The name starschema comes from the pattern formed by the entities and relationships when they are represented as anentity-relationship diagram. The fact table of a specific business activity (i.e. the Fact) is at the centre of the starschema and is surrounded by dimensional tables with data on the people, places, and things that cometogether to perform the business activity. These dimensional tables are the points of the star.An example:Suppose our company sells products to customers. Every sale is a business event that happens within ourcompany and the fact table is used to record these events. The Star schema would look like the diagram below.Dimodelo Solutions.Page 3Data Warehousing and Business Intelligence Concepts.
CustomerSaleCalendarProductRegionFact table: SalesThe fact table will contain the measures of the business event (in this case Units Sold and Total Amount) andthe foreign keys back to the associated Dimension members. The grain of this fact is one row per sale line item.Sale IDCalendar IDProduct IDCustomer IDRegion IDUnits SoldTotal Amount12013032117212341 500.0022013040621312462 345.872201304064312461 12378.98Dimension table: CustomersThe Customer dimension contains 1 row per customer. Each row contains the attributes of that customer. Notethat the values for the attributes are verbose descriptions, rather than codes (e.g. Male instead of say 1 forMale). The reason is that these values become column headings in a report, and a column heading of 1 is notvery informative. This demonstrates one of the key differences between modelling for a data warehouse andan operational system. A data warehouse contains much data redundancy.Customer IDFull NameGenderClub MemberMarital StatusOccupation1Brian EdgeMaleIs Club MemberMarriedFire Fighter2Fred SmithMaleIs Not Club MemberSinglePolice Man3Sally JonesFemaleIs Club MemberMarriedLawyerDimodelo Solutions.Page 4Data Warehousing and Business Intelligence Concepts.
By following the links we can see that, for example, the 2nd row in the fact table records the fact that customer3 (Sally Jones) bought two items (sale 2) on the day corresponding with the Calendar Dimension member withthe Id 20130406. And, in a complete example, we would also have a product dimension table, Calendardimension table and Region dimension table, so that we know what she bought, when and where.The fact table contains business events that happen in our company. The dimension tables contain the factors(Customer, Time, Product) by which we want to analyze the facts.Given this fact table and these three dimension tables, we can ask questions like: How many diamond rings(product dimension) have we sold to unmarried male customers (customer dimension) in south region (regiondimension) during the first quarter of 2008 (calendar dimension)?In other words, the difference between dimension tables and fact tables is that fact tables hold the measureswe want to analyze and the dimension tables hold the information necessary to allow us to break down themeasures, group them and aggregate (SUM, AVG etc) them. Dimensions hold the information we want toanalyse our Facts by.TYPES OF FACT TABLESThere are 3 main types of Fact tables. Transaction Fact Table, Periodic Snapshot fact table and AccumulatingSnapshot fact table. The three types are documented below:TRANSACTION FACTA transaction fact represents a discrete business event that itself doesn’t proceed through a series of statuses.It is often identified as a single record within a source database. It could be part of a larger business process,but this one event within the process generates its own record in the source database. For example, let’sexamine a simple purchasing process; first an internal purchase order is generated, then the goods are receivedfrom the supplier, then a supplier invoice is received, then a payment is made to the supplier. Each of thediscrete events of this business process result in a record being created in source system, and therefore therewould be a transaction fact table for each purchase orders, goods receipts, supplier invoices and payments.Other examples are metering applications, like capturing a part passing through a station in an assembly line,visits on a website etc. Transaction facts don’t tend to change alot, but history of a transaction can be capturedusing a ledger based approach where new versions of the fact are written to the fact table superseding olderversions. This requires careful handling in both the ETL and any client that consumes the data (including Cubesand Column stores).ACCUMULATING SNAPSHOT FACTAn accumulating snapshot fact captures multiple steps of business process within the one fact table. Usuallythe steps represent an entity proceeding through a series of know statuses. For example, a work item could gofrom proposed, to approved, to in progress, to complete. Accumulating snapshot fact measures usually includethe duration it takes to move between each step of the process and other measures of each step. Usually eachstep of the process involves updating a single existing record in the source system. The history of the fact iscaptured by capturing the date on which the fact changes to each status.PERIODIC SNAPSHOT FACTA periodic snapshot fact captures the aggregate or balance of a business process or event for a given period.Common examples are monthly financial account balances, monthly bank account balances etc. PeriodicDimodelo Solutions.Page 5Data Warehousing and Business Intelligence Concepts.
Snapshot fact tables are usually built from the data contained in a transaction fact table. They start with anopening balance (from the previous period) tally up the transactions for the current period and produce aclosing balance. However periodic snapshot fact tables may also represent aggregations (SUM, AVG etc) of aperiod. For example, at the end of each day, the rolling 12 month sum of Asset failure minutes. The fact is ahistorical snapshot as at a point in time.SLOWLY CHANGING DIMENSIONSDimensions are often referred to as ‘Slowly Changing Dimensions’. This describes the fact that dimensionsmembers are relatively static but do change, albeit slowly, over time. How this change is managed in the datawarehouse usually falls into 4 types. Type 1, Type 2, Type 3 and Type 6 (which is a hybrid of type 1 2 3). Themost common are type 1 and type 2. Different attributes within the one dimension can have different slowlychanging dimension types.SLOWLY CHANGING DIMENSION TYPE 1 - OVERWRITEWhen the Slowly changing dimension (SCD) type 1 is applied, if a change occurs to an attribute, the existingdimension member row is overwritten with the new value of the attribute. Essentially no history is kept. Agood example of a Type 1 Attribute is Employee Name. If an employee name changes due to marriage, theName should be overwritten. This has the effect of moving all history to the Employee’s new name. Thishighlights unanticipated consequences with type 1. Let’s say you have a Sales Division org unit dimension, andeach Sales Division has a parent Region attribute. If the Sales Division moves to a new Region, and the Regionattribute of the Sales Division is treated as type 1, then all the historical sales facts that were associated withthe original version would suddenly appear in Regional reports as if they belong to the new Region, usually, anundesirable outcome. This is where Type 2 comes in.SLOWLY CHANGING DIMENSION TYPE 2 – ADD A NEW VERSIONIn the SCD type 2 scenario, a new version of the Dimension member row is written when a Type 2 Attributechanges. History is preserved. Existing facts remain associated with the old version of the dimension memberand new data is associated with the new version of the dimension member. Let’s say you have a Sales Divisionorg unit dimension, and each Sales Division has a parent Region attribute. If the Sales Division moves to a newRegion, and the Region attribute of the Sales Division is treated as type 2, then a new row is written to thedimension for the new version of the dimension member. All the existing sales facts that were associated withthe old version would still appear in Regional reports as if they belong to the old Region, which is desirable,because this region was responsible for the sales at the time it was made. Only new facts that are associatedwith the Sales Division after the change will be associated with the new Region.ETL (EXTRACT TRANSFORM LOAD)ETL stands for Extract, Transform Load and refers to the process of extracting data from the Source systems,transforming it into the star schema format and loading it into the relational Data Warehouse. Development ofan ETL process (along with the Data Warehouse itself) is the major cost in delivering a Business IntelligenceSolution. Up to 80% of your cost will be in developing the Data Warehouse. Usually the ETL is run over night ina Batch process.EXTRACT AND STAGINGThe extract process pulls data from a source system, usually on a nightly basis. Source systems can includeDatabases, Text Files, Excel spread sheets, or any other kind of source data. The data is written to a StagingDimodelo Solutions.Page 6Data Warehousing and Business Intelligence Concepts.
database ready for transformation and loading into the Data Warehouse. It is necessary to stage data for anumber of reasons: Staging places less load on source systems. Extract procedures are keep as simple as possible. The nextstep, transformation, may require complex queries, that you don’t want to run on the source, missioncritical, system.If you are combining data from more than 1 source system, then you need to stage data from all thosesystems before you can combine the data in the transformation step.Staging gives the Data Warehouse the opportunity to implement its own change data capture anddata quality screening across source systems.Staging allows more rapid failure recovery, because the data does not need to be Extracted a secondtime on recovery.TRANSFORMATION AND LOADTransformation and Load is the process of transforming the data extracted from source systems into the starschema format, and loading it into the Data Warehouse. Data staged from multiple source systems iscombined. This along with the Star schema structure gives your organisation a ‘single version of the truth’.There are many techniques required to identify change and implement high performance data loading into thedata warehouse.BUILD CUBE/COLUMN STOREA Cube is defined as a Star Schema, and thus mimics the structure of the Data Warehouse closely. The processof building the cube involves simply executing a build command on the cube database. Usually the buildcommand drops the existing cube, pulls data from the data warehouse, and rebuilds the cube from scratch.There are other build options, which involve updating the cube, but this is only recommended when the facttable(s) is very large (billion rows).The cube adds user defined hierarchies (like Year - Month - Day), Calculated Measures (like Gross Margin %,12 Month Moving Avg etc ), Relative Periods (like This Year, Last Year, Last Quarter) and perspectives toenhance the analytical and reporting nature of the data.Dimodelo Solutions.Page 7Data Warehousing and Business Intelligence Concepts.
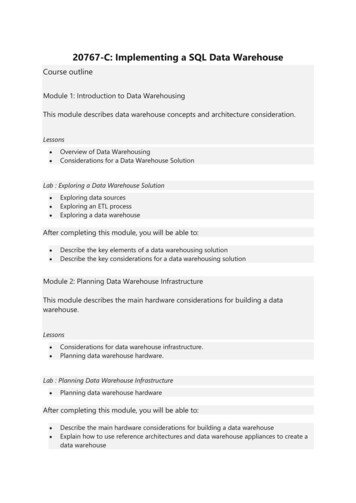
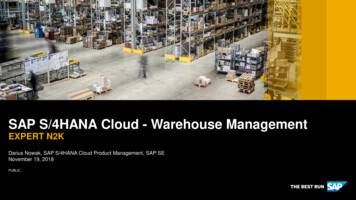
BUSINESS INTELLIGENCE AND DATA WAREHOUSING SOLUTION COMPONENTSThe diagram on the next pages shows the components of a full data warehousing and business intelligencesolution. The diagram is divided in 4 streams.1.2.3.4.The Component diagram.What you Buy.What you Build.What Tools you need.Note the distinction between Business Intelligence and Data Warehousing above and below the line.BI Artefacts: This document refers to BI Artefacts. A BI Artefact is any Report, Dashboard, Scorecard, or Ad-hocAnalysis that is delivered as part of a BI Application. Our diagram uses the Microsoft toolset to illustrate thetypes of BI Artefacts you might deliver.Dimodelo Solutions.Page 8Data Warehousing and Business Intelligence Concepts.
DataWarehouseautomationreplaces thesetoolsDimodelo Solutions.Page 9Data Warehousing and Business Intelligence Concepts.
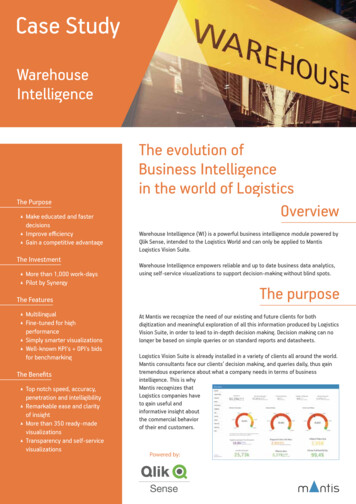
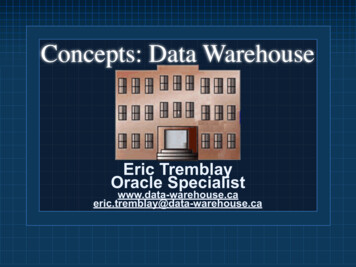
BUSINESS INTELLIGENCE APPLICATIONSBusiness Intelligence is an umbrella term which encompasses the processes, people and technology involved inbusiness decision making. It can be broken down into a number of distinct applications:PERFORMANCE MANAGEMENTPerformance Management complements a business’s Strategic Planning. Once the Strategic plan is defined,Performance Management is the act of monitoring progress of the business against the goals of the strategicplan, and adjusting course when necessary. Progress is defined as a set of Key Performance Indicators (KPIs).In Strategic planning, tools like Balanced Scorecards and Strategy maps are often utilized. In PerformanceManagement visualizations of the Scorecards and/or strategy maps defined in the Strategic Plan are produced,with KPI mapped to each goal. The progress and trend of each KPI is shown, with data being sourced from theCube.Example Strategy Map:Dimodelo Solutions.Page 10Data Warehousing and Business Intelligence Concepts.
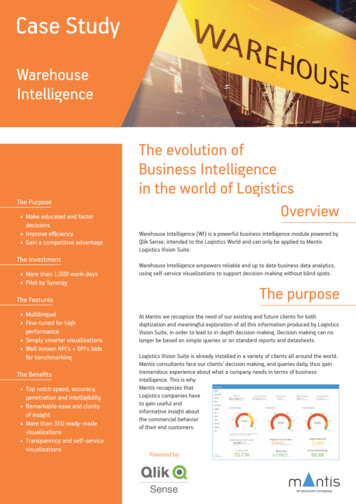
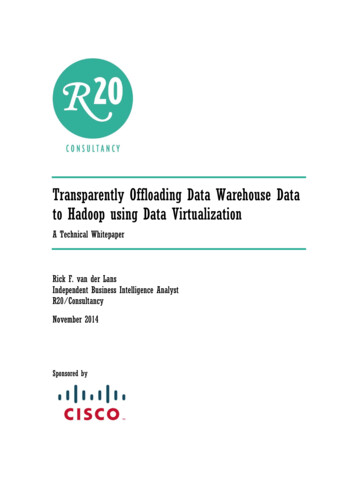
Example Scorecard:Example Dashboard:Dimodelo Solutions.Page 11Data Warehousing and Business Intelligence Concepts.
MANAGEMENT REPORTINGBusiness Analyst, Data Analysts and Managers of various departments/functions produce regular and uniformreports for Management. These reports often include a mix of data and commentary from the relevant Analyst.Performance Management and Management Reporting are related. Often a Manager will have a set of KPIs forwhich they are responsible. A report on these KPIs would be produced on a periodic basis. Ideally thesescorecards and management reports are linked, enabling ‘click through’ from a high level Scorecard to thedetailed report.Practically, Management Reports can take the form of: A Spreadsheet.A Word document. A Word document with embedded BI Artifacts is recommended wherecommentary is required.A Web Based report. Web based Management Reports can also be subscribed to by Managers, andemailed on a regular basis.A PowerPoint presentation.or a combination of these.AD HOC ANALYSISAd Hoc Analysis is the domain of the subject matter experts, engineers and analysts within an organization.These users find fixed reports too constraining and want the flexibility to ‘slice and dice’ the information asthey see fit, depending on the requirement at hand.It is exceptionally difficult to define requirements for this group up-front. The reality is that their requirementschange on a week to week basis.The role of a Data Warehouse is to support the analysis effort by providing easily accessible, integrated andwide reaching information across a data domain. Coupled with powerful presentation layer analysis tools, theAnalyst is equipped with the data and tools he needs to answer ad-hoc questions from management and dodeep analysis of identified problems.Typically an Analyst will use a tool (like Excel, Microsoft PowerView, Microsoft PowerPivot) to view thecontents of the Cube/Column Store, and drag and drop the attributes and measures they require onto a‘report’. The tool will often allow them to visualize the report as a graph, and make other enhancements asrequired.Although the output of most Ad Hoc analysis are meant to be run only once, in practice they often end upbeing reused and run on a regular basis. This is where the capability of uploading and managing reports in a BIportal comes into its own with analysts uploading and sharing their reports via the portal.The ad-hoc reports within the BI Portal should be reviewed periodically for efficiencies to determine whetherthey continue to serve a useful business purpose, and/or are candidates for more formal reporting processes.Dimodelo Solutions.Page 12Data Warehousing and Business Intelligence Concepts.
DATA MINING, PREDICTIVE ANALYSIS AND PLANNINGThere are a number of categories of predictive analysis: Planning and Forecasting. An example of planning and forecasting is financial budgeting. Otherexamples are sales forecasting or production forecasting. Planning and Forecasting will involve humaninput, and are the basis of many KPI targets. Typically these applications are implemented using thewrite back features of cubes.Projections. Projections use formulas based on past performance, and other factors, to predict thefuture. For example, future traffic volumes on a Route. Projections are typically implemented throughCalculated measures in Cubes/Column Stores.Data Mining. A technique used to find relationships in data that are not easily apparent. For examplemodeling the causality and impact of Traffic Jams based on incidents, Road works and trafficconditions. Again data mining requires a Cube, and advanced Presentation layer tools (like thoseincluded in Excel) to operate.TASK BASED REPORTINGA standard set of simple parameter driven reports can be produced by the IT department to support specifictasks performed on a regular basis as part of standard business processes.DATA WAREHOUSE COMPONENTSRDMS SERVERThe Data Warehouse is a relational Database, and thus, must be hosted on a Relational Database ManagementSystem (RDMS). Examples of an RDMS include IBM – DB2, Oracle, Microsoft SQL Server, My SQL.ETL SERVEROften the ETL Server and the RDMS are the same thing. Especially if you are relying on the power of thedatabase and SQL to implement the ETL. Depending on the technology you rely on, you may need a separateETL server to execute the ETL Batch process.CUBE/OLAP/MULTIDIMENSIONAL DATABASEA Cube is a data store and high performance aggregated query engine. A Cube is able to respond withexceptional performance to queries that would normally involve large, complex and slow aggregation (Sum,Max, Min, Avg etc) operations in a RDMS system. The primary purpose of the Cube is to be the query engine forBusiness Intelligence Applications. The Cube relies on the Data Warehouse to persist Historical data, and can bebuilt from scratch. The build process builds the Cube from data stored in the Data Warehouse. A Cube isdefined as a Star Schema, and thus mimics the structure of the Data Warehouse closely. A Cube can also bereferred to as an OLAP Database.A cube adds user defined hierarchies (like Year - Month - Day), Calculated Measures (like Gross Margin %, 12Month Moving Avg etc ), Relative Periods (like This Year, Last Year, Last Quarter) and perspectives to enhancethe analytical and reporting nature of the data.Dimodelo Solutions.Page 13Data Warehousing and Business Intelligence Concepts.
COLUMN STORE/ IN MEMORY/ TABULAR DATABASEA Column store database is, like a cube, a data store and high performance query engine. A column storedatabase can store data in a highly compressed way. A column store database is sometimes called an ‘inmemory’ database because the compression makes it possible to store all the data in memory. In fact it is a prerequisite of some implementations that the entire database fit into memory. Storing all data in memory, alongwith the way data is organised makes column store databases highly responsive. Column store databases arealso referred to as tabular databases.OLAP SERVEROLAP is an acronym for Online analytical processing. An OLAP server host Cubes/OLAP Databases. It may alsohost the Column store database, depending on implementation. An example of an OLAP Server is MicrosoftAnalysis Services (Shipped with Microsoft SQL Server).BI PORTALA BI Portal can taking many forms, depending on the software vendor you engage. Usually a BI Portal is webbased. The BI Portal is a publishing mechanism for BI Artefacts. BI artefacts (e.g. Reports, Excel etc) are hostedby the BI Portal and are made accessible to end users. Usually access control can be applied to eachsite/folder/artefact. Users would access BI Application artefacts through the BI Portal and, if sufficientpermission is granted, have the ability to upload and manage new reports they create.ABOUT ‘DIMODELO SOLUTIONS’‘Dimodelo Solutions’ is a Business Intelligence and Data Warehousing Consultancy and the creator of ‘DimodeloArchitect’ a Data Warehouse Automation tool which makes designing and building a Data Warehouse easierand faster.At Dimodelo Solutions, our approach is different. Using ‘Dimodelo Architect’ and an Agile developmentapproach we can build a data Warehouse in 1/3 the time it would normally take. We engage with the businessoften, provide hands-on demonstrations and guidance as we go, and garner feedback regularly.If you would like to speak to us about Dimodelo Architect or our Data Warehousing consultancy services pleaseemail contact@di
While a Data Warehouse is an extremely effective way of managing data for reporting and analysis purposes, it can be difficult to create. This is where Data Warehouse automation comes in. It makes building a Data Warehouse much easier and faster, and makes the data warehouse more flexible and capable of changing as business requirements change.