Transcription
Toward Understanding I/O Behaviorin HPC WorkflowsJakob Lüttgau† , Shane Snyder , Philip Carns , Justin M. Wozniak , Julian Kunkel‡ , Thomas Ludwig† ArgonneNational Laboratory (ANL), † German Climate Computing Center (DKRZ), ‡ University of Readingluettgau@dkrz.deAbstract—Scientific discovery increasingly depends on complexworkflows consisting of multiple phases and sometimes millions ofparallelizable tasks or pipelines. These workflows access storageresources for a variety of purposes, including preprocessing,simulation output, and postprocessing steps. Unfortunately, mostworkflow models focus on the scheduling and allocation of computational resources for tasks while the impact on storage systemsremains a secondary objective and an open research question. I/Operformance is not usually accounted for in workflow telemetryreported to users.In this paper, we present an approach to augment the I/Oefficiency of the individual tasks of workflows by combiningworkflow description frameworks with system I/O telemetry data.A conceptual architecture and a prototype implementation forHPC data center deployments are introduced. We also identifyand discuss challenges that will need to be addressed by workflowmanagement and monitoring systems for HPC in the future. Wedemonstrate how real-world applications and workflows couldbenefit from the approach, and we show how the approach helpscommunicate performance-tuning guidance to users.I. I NTRODUCTIONSupercomputing resources enable scientific discovery atan unprecedented pace. Scientists across domains employcomplex data-processing pipelines and workflows to automatethe evaluation of experiments and simulation results. Alongwith the execution of these workflows, huge amounts of dataneed to be handled by HPC I/O subsystems. Unfortunately,compute and storage performance capabilities are on divergenttrajectories. While compute capabilities scale relatively wellbecause of massive use of distributed computing and specialized compute hardware [1], storage systems trying to matchrequired performance characteristics are usually constrainedby a lack of suitable and affordable technologies, as well aslimited energy envelopes. In addition, storage systems tend tobe shared by multiple users, and they employ complex memoryhierarchies to balance cost and performance. The resultingsoftware to drive storage and memory stacks evolves slowly,and new approaches require time to prove that they are stableenough to be used in production.As exascale systems are about to become a reality, I/Obottlenecks are a growing concern that needs to be addressed.Overcoming the challenges raised requires changes throughout the storage stacks, and hence many research efforts areintegrated into larger codesign initiatives [2] [3] [4]. At thesame time, design decisions for large-scale storage systems areinfluenced by market forces, with future system architectures[5] trying to make use of commoditization and employing deepmemory hierarchies to conserve cost.The confluence of system complexity, application optimizations, and market forces lead to emergent I/O subsystembehavior that is often not well understood. Systems remainbelow theoretic peak performance since different usage patterns can have unforeseen side effects on the system. In orderto better understand this behavior, monitoring tools are beingdeveloped and deployed to allow systemwide monitoring inmodern HPC systems. Recent work has shown that the valueof I/O telemetry is greatly increased if it is analyzed in contextwith broader contextual information [6], though this type ofanalysis is generally performed only after the fact.An untapped potential for increasing our contextual understanding of I/O behavior exists by exploiting knowledgeabout the structure of HPC workflows. Since what is meantby HPC workflows is not always obvious, a definition usefulfrom a storage perspective is offered in Section II-A. Thatworkflow knowledge is not routinely considered by decisioncomponents across the storage stack can be attributed to anumber of factors. On the one hand, monitoring and telemetryinformation are not always collected. On the other hand, application developers lack incentive to switch to workflow tools,especially when workflow models might impose constraintson or add additional effort to a project.In a mid- to long-term perspective, however, users specifying their workflows help enable a number of on-going researchefforts. With a workflow description one can more easilyassociate monitoring and telemetry data with the workflow.More distant is the integration of this information into resourceallocation and scheduling systems. Data about how workflowsutilize the storage systems will eventually help develop andtrain adaptive and more intelligent systems.In this paper we present an approach to attribute I/O activityto task and data objects in HPC workflows. Our contributionsare as follows:1) An architecture proposal for a holistic association of I/Oactivity with task and data of scientific workflows2) A prototype implementation to demonstrate the potentialof an independent set of tools to work with differentworkflow management systems3) Tools for analysis and visualization of workflows for I/Oresearchers as well as for communication with users ofsupercomputing resources.
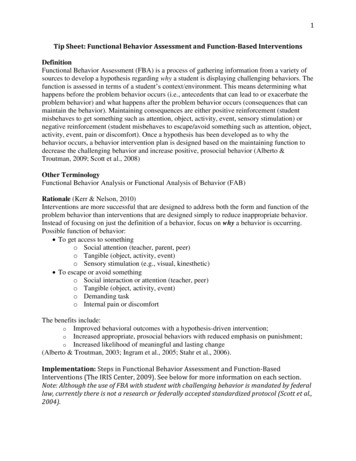
The remainder of the paper is structured as follows. Section II introduces related work and background on workflows,monitoring, and I/O. Standing challenges and an architecturenecessary to address them are proposed in Section III. InSection IV an overview of the proof of concept implementationis presented. Section V discusses two use cases to utilizeinsight on workflow I/O in adaptive systems. Section VIconcludes the paper with a summary and provides an outlookon future work.II. BACKGROUND & R ELATED W ORKThis section introduces background information on stateof-the-art solutions to I/O activity capture and monitoring(Section II-D). The section includes a workflow definitionuseful for HPC workflows that need to make use of largescale storage systems and parallel file systems in particular(Section II-A).A. I/O Perspective on Scientific WorkflowsScientists commonly perform experiments on supercomputers using some notion of a workflow. Often, these workflowsmay not be explicitly specified in a form easily accessible tomachines but instead are presented as a high-level descriptionin a project proposal or as sets of scripts used by researchers.For complex workflows, especially when repeated many times,researchers are more likely to opt for workflow managementsystems (WMS) or workflow engines. A workflow management system provides and implements a task or data modelrequiring users to merely define the relationships, while theworkflow engine executes the workflow with potential to transparently optimize resource utilization. Besides convenience forusers, workflows offer opportunities to better anticipate futureactivity, including activity that will affect storage systems.As no consistent universal definition for workflows holdsover time and across different fields, this section briefly offersa definition that aims to be useful for workflows in HPCenvironments with storage systems in mind. To an extent,the definition leans on typical HPC workflows identified andpublished in an APEX whitepaper on workflows [7]. Theperspective on how scientific workflows are expected to evolvefor next-generation workflows and systems is supported by [8].Most commonly, a workflow describes a number of tasksthat should be performed to achieve a higher-level goal. Tasksusually will consume or yield a piece of data, which in manycases leads to an order in which tasks need to executed. Alsoworth considering are pipelines, since one commonly sees thesame series of steps being performed on different input data,which in many cases give rise to parallel execution.a) Task: A task is a logical entity or a program that canconsume and/or produce data. Granularity may vary dependingon the abstraction used by different workflow engines, with asingle task potentially mapping to to a job, a process, a thread,or even a function call.b) Data: Data comprises information that is retained orpassed between tasks. Depending on the lifetime, data can bemessages, database entries, or files and objects on a storageForeverLong-Term ArchiveTapeInitialInput put DeckInitialStateTemporaryWorking SetBurst etJobSimulateBegin sualize(a) Stereotypical simulation workflow (see APEX Workflows [7])ForeverLong-Term oraryWorking SetBurst ysisData SetsAnalysisData SetsFile-basedComm.HTC Analysis or UQ Simulation.Generate and/orGather Input DataAnalysisUQ Science PipelineHTC Science Pipeline(b) Stereotypical HQ/HTC workflow (see APEX Workflows [7])ForeverLong-Term ArchiveTapeSharedInputPrivateInputAnalysisData setTemporaryWorking SetBurst BufferIn situWorkflowCheckpointDumpGenerate and/orGather Input DataSimulationHTC or uctsVisualisationAnalysis(c) Approximation of an in situ workflowFig. 1: Abstractions of predominant existing and envisionedworkflows in HPC environments according to [7] and [8]. Theabstracted simulation, UQ, and HTC workflows are derivedfrom [7]. In situ workflows are anticipated but not widelyspread at this time as frameworks are in their early stages andadapting existing applications is not always straightforward.system. The granularity of data objects varies considerablybetween different workflow engines. Many workflow enginesuse notions of data sets in a hierarchical namespace, whileothers directly assume the presence of file systems. In someextreme cases, workflow engines might consider individualvariables as small as a single byte or integer as data objects.c) Workflow: A workflow governs the dependencies oftasks and data and is often represented by using a graph,with nodes being used to model tasks while edges representdependencies. In many cases this representation will result ina directed acyclic graph (DAG), although complex workflowsmay contain cycles. Also, considering I/O activity in such agraph can lead to situations where data is being read and
written in ways that turn an acyclic task dependency graphinto a cyclic task/data dependency graph. Implementationlogic of tasks is often strictly separated (e.g., a binary) fromthe declaration of relationships, while fine-grained workflowengines seem to favor workflow definitions that allow mixingthe two.d) Pipeline: Some workflows feature a repeated chain ofsteps (which might include branching). If a workflow starts thissame chain of steps, we refer to it as a pipeline. For example,depending on an input set for the workflow, every element inan array might require processing as an instance of a pipeline.B. Common HPC WorkflowsIn order to address challenges of current and future workflows, this section introduces workflows commonly observed[7] in HPC environments. An outlook on anticipated workflows and recognized challenges that WMS will need to address before they are suitable for widespread adoption in HPCenvironments is provided by [8]. To a large extent, workflowsdepend on the facilities, instruments, hardware, and servicesscientists find in their respective institutions. Workflows canspan different timespans from minutes up to years dependingon their alignment to a given project. Nonetheless, a numberof common patterns for workflows on HPC have emerged.a) Simulation: Simulation workflows tend to consist of3–4 major phases. An illustration of a stereotypical simulation workflow is given in Figure 1a. In the preprocessingphase, input data needs to be transformed into an initialstate for the simulation. In the simulation/data generationphase, applications write snapshots and timestep data for faulttolerance, postprocessing applications, and potential archival.The postprocessing and visualization phases are deriving dataproducts that in many cases may be published and preserved.A simulation workflow as outlined here might be part of thepipeline of other more data-intensive workflows.b) Uncertainty Quantification: To deal with uncertaintywhen working with nonlinear or chaotic systems (as in manyphysical simulations), researchers commonly design workflows for uncertainty quantification (UQ). An illustration ofa stereotypical UQ workflow is given in Figure 1b. Suchworkflows often consist of a large number of independentpipelines (typically with simulations running for multiplehours) that can be executed in parallel. Results from theseparallel executions (often called ensembles) are then combinedinto analysis data sets.c) High-Throughput Computing: Similar to UQ workflows are high-throughput computing (HTC) workflows, againillustrated in Figure 1b. In HTC a large number of pipelinesare executed, but typically featuring tasks only of limitedruntime/data volume. Often the objective is to explore a parameter space, for example, to find hyper-parameters in machinelearning applications. From a storage system perspective, highthroughput computing is often associated with many relativelysmall files.d) In Situ / Integrated Approaches: In situ workflows integrate their numerous distinct phases into a single application.Traditionally, these types of workflows have been implementedin the context of MPI. An illustration of a possible in situworkflow is given in Figure 1c. Such workflows allow forconservation of resources by exploiting data locality and avoiding overheads from resource allocation, context switching,and application startup/shutdown. As far as storage systemsare concerned, the requirement to occasionally consume largeamounts of snapshot data remains; but overall in situ workloads promise to reduce the load across network and storagesystems.e) Hybrid Approaches: Workflows will continue toevolve, and in many cases scientists will mix workflow modelsthat are not easily integrated or solved by a single solution.Since collaborations in projects often span multiple locationsand organizations, one must assume that different workflowtools being used even within a single project. Consequently,tools to analyze workflows should address this heterogeneity,for example by offering abstractions and modularity to integrate other tools and WMS with reasonable effort.C. Workflow Engines for Automation in HPC EnvironmentsTABLE I: Workflow Management Systems for HPCWorkflow EngineSwift/T [9], [10]Cylc [11]Apache Spark [12]Fireworks [13]Pegasus [14]TaskFarmer [15]Tigres [16]Ophidea [17]Kepler [18]ModesJob/Runtime(Dist.) JobsRuntimeDistributed(Dist.) JobsCommandsRuntimeRuntimeRuntimeData 5)/(3): Restrictions Apply, -: No documentation foundDSL: Domain Specific Language, RDD: Resilient Distributed DatasetsAs scientists continue to add complexity to their workflowsand strive for reproducible scientific results, they demandmore elaborate tools and frameworks that can automate theexecution of workflows. Workflow management systems havegained considerable popularity with an increase in big dataapplications and have also become increasingly popular withusers in the HPC community. Since some of the tools popularin a big data context are challenging to deploy in HPC systems,a number of WMS designed specifically for use on HPCsystems are available and under active development. To anextent, this fragmentation can be attributed to the slightlydifferent priorities from one scientific domain to another.Table I provides an overview of HPC WMS as well as acomparison of features relevant to an I/O perspective. Inparticular, since this work introduces tools to visualize I/Oactivity of workflows, we indicate whether WMS providegraphical representations to inspect or even edit workflows.Tools for visualization are provided by Cylc [11], Fireworks[13], Ophidea [17], Kepler [18], and Pegasus [14]. Kepler [18]is notable because an interactive graphical user interface isprovided that also allows direct inspection of results. Cylc[11] uses the dot format to visualize workflows, which allowsfor easy customization.
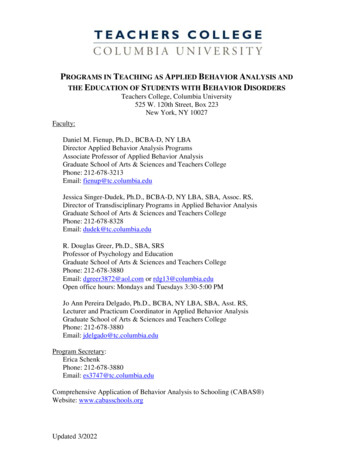
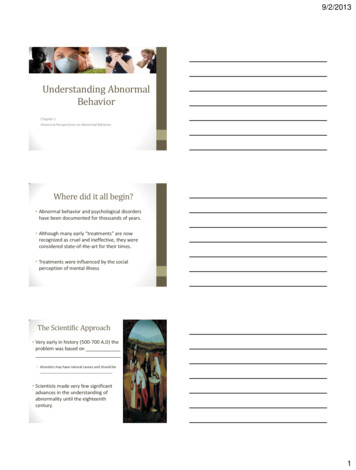
D. Holistic I/O MonitoringIn this section we introduce four building blocks thatassist in capturing a comprehensive picture of I/O activitythroughout a data center. Darshan provides the means tocapture I/O activity from an application’s perspective. Manystorage subsystems additionally provide their own, sometimesproprietary, mechanisms to query backend I/O monitoringdata. TOKIO collects this data from Darshan and other relevantI/O subsystems and combines it for further analysis.a) Darshan: Darshan captures I/O activity related to theapplication and I/O library layers in an HPC stack. In particular, Darshan can instrument many I/O interfaces (POSIX,STDIO) and libraries (such as MPI, HDF5) and can collect andaggregate its own I/O-related performance counters. Figure 2ApplicationDarshan-RuntimeFor the prototype implementation of our workflow analysistools, we started with support for two workflow engines thatreside at two ends of the spectrum for workflow granularity.Swift/T implements a fine-grained and integrated approach toworkflows that is anticipated to be increasingly relevant asapplications strive to exploit exascale systems. Cylc followsa more traditional and distributed workflow approach and assumes the submission of jobs to batch scheduling systems. Asexplained in Section II-B, we anticipate that both models willremain relevant, and we therefore pursue an abstraction thataccommodates both. The following two paragraphs provide amore in-depth description of Swift and Cylc.a) Swift/T: Swift provides a domain-specific languagewith many features of a generic programming language tospecify workflows. Swift has two different runtimes to interpret and execute a workflow description: Swift/K [19] andSwift/T [9], [10]. In this work we focused on the morerecent runtime called Swift/T (for the Turbine runtime [20])geared toward supporting exascale workloads. The Turbineruntime implements a highly integrated workflow model thatlaunches itself a single, large MPI application and optionallydedicates communicators to subtasks. This approach may alsobe especially interesting for applications considering use ofin situ techniques [21].Swift/K, on the other hand, provides a runtime similarto that of Cylc, adopting a model of job-based workflowspotentially distributed across multiple sites. In the languageshared by Swift/K and Swift/T, the data model can becomevery fine-grained, with data objects potentially as small assingle integers. Each Swift variable is a future, and tasks arerepresented as Swift functions that block on their inputs.b) Cylc: Cylc implements a distributed workflow model,with data generation and postprocessing and preprocessingpotentially being executed on different sites and consistingof multiple jobs. Hence, Cylc also allows the collection ofresults from multiple compute sites. In Cylc, users define adirected dependency graph of tasks, as well as data objects thatare passed between tasks. Cylc provides an easy mechanismto export a graphical representation of the workflow in dotformat. Cylc is used mostly in the context of climate andweather applications.Other LibrariesData Description Framework(HDF5, NetCDF, .)MPISTDIOPOSIXOperating SystemLogical Volume Managment (LVM)Interface/Device DriversNode Local Storage(HDD, SSD, BurstBufferHPC Storage(PFS, Object, .)ArchiveFig. 2: With Darshan one can collect I/O-related activity onthe application and library levels without requiring specialprivileges. The dotted lines to STDIO, POSIX, MPI, andHDF5 depict some instrumentation supported with Darshanby default, but users can define additional wrappers for otherlibraries as well. Recorded log data is stored into log filesbefore a group of MPI processes terminates.illustrates at which levels Darshan is able to collect I/O activitywithin a system stack. Darshan with extended tracing support(DXT) [22] also enables the collection of full I/O tracesup to a configurable size. In many cases, instrumenting anapplication is as easy as using LD PRELOAD to interposeDarshan’s instrumentation library between the application andits I/O libraries. This approach can be used by all users withoutrequiring special privileges.b) System-Level Monitoring/Vendor APIs: I/O monitoring data is generally not accessible by all users, and forproprietary systems internal performance counters may notbe exposed even to site operators. Many modern systems,however, do offer APIs to query different system statistics oreven provide event hooks for more sophisticated actions.c) TOKIO: The TOKIO (Total Knowledge of I/O) framework [23] brings together monitoring information from multiple sources throughout the data center, as illustrated in Figure 3. This framework includes access to privileged monitoringinformation from I/O subsystems and vendor APIs, but it alsomakes use of application data collected by using Darshan. Bycontinuously monitoring a data center over time, one can, forexample, detect performance regressions [24]. TOKIO alsooffers tools to analyze and aggregate collected log records.d) Telemetry Support in Workflow Engines: Collectionor integration of telemetry information is also built into someworkflow engines, although I/O performance is not addressed
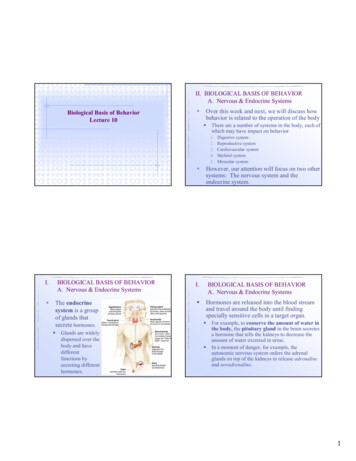
ArchiveTelemetry/MonitoringPFS/Object State LookupsVendor APIsHDD/SSD Storage(PFS, Object, .)TOKIODarshan ��erComputeTOKIO DataWarehouseDarshanFig. 3: TOKIO takes a holistic approach to I/O activity capturethroughout the data center. To do so, TOKIO collects data fromdifferent data sources, such as system and service logs, vendorAPIs, PFS monitoring tools, and Darshan log files.specifically. The Tigres WMS [25], for example, features amonitoring API to log events. Tigres also was evaluated foruse with I/O-intensive workflows, but a facility within theworkflow engine to capture I/O behavior is missing. Cylc[11] monitors jobs and keeps track of output files even acrossmultiple sites. Fireworks [13] has a tracking feature for filesto check whether a file has enough output lines. Ophidea [17]captures walltime and other statistics for workflows. Swift/Kallows for external monitoring via the web browser, a JavaSwing tool, or an ANSI text user interface. Swift/T usesoptional text or more scalable MPE logging [26].External tools and dashboards have also been developed tomonitor workflows or WMS. Grafana dashboards, for example,have been created [27] to monitor Spark.III. D ESIGN C HALLENGESWith the background on HPC workflows and I/O activitycapture established, this section introduces design challengesfor an architecture to gather, analyze, and present the I/Obehavior of workflows. The main motivation for the tools introduced here is to gain insights useful for operating decisionsand system design. Because addressing identified problems oroptimization opportunities usually requires coordination withusers and application developers, the tools also aim to providemore intuitive means of communication. We achieve this byassociating I/O-related observations for different subsystems,which regular users may even be unaware of, with the processes that users can relate to since the processes are partof the workflows. The information collected by these tools isexpected to become a valuable input source for the realizationof smarter systems (see Section III-B). A potential integrationwith resource management and I/O-related middleware in thefuture is discussed in Section V-A and Section V-B.To be useful in the HPC context, the architecture has tosupport multiple WMS because communities use differenttools. The architecture also has to take into account thatsupercomputing sites can vary significantly, as evidenced in avariety of different scheduling systems, storage systems, andsoftware environments with a wide range of versions for aspecific software tool or library.To address these requirements, we adopted a modular approach, with a first iteration of the prototype being designedwith three user perspectives in mind:1) I/O researchers: Expect a flexible environment to exploreanalysis data; for large amounts of log data, interactiveelements will be helpful2) Site operators: Expect a toolbox that can be customizedto fit the needs of the data center or individual subsystems3) Application scientists: Expect a report that can be relatedto the processing steps performed in their applicationsand workflowsA first architecture for comprehensive I/O analysis of HPCworkflows is depicted in Figure 4. Workflows can be definedimplicitly or explicitly. Finding implicit workflows, as faras I/O is concerned, presents researchers with challenges. Itseems reasonable, however, that at least parts of workflowscan be discovered from log data and I/O activity records thatmight be used to improve system performance.For users who use workflow engines (e.g., Swift, Cylc) thereexists an explicit description of the workflow, which usuallywill be a directed acyclic graph of tasks and data objects.A WMS should offer a easy mechanism to export the DAGfor visualization and other tasks; and, in fact, some do providemechanisms for exporting the DAG (e.g., in dot format). In anycase, we assume that one can often obtain a dependency graph.We then assume helper utilities supporting different WMS thattransform the dependency graph into a preliminary workflowreport that can then be populated with I/O activity records andannotations.{nodes: [{type: "task", .}, {type: "file", .}],edges: [.],# tasks/data dependenciesreports: {tasks: [.],# task reportsfiles: [.],# file reports. },annotations: [.] # e.g., advice}Fig. 5: Structure of a workflow report featuring (1) theworkflow dependency graph of tasks, files, and edges for theirrelationships; (2) reports associated with different elements ofthe workflow; and (3) annotations and advice also for differentelements of the workflow.
I/O ResearcherArchiveTelemetry/MonitoringPFS/Object State LookupsVendor APIsSite OperatorsTOKIO DataWarehouseHDD/SSD Storage(PFS, Object, .)TOKIOLoad related logsDarshan UtilsInteractiveDashboardDarshan WorkflowHelpers to extract DAGfor Tasks, Data, �erComputeAnalysis ScriptsJupyter NotebooksCustom ToolsMachine LearningDeveloper/Scientistswift-tcylcKnowledge Base forGeneral/Site-SpecificExpert Systemother WMSDarshanExecute w/o WF EngineProjects with implicit or explicit workflows maintened by applications scientists and developers.Fig. 4: Architecture overview to augment I/O behavior in HPC workflows by pulling in information from workflow enginesand I/O activity capturing tools. Integration with TOKIO and expert systems is not yet implemented in the proof of conceptintroduced in Section IV as indicated by the dashed arrows. Thin dotted lines represent (optional) information sources.The general structure of such a workflow report is illustratedin Figure 5. The report JSON provides expected fields for theworkflow dependency graph (nodes, edges). The nodesfield typically will hold tasks (e.g., jobs) or data objects (e.g.,files). The reports field currently assumes referenced orinlined Darshan reports. Since Darshan reports can be brokenup, for example into reports per file accessed (many differentcriteria can be used to aggregate the individual performancecounters), the reports field also distinguishes between tasksand files.For batch scheduling workflow engines, a task usuallycorresponds to a job on an HPC system, for which Darshanwill record log files when an MPI application is invoked. Theannotations field is used to allow experts to add adviceeither manually or, potentially, automatically using machinelearning models.A. Associating Tasks and Data Objects with TelemetryThis section covers some challenges related to the association of workflow tasks with recorded I/O activity. The firstchallenge is to find a suitable mapping between our abstractionfor tasks and data objects and the notion used by the WMS.A second challenge is to identify and store cues about howtasks/data and log records relate to each other.Unfortunately, mechanisms for automatic or transparentassociation are not widely supported by workflow enginesand monitoring tools. Multiple mechanisms do exist, however,to perform logdata/telemetry association are possible. Thefollowing are two approaches that can be realized withoutrequiring extensive changes to existing monitoring solutionsand workflow engines.Naming conventions so that, for example, execution binaries and tasks match. Obviously, this is a fragile approachand may occasionally fail or pull in unrelated information. Exporting the name of the current task into an environment variable. This is the preferred method to workwith Darshan, but it has limitations when working withworkflows that execute multiple tasks within a single MPIexecution.For more integrated approaches such as followed by Swift/T(see Section II-C0a), logging granularity of MPI executions orat the job level is usually not meaningful anymore. In the caseof Swift/T, for example, a single MPI-based runtime is startedthat uses MPI communicators to grant compute resourcesto tasks under the assumption that tasks are defined in away that honors the provided communicator. Darshan at themoment captures this activity; however, it does not maintainindividu
activity with task and data of scientific workflows 2)A prototype implementation to demonstrate the potential of an independent set of tools to work with different workflow management systems 3)Tools for analysis and visualization of workflows for I/O researchers as well as for communication with users of supercomputing resources.