Transcription
OCTOBER 2020CO2 EMISSIONSFROM COMMERCIAL AVIATION2013, 2018, AND 2019BRANDON GRAVER, PH.D., DAN RUTHERFORD, PH.D., AND SOLA ZHENG
ACKNOWLEDGMENTSThe authors thank Jennifer Callahan and Dale Hall (ICCT), Tim Johnson (AviationEnvironment Federation), and Andrew Murphy (Transport & Environment) for theirreview. This work was conducted with generous support from the Aspen GlobalChange Institute.SUPPLEMENTAL DATAAdditional country-specific operations and CO2 emissions data for 2013, 2018, and 2019can be found on the ICCT website.International Council on Clean Transportation1500 K Street NW, Suite 650,Washington, DC 20005communications@theicct.org www.theicct.org @TheICCT 2020 International Council on Clean Transportation
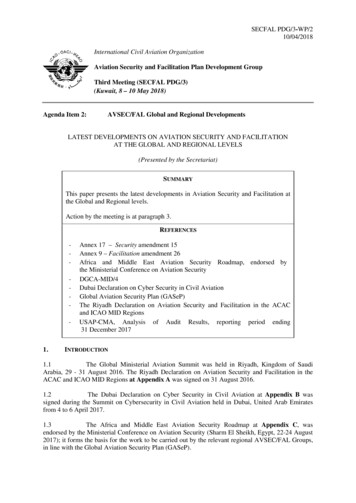
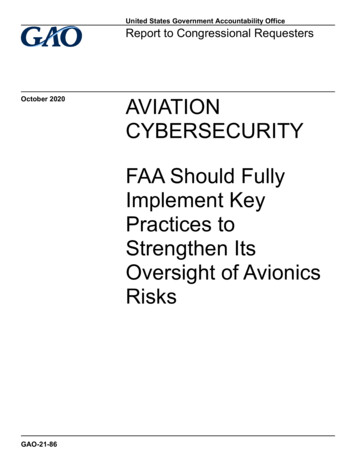
EXECUTIVE SUMMARYLast year, the International Council on Clean Transportation (ICCT) developed abottom-up, global aviation inventory to better understand carbon dioxide (CO2)emissions from commercial aviation in 2018. This report updates the operations andemissions analyses for calendar year 2018 based on improved source data, and includesnew analyses for 2013 and 2019. In 2013, the International Civil Aviation Organization(ICAO) requested its technical experts develop a global CO2 emissions standard foraircraft, and states began to submit voluntary action plans to reduce CO2 emissionsfrom aviation.This paper details a global, transparent, and geographically allocated CO2 inventoryfor three years of commercial aviation, using operations data from OAG AviationWorldwide Limited, ICAO, individual airlines, and the Piano aircraft emissionsmodeling software. Our Global Aviation Carbon Assessment (GACA) model estimatedCO2 emissions from global passenger and cargo operations on par with totalsreported by industry (Figure ES-1). In all three analyzed years, passenger flights wereresponsible for approximately 85% of commercial aviation CO2 emissions. In 2019,this amounted to 785 million tonnes (Mt) of CO2 . Between 2013 and 2019, passengertransport-related CO2 emissions increased 33%. Over the same period, the number offlight departures increased 22% and revenue passenger kilometers (RPKs) increased50%. This means that passenger air traffic increased nearly four times faster than fuelefficiency improved.Passenger: NarrowbodyBelly cargo1,000Passenger: WidebodyDedicated freighter900CO2 emissions [Mt]800700600615351500400Passenger: 0300200100028220132014201520162017Figure ES-1. CO2 emissions by operations and aircraft class in the three analyzed years.The top five departure countries for passenger aviation-related carbon emissions in2019 are the United States, China, the United Kingdom, Japan, and Germany. Flightsdeparting airports in the United States and its territories emitted 23% of globalpassenger transport-related CO2 in 2019, two-thirds of which came from domesticflights. Collectively, the 28 members of the European Union (EU) were second behindthe United States, having emitted 19% of the global passenger transport total. Whenadding China’s 13%, these three largest markets were responsible for more than half ofall passenger CO2 emitted in 2019.ICAO divides the world into six statistical regions. Flights within its Asia/Pacific regionemitted the largest share of passenger transport-related CO2 in 2013, 2018, and 2019.This region accounted for 22% of the global total in 2013, and that increased to 25%in 2018 and 2019. Four out of the top 10 departure countries with the most aviationemissions—China, Japan, India, and Australia—are located in the Asia/Pacific region.Intra-North America flights emitted 16% of global passenger CO2 emissions in 2019,iICCT REPORT CO2 EMISSIONS FROM COMMERCIAL AVIATION: 2013, 2018, AND 2019
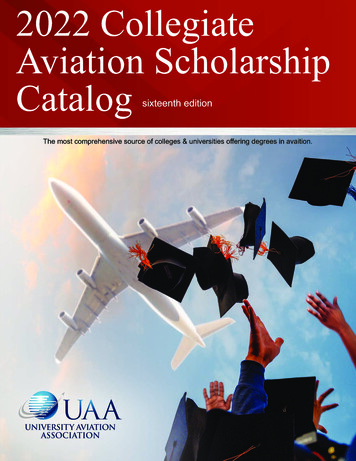
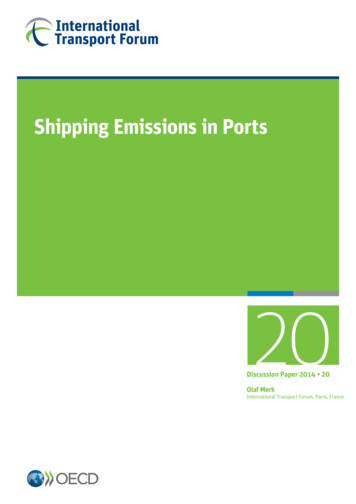
down from nearly 19% in 2013. Flights within Europe, between both EU and non-EUcountries, emitted 14% of the global total in 2019, up from 13% in 2013.Regarding aircraft class, we found that more than 60% of all passenger flights wereoperated on narrowbody aircraft in 2019, and these accounted for more than half ofall RPKs and passenger CO2 emissions. On average, global passenger aircraft emitted90 g CO2 per RPK in 2019. That is 2% lower than in 2018, and 12% lower than in 2013.Smaller regional aircraft that are used on shorter flights emitted nearly 80% more CO2per RPK than the global average for all aircraft. Newer aircraft types like the AirbusA320neo (narrowbody) and Boeing 787-9 (widebody) emit between 30% and 50% lessCO2 per RPK than the most inefficient legacy aircraft.For the first time, we estimate both absolute emissions and carbon intensity perpassenger by both seating class and aircraft class. Premium seating, which is first classand business class, takes up more floor area on an airplane than economy seatingand thus can be apportioned a larger share of the fuel burn. In 2019, 179 Mt of CO2emissions, or nearly 20% of emissions from commercial aviation, came from passengersin premium seating classes (Figure ES-2). This is more than the emissions associatedwith the transport of both belly and dedicated freight. Depending on aircraft class,premium seating was found to emit between 2.6 and 4.3 times more CO2 per RPK thaneconomy seating. Traveling in widebody economy class was found to have the lowestaverage carbon intensity at about 65 g CO2 per rrowbodyeconomy37%Widebodyeconomy24%Figure ES-2. CO2 emissions by operations and aircraft seating class, 2019This work has three main implications. First, as the United States is both the largestaviation market and a particularly carbon-intensive one in terms of CO2 per RPK,it should adopt legally binding policies that require additional action to reducegreenhouse gases (GHGs) from aircraft as soon as possible. Second, the significantdifferences in the carbon intensity of flights strengthens the case for greater emissionsdisclosure to consumers. Third, efforts to better price carbon emissions from aviation,for example graduating carbon price based upon seating class and distance, could helpaddress both climate change and equity concerns.iiICCT REPORT CO2 EMISSIONS FROM COMMERCIAL AVIATION: 2013, 2018, AND 2019
TABLE OF CONTENTSExecutive summary. iAbbreviations. ivConversion factors. iv1Introduction and background.12 Methods. 32.1 Airline operations database. 32.2 Global airports database. 32.3 Payload estimation. 32.4 Fuel burn modeling and CO2 estimation.42.5 Seating class allocation.42.6 Validation. 53 Results and discussion. 63.1 Total global operations and CO2 emissions.63.2 CO2 from passenger transport. 73.3 Passenger CO2 emissions and intensity by aircraft class. 153.4 Passenger CO2 emissions and intensity by stage length. 183.5 Passenger CO2 emissions and intensity by seating class. 204 Conclusion and policy implications.23References.26Appendix: ICAO statistical regions.28iiiICCT REPORT CO2 EMISSIONS FROM COMMERCIAL AVIATION: 2013, 2018, AND 2019
ABBREVIATIONSASKavailable seat kilometerASMavailable seat mileCO2carbon dioxideCTKcargo tonne kilometerggramsGCDgreat circle distanceGHGgreenhouse gasIATAInternational Air Transport AssociationICAOInternational Civil Aviation OrganizationkgkilogramskmkilometersMtmegatonne (million tonnes)RPKrevenue passenger kilometerRTKrevenue tonne kilometerCONVERSION FACTORS1 tonne 1.1023 short tons1 kilometer 0.6214 miles1 tonne-kilometer 0.6849 ton-miles1 gallon of jet fuel 3.785 liters of jet fuel1 liter of jet fuel 0.8 kilograms of jet fuel1 kilogram of jet fuel consumed 3.16 kilograms of carbon dioxide emissions1 airline seat 50 kilograms1 passenger and checked luggage 100 kilogramsivICCT REPORT CO2 EMISSIONS FROM COMMERCIAL AVIATION: 2013, 2018, AND 2019
LIST OF TABLESTable 1. Industry average allocation of passenger space by aircraft and seating class. 5Table 2. Passenger CO2 emissions by regional route group, 2013, 2018, and 2019. 8Table 3. Passenger CO2 intensity by regional route group, 2013, 2018, and 2019. 9Table 4. Passenger CO2 emissions in 2019 – top 10 departure countries. 10Table 5. Passenger CO2 emissions from international operations in 2019 –top 10 departure countries. 12Table 6. Passenger CO2 emissions from domestic operations in 2019 –top 10 departure countries.14Table 7. Passenger CO2 emissions and intensity by aircraft class,2013, 2018, and 2019.15Table 8. Passenger CO2 emissions from the top 10 regional aircraft types,ranked by total emissions, in 2013, 2018, and 2019.16Table 9. Passenger CO2 emissions from the top 10 narrowbody aircraft type,ranked by total emissions, in 2013, 2018, and 2019. 17Table 10. Passenger CO2 emissions from the top 10 widebody aircraft types,ranked by total emissions, in 2013, 2018, and 2019.18LIST OF FIGURESFigure ES-1. CO2 emissions by operations and aircraft class in thethree analyzed years. iFigure ES-2. CO2 emissions by operations and aircraft seating class, 2019. iiFigure 1. CO2 emissions by operations and aircraft class, 2013, 2018, and 2019.6Figure 2. Passenger operations and emissions, 2013, 2018, and 2019. 7Figure 3. Passenger CO2 emissions in 2019 – top 10 departure airports. 11Figure 4. Passenger CO2 emissions from international operations in 2019 –top 10 departure airports. 13Figure 5. Passenger CO2 emissions from domestic operations in 2019 –top 10 departure airports. 14Figure 6. Passenger CO2 intensity of the 10 highest emitting regional aircrafttypes, 2013 and 2019. 16Figure 7. Passenger CO2 intensity of the top 10 highest emitting narrowbodyaircraft types, 2013 and 2019.17Figure 8. Passenger CO2 intensity of the top 10 highest emitting widebodyaircraft types in 2013 and 2019. 18Figure 9. Share of passenger CO2 emissions in 2019, by stage length andaircraft class. 19Figure 10. Passenger CO2 intensity in 2019, by stage length and aircraft class. 20Figure 11. CO2 emissions by operations and aircraft seating class, 2019. 21Figure 12. Passenger CO2 intensity in 2019, by seating class. 22vICCT REPORT CO2 EMISSIONS FROM COMMERCIAL AVIATION: 2013, 2018, AND 2019
1INTRODUCTION AND BACKGROUNDAviation emissions are of increasing concern to governments, policymakers, and theflying public. From 2013 to 2018, carbon dioxide (CO2) emissions from commercialaviation increased about 70% faster than United Nations projections (Graver, Zhang,& Rutherford, 2019), and they were recently on track to triple by 2050, which meansthey could account for one-quarter of CO2 emissions from all sectors by then. Withthe “flying shame” movement and the recent court ruling that the United Kingdomgovernment’s support for expansion at London Heathrow Airport was unlawful onclimate grounds (Carrington, 2020), interest in and concerns about greenhouse gas(GHG) emissions from aircraft are at an all-time high.At the same time, detailed data on aviation emissions remain scarce. While theInternational Air Transport Association (IATA) releases annual estimates of aviationCO2 emissions at the global level (IATA, 2020), limited information is available at thelevel of markets, nations, geography (international vs. domestic), and stage length. InSeptember 2019, the International Council on Clean Transportation (ICCT) releasedsuch data for calendar year 2018 (Graver et al., 2019), but data on a single year doesnot allow for analysis of trends over time. This study aims to address that gap, andintroduces several new ways to understand aviation emissions.One of these relates to premium seating, or seats in first and business class. Theseseats can be apportioned a larger share of fuel burn, mostly because they take upmore floor area on the plane, and thus are more CO2 intensive per RPK than economyseats (Bofinger & Strand, 2013). While it is understood that premium seating is alarger portion of the total seating in certain markets (Graver, 2018), there have not yetbeen any attempts to make an assessment of the share of global commercial aviationemissions from premium seating. This paper addresses that gap.Also, 2019 was a year during which when an increasing number of in-service aircraftwere next generation, “re-engined” aircraft. This trend dates back to January 2016 withthe arrival of the Airbus A320neo. Indeed, a growing number of aircraft delivered todayare equipped with significantly improved engines, either advanced high bypass ratio orgeared-turbofan engines. Additionally, 2019 saw the second of two high-profile crashesof Boeing’s 737 MAX family. These crashes ultimately led to the worldwide groundingof the 737 MAX in March 2019 (BBC, 2019). While re-engined aircraft do not deploy thefull potential technology benefits of clean-sheet designs (Kharina, Rutherford, & Zeinali,2016), they are more fuel-efficient than the legacy designs. These new aircraft do notalways replace older aircraft, but sometimes expand the global fleet. Greater visibilityof the flights, passenger-kilometers traveled, and emissions from such planes is likely tobe of general interest.Separate from these, 2019 was an important year for aircraft emissions from a policyperspective. The first pilot phase of the International Civil Aviation Organization’s(ICAO) Carbon Offsetting and Reduction Scheme for International Aviation (CORSIA)will begin in 2021 (Olmer & Rutherford, 2017). Based upon the original agreement,offsetting obligations for each airline are to be established as a function of its emissionsgrowth above a baseline of 2019 and 2020 emissions on covered routes. More recently,though, ICAO’s Council agreed to use calendar year 2019 as the baseline for calculatingthe offsetting requirements for 2021 to 2023 (Economist, 2020). ICAO will revisit thequestion of whether 2019 alone should also be used as the baseline for other CORSIAphases at its next Assembly meeting in 2022. The impacts of shifting the baseline aredescribed by Graver (2020) using data developed in this study.1ICCT REPORT CO2 EMISSIONS FROM COMMERCIAL AVIATION: 2013, 2018, AND 2019
ICAO’s decision was spurred by the significant impact of COVID-19 on the airlineindustry. In response to the pandemic, passenger throughput fell by 90% or morein major markets in March and April 2020 compared with 2019 (U.S. TransportationSafety Administration, 2020). As of July 2020, scheduled flights had fallen by 55% yearon year globally and, as a result, IATA projected that CO2 emissions from aviation willdrop by 37% in 2020 and remain 18% below 2019 in 2021 (IATA, 2020).This paper is arranged as follows. Section 2 outlines our research methods. Section3 highlights the key findings in terms of absolute CO2 and carbon intensity by route,country, aircraft type, and seating class. Section 4 summarizes the main conclusionsand policy implications of the work, and we close with some thoughts on the directionof future research.2ICCT REPORT CO2 EMISSIONS FROM COMMERCIAL AVIATION: 2013, 2018, AND 2019
2METHODSThis study uses the Global Aviation Carbon Assessment (GACA) model introduced inGraver et al. (2019) to estimate fuel burn, CO2 emissions, and carbon intensity fromcommercial flights in 2013, 2018, and 2019. GACA merges multiple publicly availabledata sources to quantify commercial fuel consumption using Piano 5, an aircraftperformance and design software from Lissys Ltd.1 The data obtained concerned airlineoperations, airports, and capacity, as is detailed below. From that we modeled fuelburn and estimated CO2 emissions, and then validated the results.2.1 AIRLINE OPERATIONS DATABASEGlobal airline operations data were sourced from OAG Aviation Worldwide Limited. TheOAG dataset contained the following variables for passenger and freight airlines: aircarrier, aircraft type, departure airport, arrival airport, departures (number of flights),and capacity in available seat miles (ASMs). Operations data for freight air carriersDHL, FedEx, and UPS were not available from OAG due to restrictions put in place bythe companies. To compensate, we utilized a public data source (U.S. Department ofTransportation [DOT], 2020) to identify the fuel burn associated with these carriers’operations. General and military aviation, which likely accounted for 10% or less of allaviation CO2 in each of the years analyzed, are beyond the scope of this work.2.2 GLOBAL AIRPORTS DATABASEGACA includes a Global Airports Database with geographic information for all airportsincluded in the Airline Operations Database. For each airport, the city, country orterritory, latitude, and longitude were recorded from Great Circle Mapper. 2 Thelatitude and longitude for the departure and arrival airports of each route were usedto calculate great circle distance (GCD). To account for variability in actual flight pathsdue to weather conditions, the GCD of each route was adjusted using ICAO correctionfactors (ICAO, 2017).2.3 PAYLOAD ESTIMATIONThe mass of passengers and/or freight transported on each flight was estimateddifferently in GACA for passenger and dedicated freight operations. Payloadassociated with the transport of passengers and their luggage was estimated usingthe number of aircraft seats, a passenger load factor, and a default passenger massof 100 kg including luggage (ICAO, 2019a). If passenger load factors for an airlinewere not available for purchase (ICAO, 2020b) or published by the airline, an ICAOregion-specific passenger load factor was used (ICAO, 2017). Total traffic, in revenuepassenger kilometers (RPKs), was estimated by multiplying seat capacity by thepassenger load factor.Payload associated with the transport of freight on a passenger aircraft was estimatedusing either data purchased from ICAO, specific airline-published data, or an ICAOregion-specific passenger-to-freight factor.For freighter aircraft, if freight carriage data was not available from data purchasedfrom ICAO or published by the airline, an industry average freight load factor of 49% ofavailable mass capacity, in available tonnes, was tp://www.gcmap.com3ICCT REPORT CO2 EMISSIONS FROM COMMERCIAL AVIATION: 2013, 2018, AND 2019
2.4 FUEL BURN MODELING AND CO2 ESTIMATIONFor each combination of route, airline, and aircraft type, GACA modeled fuel burn usingPiano 5 aircraft files, adjusted GCD, and payload, all derived as previously discussed.In cases where a specific aircraft type was not included in Piano 5, a surrogate aircraftwas used. Piano default values for operational parameters such as engine thrust, drag,fuel flow, available flight levels, and speed were used. Cruise speeds were set to allowfor a 99% maximum specific air range, which is believed to approximate actual airlineoperations. Fuel reserve values to account for weather, congestion, diversions, andother unforeseen events were based on U.S. Federal Aviation Administration (FAA)Operations Specification B043 (2014). Taxi times were set to 25 minutes, as estimatedfrom block and air time data of U.S. air carriers (U.S. DOT, 2020). We accounted forchanges in aircraft weight due to varying seat configurations by adjusting the defaultnumber of seats in Piano 5.For passenger aircraft, fuel burn was apportioned to passenger and freight carriageusing the following three equations:Equation [1]Total passenger fuel use [kg] (Total passenger weight [kg]Total weight [kg])(Total fuel use [kg])Equation [2]Total passenger weight [kg] (Number of aircraft seats)(50 kg) (Number of passengers)( 100 kg)Equation [3]Total weight [kg] Total passenger weight [kg] Total freight weight [kg]Thus, total fuel use is proportional to payload mass after taking into accountfurnishings and service equipment needed for passenger operations. CO2 emissionswere estimated using the accepted constant of 3.16 tonnes of CO2 emitted from theconsumption of one tonne of aviation fuel (ICAO, 2020a). 32.5 SEATING CLASS ALLOCATIONThe Airline Operations Database contained the number of seats available for eachcombination of route, airline, and aircraft type in each of three seating classes: (1)first; (2) business; and (3) economy. Using values from Doganis (2019), passengerload factors for first and business are defaulted to 60% and 75%, respectively. Thesepassenger load factors are similar to the ones used by The World Bank (Bofinger &Strand, 2013) in its estimation of carbon emissions from different seating classes (60%for both first and business) and uses Doganis as a reference. The exception is domesticflights in the United States, where we assumed that the premium passenger cabins arefilled to 100% of capacity due to complimentary upgrades for airlines’ frequent fliers.The passenger load factor for economy is then back-calculated based upon the overallpassenger load factor of a flight and the assumed first and business class load factors.The allocation of CO2 emissions to passengers in each seating class in GACA is based onthe average percentage of area that each seating class occupies in each aircraft class,including galleys and lavatories, and the average percentage of seats occupied in eachseating class. Table 1 outlines how the amount of passenger space on each aircraft classwas apportioned to each seating class when the aircraft had multiple seating classes.34The non-CO2 and radiative forcing effects of aviation emissions are not considered in this study.ICCT REPORT CO2 EMISSIONS FROM COMMERCIAL AVIATION: 2013, 2018, AND 2019
Table 1. Industry average allocation of passenger space by aircraft and seating classAircraft classRegionalNarrowbodyWidebodyAirbus A380 & Boeing 747% Passenger space, by seating classSeatingconfigurationFirstBusinessTwo classes29%—71%Two classes22%—78%Two classes—25%75%EconomyTwo classes—32%68%Three classes16%30%54%Three classes13%35%52%2.6 VALIDATIONPrevious studies established that aircraft performance models tend to underestimatereal-world fuel consumption (Graver & Rutherford, 2018a and 2018b; IntergovernmentalPanel on Climate Change [IPCC], 1999a). To address this, GACA applies correctionfactors by aircraft type, in terms of fuel burn per RPK derived from U.S. passengerairlines in Piano 5 and validated by operations and fuel burn data reported to the U.S.DOT. The correction factors ranged from 1.02 to 1.20 by aircraft class, and averaged9% across all classes. In cases where a specific aircraft type in the Airline OperationsDatabase was not operated by a U.S. passenger airline, the GACA fuel burn correctionfactor for a comparable aircraft was used.5ICCT REPORT CO2 EMISSIONS FROM COMMERCIAL AVIATION: 2013, 2018, AND 2019
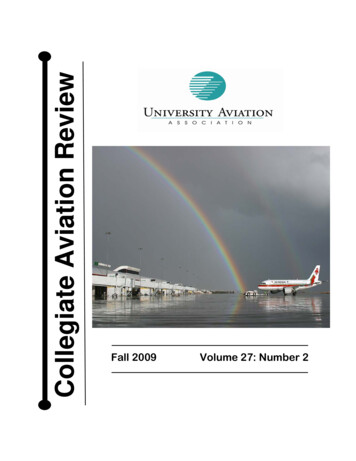
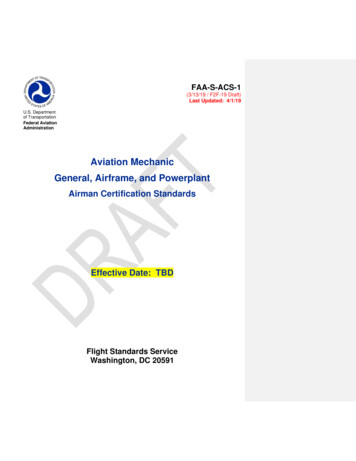
3RESULTS AND DISCUSSIONOperations data for 2013 and 2019 were newly evaluated for this report, and 2018data was reanalyzed using the improved source data. The GACA model was used toestimate CO2 emissions for all three years. The global operations modeled in this studyagreed well with industry estimates.3.1 TOTAL GLOBAL OPERATIONS AND CO2 EMISSIONSMore than 39 million flights were included in the Airline Operations Database for 2019and, of these, more than 98% were flown by passenger aircraft. Our estimate of thetotal global passenger demand was 8,703 billion RPKs, about 0.3% higher than IATA’spublished value of 8,680 billion RPKs. The total cargo transported was estimated as253 billion cargo tonne kilometers (CTKs), within 0.4% of IATA’s published value of 254billion CTKs. GACA-estimated RPKs and CTKs for 2013 and 2018 were also within 1% ofindustry estimates.The GACA model estimated that global aviation operations for both passenger andcargo carriage emitted 920 million tonnes (Mt) of CO2 in 2019, about 0.6% higher thanIATA’s published value. The reanalysis of 2018 operations data estimated CO2 emissionsof 903 Mt that year, slightly lower than the prior estimate of 918 Mt. This new valueis about 0.2% lower than industry’s estimate. Comparing 2018 and 2019, emissionsincreased by about 2%. Our estimate of 2013 emissions is 706 Mt of CO2, or 0.9% lowerthan the value published by industry (ATAG, 2020). This means that, based on ouranalysis, CO2 increased by about 30% between 2013 and 2019, or an average yearlyincrease of 4.5%. Emissions from passenger transport increased approximately 33%during this time period, while emissions from freight transport increased about 18%.Passenger transport accounted for 785 Mt, or 85%, of commercial aviation CO2emissions in 2019. Passenger movement in narrowbody aircraft was linked to 43% oftotal aviation CO2, transport in widebody jets was linked to 37%, and regional aircraftwas linked to 6%. The remaining 15%, 135 Mt, was from freight carriage that was dividedbetween “belly” freight carriage on passenger aircraft, 8%, and dedicated freighteroperations, 7%.In 2013 and 2018, passenger flights were responsible for 84% and 85% of commercialaviation CO2 emissions, respectively. As illustrated in Figure 1, the breakdown of CO2emissions by operation and aircraft class were similar for the three years analyzed.Passenger: NarrowbodyBelly cargo1,000Passenger: WidebodyDedicated freighterPassenger: 9CO2 emissions 01520162017Figure 1. CO2 emissions by operations and aircraft class, 2013, 2018, and 20196ICCT REPORT CO2 EMISSIONS FROM COMMERCIAL AVIATION: 2013, 2018, AND 2019
Given that passenger transport emitted four times as much CO2 as freight transport incommercial aviation, the focus of the rest of this paper is on passenger transport andaircraft. A more detailed analysis of air freight could be presented in future work.3.2 CO2 FROM PASSENGER TRANSPORTGlobally, two-thirds of all flights in 2019 were domestic. Still, these accounted for onlyapproximately one-third of global RPKs and 40% of global passenger transport-relatedCO2 emissions, as shown in Figure 2. Operations and emissions from 2013 and 2018were similar, and the departures, RPKs, and ASKs shown are similar to values publishedby ICAO (2019b).Between 2013 and 2019, the total number of flight departures worldwide increased by23%, RPKs increased 50%, and passenger transport-related CO2 emissions increased33%. The average passenger flight distance increased by only 8% over the six-yearperiod, suggesting that RPK growth is due primarily to a rise in the number ofpassengers. GACA estimates that the number of domestic passeng
CO 2 emissions from global passenger and cargo operations on par with totals reported by industry (Figure ES-1). In all three analyzed years, passenger flights were responsible for approximately 85% of commercial aviation CO 2 emissions. In 2019, this amounted to 785 million tonnes (Mt) of CO 2. Between 2013 and 2019, passenger transport .