Transcription
The Changing Population ofTexas and San AntonioMasters Leadership ProgramOctober 10, 2012San Antonio, TX
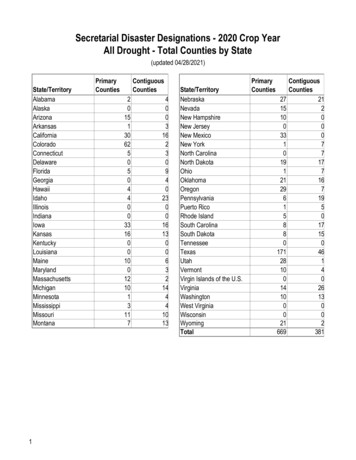
Growing States, 2000-20102000Population*United 531,501,20018.3%North 30,6326,392,0171,261,38524.6%65% (2.8 million) of this change can be attributed to growthof the Hispanic populationPopulation values are decennial census counts for April 1 for 2000 and 2010.Source: U.S. Census Bureau. 2000 and 2010 Census Count.2
Total Population and Components ofPopulation Change in Texas, 1950-2011Percent ChangeDue ,681529,1202.154.7944.99* All values for the decennial dates are for April 1st of the indicated census year. Values for 2009 and 2011 are for July 1 asestimated by the U.S. Census Bureau.Source: Derived from U.S. Census Bureau Estimates for dates indicated by the Texas State Data Center, University of Texas at San Antonio.Note: Residual values are not presented in this table.3
Estimated Annual Net Migration to Texas, 2000to 00100,00050,00002000 to 2001 to 2002 to 2003 to 2004 to 2005 to 2006 to 2007 to 2008 to200120022003200420052006200720082009Source: U.S. Bureau of the Census 2009 Estimates4
Percent of Migrants to Texas between 2000and 2009 by Race and Ethnicity52% of all migrants 7% of %33%HispanicWhite0%Net domesticInternationalmigrationmigration(848,702 migrants ) (933,083 migrants)TotalSources: Percentages of domestic and international migrants by race and ethnicity derived from the 2006-2008 American Community Survey. Total numbers of domestic and international migrants5 1, 2009,between 2000-2009 are from Table 4. Cumulative Estimates of the Components of Resident Population Change for the United States, Regions, States, and Puerto Rico: April 1, 2000 to JulyU.S. Census Bureau
Estimated domestic migration (2000-2008) bycounty as a percentage of 2000 populationLegend-20 to -45%-19 to -10%-9 to -5%-4 to 0%1 to 5 %6 to 20%21 to 30%31 to 65%Source: Population Division, U.S. Census Bureau, March 19, 2009. Map produced by the Texas State Data Center6
Estimated international migration (2000-2008) bycounty as a percentage of 2000 e: Population Division, U.S. Census Bureau, March 19, 2009. Map produced by the Texas State Data Center7
http://www.forbes.com8
http://www.forbes.com9
States with Largest EstimatedUnauthorized Immigrant Populations, ,350 - 2,750)Texas1,650(1,450 - 1,850)Florida825(725 - 950)New York625(525 - 725)New Jersey550(425 - 650)Illinois525(425 - 625)Georgia425(300 - 550)Arizona400(275 - 500)Source: Pew Hispanic Center estimates based on residual methodology applied to March Supplements to the Current Population Survey (February 1, 2011).6.5% ofTexas’ 2010Population10
Texas Racial and Ethnic Composition,2000 and 201020002010Hispanicor Latino32%Hispanicor Latino38%NHWhite53%NHOther4% NH Black11%Source: U.S. Census Bureau. 2000 and 2010 Census countNHOther6%NHWhite45%NH Black11%
0AgeUnder 1 year4 years8 years12 years16 years20 years24 years28 years32 years36 years40 years44 years48 years52 years56 years60 years64 years68 years72 years76 years80 years84 years88 years92 years96 years100 to 104 PopulationTexas White (non-Hispanic) andHispanic Populations by Age, 2010250000200000White (non-Hispanic)150000Hispanic10000050000Source: U.S. Census Bureau 2010 Decennial Census, SF112
Texas Population Pyramid by Race/Ethnicity, 2010Male White, Non-HispanicMale HispanicMale Black, Non-HispanicMale Asian, Non-HispanicMale Other, Non HispanicFemale White, Non-HispanicFemale HispanicFemale Black, Non-HispanicFemale Asian, Non-HispanicFemale Other, Non Hispanic100 to 104 years95 years90 years85 years80 years75 years70 years65 years60 years55 years50 years45 years40 years35 years30 years25 years20 years15 years10 years5 yearsUnder 1 year200,000150,000Source: U.S. Census Bureau 2010 Decennial Census, SF1100,00050,000050,000100,000150,00013200,000
Texas Population Pyramid by Race/Ethnicity, 2010Male White, Non-HispanicFemale White, Non-Hispanic100 to 104 years95 years90 years85 years80 years75 years70 years65 years60 years55 years50 years45 years40 years35 years30 years25 years20 years15 years10 years5 yearsUnder 1 year200,000150,000Source: U.S. Census Bureau 2010 Decennial Census, SF1100,00050,000050,000100,000150,00014200,000
Texas Population Pyramid by Race/Ethnicity, 2010Male HispanicMale Black, Non-HispanicMale Asian, Non-HispanicMale Other, Non HispanicFemale HispanicFemale Black, Non-HispanicFemale Asian, Non-HispanicFemale Other, Non Hispanic100 to 104 years95 years90 years85 years80 years75 years70 years65 years60 years55 years50 years45 years40 years35 years30 years25 years20 years15 years10 years5 yearsUnder 1 year200,000150,000Source: U.S. Census Bureau 2010 Decennial Census, SF1100,00050,000050,000100,000150,00015200,000
Total Population by County, 2010Legendco48 d00'PROJECTIONS X '.totpop1082 - 10,00010,001 - 50,00050,001 - 100,001100,001 - 500,001500,001 - 1,000,0001,000,001 - 4,100,000Source: U.S. Census Bureau 2010 Decennial Census16
Change of the Total Population by County,2000 to 2010Legendco48 d00'PROJECTIONS X '.totpopch0010-3,200 - 01 - 10,00010,001 - 50,00050,001 - 100,000100,001 - 700,000Source: U.S. Census Bureau 2000 and 2010 Decennial Census17
Percent Change of Total Population in TexasCounties, 2000-2010Water'PROJECTIONS X Physicians per 1,000 Population 2010'PROJECTIONS X '.difphys-3 to -0.5-0.49 to -.0010.001 to .5.51-2.1 forPopulation increaseTexas was 20.6%during this periodSource: U.S. Census Bureau, 2000 and 2010 Decennial Census18
Projected Population Growth in Texas, 2000-2040YearSource: Texas State Data Center 2008 Population Projections19
Projected Racial and Ethnic Percent, e: Texas State Data Center 2008 Population Projections, 2000-2007 Migration Scenario20
Projected population by county, Texas, 20402040 PopulationP 4036 - 10001001 - 1000010001 - 5000050001 - 100000100001 - 500000500001 - 10000001000001 - 8000000Source: Texas State Data Center, vintage 2008 Population Projections, 2000-2007 Migration Scenario21
Percent Projected Change of Total Population inTexas Counties, 2008-204022
The 10 Counties with the Largest NumericIncrease from April 1, 2010, to July 1, 2011NumericIncrease1.Harris, Texas88,4522.Los Angeles, Calif.70,4513.Maricopa, Ariz.63,1274.Miami-Dade, Fla.58,3315.Riverside, Calif.49,9796.Dallas, Texas47,8757.Orange, Calif.45,5138.San Diego, Calif.44,7569.Bexar, Texas41,37610.Tarrant, Texas40,776Texas contains eight of the 25 counties with the highest numerical gainsSource: U.S. Census Bureau, 201223
Population Growth in San Antonio MSA,1980-2040 (2000-2008 Migration s: 1980-2010. U.S. Census Bureau Counts; 2040: State Data Center 2000-2007 MigrationScenario Projection
Population Growth in San Antonio MSAby Area, 0988,800165,8481,154,648861410019902000Number of Inhabitants by ,703Percent of Population in 1760,9852,142,5082,751,98680207228100100Sources: 1980-2010. U.S. Census Bureau Counts; 2040: State Data Center 2000-2007 MigrationScenario Projection
Components of Change for San Antonio MSA,2000 to 60,425159,44633,261177,447TotalSource: U.S. Bureau of the Census Counts (2000); Estimate (2009)
Percent Population Change, 2000-2010 Bexar Countyand Texas25%23%21%20%15%10%5%0%Bexar CountySource: U.S. Census Bureau, 2000 and 2010 Decennial CensusTexas27
Percent of the Total Population by Ethnicity andCountry of Origin, Bexar County, 2%0%Hispanic orLatino (of anyrace)MexicanPuertoRicanSource: U.S. Census Bureau, 2010 Decennial CensusCubanOtherHispanic orLatinoNotHispanic orLatino28
Percent of the population 5 and over who speakEnglish less than very well by state, 20092520151050Source: American Community Survey, 2009
Percent of the population 5 and over who speakSpanish at home, 200935302520151050Source: American Community Survey, 2009
Percent of the population 5 and over who speakat home,Percent agedSpanish5 yearsplus2005-2009who speak Spanish at0-10%10-25%25-50%50-75%75-96%Source: U.S. Census Bureau, American Community Survey, 5-Year Sample 2005-2009
of the householdsthat are SpanishPercent Numberof householdsspanish linguisticallyisolatedSpanlingisolinguistically isolated, 2005-20090-1,5001,501-5,0005,001 - 10,00010,001 - 50,00050,001 - 150,000Source: U.S. Census Bureau, American Community Survey, 5-Year Sample 2005-2009
HaPercent Labor ForceEmployed inLegend Scientific,Professional,Managementtl 2010 48 county10Occupations, TexasCensus tl 2010 48 county10Tracts, 20062010tl 2010 48 rce: U.S. Census Bureau, American CommunitySurvey, 5-Year Sample, 2006-2010AtascosaNational Geographic, Esri, DeLorme, NAVTEQ, UNEP-WCMC, USGS, NASA, ESA,
HaysPercent Labor ForceEmployed inProduction,Transportation, andMaterial MovingOccupations, TexasLegendCensus Tracts, 2006tl 2010 48 tract102010KendallComalBanderaProduction, transportation, and material moving na30-40%WilsonSource: U.S. Census Bureau, American CommunitySurvey, 5-Year Sample, 2006-2010AtascosaFrioNational Geographic, Esri, DeLorme, NAVTEQ, UNEP-WCMC, USGS, NASA, ESA,METI, NRCAN, GEBCO, NOAA, iPC
HaysPercent of the LaborForce Unemployed,Texas Census Tracts,Legend2006-2010tl 2010 48 %Guadalupe7.6-12.5%12.6-17.5%Bexar17.6-45%NatGeo World MapMedinaWilsonSource: U.S. Census Bureau, American CommunitySurvey, 5-Year Sample, 2006-2010AtascosaFrioNational Geographic, Esri, DeLorme, NAVTEQ, UNEP-WCMC, USGS, NASA, ESA,METI, NRCAN, GEBCO, NOAA, iPC
HaysPercent HouseholdsReceiving SNAPPBenefits, Texas CensusLegendTracts,2006-2010tl 2010 48 e11-15%16-25%26-30%BexarMedinaWilsonSource: U.S. Census Bureau, American CommunitySurvey, 5-Year Sample, 2006-2010AtascosaFrioNational Geographic, Esri, DeLorme, NAVTEQ, UNEP-WCMC, USGS, NASA, ESA,METI, NRCAN, GEBCO, NOAA, iPC
HayPercent of thePopulation that isAfrican American,LegendTexasCensus Tracts,2006-2010tl 2010 48 county10KendallComalBanderatl 2010 48 20.1-40%40.1-65%MedinaNatGeo World MapWilsonSource: U.S. Census Bureau, American CommunitySurvey, 5-Year Sample, 2006-2010AtascosaFrioNational Geographic, Esri, DeLorme, NAVTEQ, UNEP-WCMC, USGS, NASA, ESA,METI, NRCAN, GEBCO, NOAA, iPC
HayPercent of thePopulation that isHispanic, TexasCensus Tracts, 20062010KendallComalBanderaLegendtl 2010 48 xar50,1-75%75.1-100%MedinaWilsonSource: U.S. Census Bureau, American CommunitySurvey, 5-Year Sample, 2006-2010AtascosaNational Geographic, Esri, DeLorme, NAVTEQ, UNEP-WCMC, USGS, NASA, ESA,
Educational Attainment in Texas, 2010Level of EducationalAttainmentHigh school diplomaor equivalency orgreaterBachelors or greaterPercent ofpersonsaged 25years andolder80.7%Source: U.S. Census Bureau, American Community Survey, 2010.25.9%State Ranking49/50 (tiedwith CA)3139
Race/Ethnic Composition by Education Levelaged 25 years and more, Texas, 20093%9%19%15%6%8%67%71%Less Than High SchoolSource: Derived from 2009 American Community Survey 1-Year Estimates by the Office of the State Demographer.College and Greater40
Projected Percent of Labor Force by EducationalAttainment in Texas, 2000 and 5105.34.450No HighSchool DiplomaHigh SchoolGraduateSomeCollege2000* Proj ections are shown for the 1.0 scenario2040Bachelor'sDegreeGraduate/Prof.Degree
Median Household Income by County,2006-2008 18,000-30,000 30,000-35,000 35,000-40,000 40,000-50,000 50,000-76,000Source: U.S. Census Bureau, American Community Survey, 3-Year Sample 2006-200842
Percent of Population Less than 18 Years of Age,Living Below Poverty During Past 12 Months,2006-20085-20%20-30%30-40%40-55%Source: U.S. Census Bureau, American Community Survey, 3-Year Sample 2006-200843
% Health Insurance Coverage by EthnicGroup and Type, Texas, 2008768070706460545040304038252028232221 21211411100LatinoAngloNoneBlackPublicSource: American Community Survey Microdata, 2008AsianOtherPrivate44
% Health Insurance Coverage byImmigrant Status & Type, Texas, zedNonePublicSource: American Community Survey Microdata, 2008Non-CitizenPrivate45
Teen Birth Rate by State, 2010RankState7MississippiNew ict of Columbia9West VirginiaAlabama12345610Birth rate per 1,000women ages 15-19Source: National Center for Health Statistics at the Centers for Disease Control and Prevention5552.952.552.250.447.746.245.444.843.646
Projected Increase in Obesity in Texas byEthnicity, 2006 to 2040Source: Office of the State Demographer projections, using 2000-2004 migration scenario population projections47
Projected Number of Adults with Diabetes by Raceand Ethnicity, Texas, loAfrican AmericanOther2,000,0000Source: Office of the State Demographer, 201048
Demographics and Destiny49
ContactLloyd Potter, Ph.D.Office: (512) 463-8390 or (210) 458-6530Email: Lloyd.Potter@osd.state.tx.usInternet: http://osd.state.tx.us50
Texas and San Antonio Masters Leadership Program October 10, 2012 San Antonio, TX . Growing States, 2000-2010 2000 Population* 2010 Population* Numerical Change 2000-2010 Percent Change 2000-2010 Population values are decennial census counts for April 1 for 2000 and 2010.