Transcription
PERMANENCYAND WELL-BEINGIN THE CONTEXTOF COMMUNITYIllinois Permanency Enhancement Project (PEP)Central Region (July 27, 2021)Doris M. Houston, Ph.D.Brea Banks, Ph.D.Charles Osei, M.S.WIllinois State UniversitySchool of Social WorkCenter for Child Welfare and Adoption Studiesdmhous2@ilstu.edu
WHO WE ARE Statewide Partnership(established in 2006) DCFS African American AdvisoryCouncil Private Child Welfare Agencies Concerned Citizens Illinois Courts African American Family Commission State universities: ISU, NIU, SIUE, UIC
Objectives: Promote community-based solutions toimprove family permanency and child wellbeing Reduce disparities among children of colorreceiving child welfare and child protectionservices Use data driven decision making to improveoutcomes for youth Promote stakeholder partnerships/ ownership
PreserveFamilies4 Goals pPERMANENCYReduceRacialDisparityReunifyFamilies
National ChildWelfare Trends
Children in Foster Care 10Youth in CareChildren in Foster urce: The AFCARS Report: Preliminary FY2019 Estimates as of June 2020 (23) (U.S.Department of Health and Human Services[HHS], 2020), available ments/cb/afcarsreport27.pdf2011 2012 2013 2014 2015 2016 2017 2018 2019Fiscal Year
Children in FosterCare have a 50/50Chanceof Returning Home(National Outcomes)Child Welfare InformationGateway. (2020). Foster carestatistics 2018. Washington, DC:U.S. Department of Health andHuman Services, Administration forChildren and Families, Living withOther s3%1%0%20%2008201840%60%
Foster Care andChildhood Trauma
ADVERSECHILDHOODEXPERIENCES (ACEs)1Holman, D. et al. (2016). TheAssociation Between AdverseChildhood Experiences and Risk ofCancer in Adulthood: A SystematicReview of the Literature. Pediatrics,138:S81-S91. Abuse/Neglect Parent who’s an alcoholic Mother who’s a domestic violence survivor Family member in jail Family member diagnosed with a mental illness Disappearance of a parent through divorce, death,abandonment, foster care Gun violence
Foster Care, ChildTrauma,and EducationalOutcomesSmithgall, C., Jarpe-Ratner, E.,Walker, L. (2010). Looking Back,Moving Forward: Using IntegratedAssessments to Examine theEducational Experiences of ChildrenEntering Foster Care. Chicago:Chapin Hall at the University ofChicagoIllinois Data 2x more likely to be absent from school 50-75% change schools upon FC entry 2.5-3.5x more likely to receive special educationservices 34% 17-18 year olds: 5 school changes
Central IllinoisChild Characteristics
Child Population18682Child Population44456325124377637647Source: U.S. Census Bureau, ChildCharacteristics, 2010-2018 AmericanCommunity Survey 5-Year Estimates.Table S0901. Retrieved from:https://data.census.gov/cedsci/table?q fostercare&g ,17183&layer VT 2018 050 00 PY D1&text S0901&t Children&cid S0901 C01 001E&vintage 2018&tid ACSST5Y2018.S0901&hidePreview ngamon20,000Rock es45,000Champaign
Child Population byRaceWhiteLatinoAfrican American3500025055 (64.4%)31964 (71.9%)3000028348 (75.3%)3735 (9.6%)26178 (59.8%)8224 (18.5%)2500010462 (23.9%)7820 (20.1%)2861 (7.6%)19572 (69.7%)200008491 (91%) 15894 (67%)Source: U.S. Census Bureau, ChildCharacteristics, 2010-2018 AmericanCommunity Survey 5-Year Estimates. TableS0901. Retrieved from:https://data.census.gov/cedsci/table?q fostercare&g ,17183&layer VT 2018 050 00 PY D1&text S0901&t Children&cid S0901 C01 001E&vintage 2018&tid ACSST5Y2018.S0901&hidePreview false150006600 (20.4%)10000355(3.8%)949 (4%)13077 (73.9%)4064 (13.8%)3475 (19.6%)4518 (12%)4389 (18.5%)50000ChampaignColesMaconMcLeanPeoriaRock IslandSangamon3239 (7.4%)336 (3.6%)1512 (3.4%)Vermillion1345 (8.2%)
Total Child Population 38,906Child Populationby RaceChampaign County3735(9.6%)25055(64.4%)Source: U.S. Census Bureau, ChildCharacteristics, 2010-2018 AmericanCommunity Survey 5-Year Estimates.Table S0901. Retrieved from:https://data.census.gov/cedsci/table?q fostercare&g ,17183&layer VT 2018 050 00 PYD1&text S0901&t Children&cid S0901 C01 001E&vintage 2018&tid ACSST5Y2018.S0901&hidePreview nAmerican200002500030000
Total Child Population 9,331Child Populationby RaceColes CountyHispanicWhiteAfricanAmerican355 (3.8%)8491 (91%)Source: U.S. Census Bureau, ChildCharacteristics, 2010-2018 AmericanCommunity Survey 5-Year Estimates.Table S0901. Retrieved from:https://data.census.gov/cedsci/table?q fostercare&g ,17183&layer VT 2018 050 00 PYD1&text S0901&t Children&cid S0901 C01 001E&vintage 2018&tid ACSST5Y2018.S0901&hidePreview false336 (3.6%)0100020003000400050006000700080009000
Total Child Population 23,722Child Populationby RaceMacon 67%)Source: U.S. Census Bureau, ChildCharacteristics, 2010-2018 AmericanCommunity Survey 5-Year Estimates.Table S0901. Retrieved from:https://data.census.gov/cedsci/table?q fostercare&g ,17183&layer VT 2018 050 00 PYD1&text S0901&t Children&cid S0901 C01 001E&vintage 2018&tid ACSST5Y2018.S0901&hidePreview 00018000
Child Populationby RaceMcLean CountyTotal Child Population 75.3%)Source: U.S. Census Bureau, ChildCharacteristics, 2010-2018 AmericanCommunity Survey 5-Year Estimates.Table S0901. Retrieved from:https://data.census.gov/cedsci/table?q fostercare&g ,17183&layer VT 2018 050 00 PYD1&text S0901&t Children&cid S0901 C01 001E&vintage 2018&tid ACSST5Y2018.S0901&hidePreview false4518 (12%)050001000015000200002500030000
Total Child Population 43,776Child Populationby RacePeoria : U.S. Census Bureau, ChildCharacteristics, 2010-2018 AmericanCommunity Survey 5-Year Estimates.Table S0901. Retrieved from:https://data.census.gov/cedsci/table?q fostercare&g ,17183&layer VT 2018 050 00 PYD1&text S0901&t Children&cid S0901 C01 001E&vintage 2018&tid ACSST5Y2018.S0901&hidePreview 500030000
Total Child Population 32,512Child Population byRaceRock Island e: U.S. Census Bureau, ChildCharacteristics, 2010-2018 AmericanCommunity Survey 5-Year Estimates.Table S0901. Retrieved from:https://data.census.gov/cedsci/table?q fostercare&g ,17183&layer VT 2018 050 00 PYD1&text S0901&t Children&cid S0901 C01 001E&vintage 2018&tid ACSST5Y2018.S0901&hidePreview 000
Total Child Population 44,456Child Population byRaceSangamon CountyHispanicWhiteAfricanAmerican1512 (3.4%)31964 (71.9%)Source: U.S. Census Bureau, ChildCharacteristics, 2010-2018 AmericanCommunity Survey 5-Year Estimates.Table S0901. Retrieved from:https://data.census.gov/cedsci/table?q fostercare&g ,17183&layer VT 2018 050 00 PYD1&text S0901&t Children&cid S0901 C01 001E&vintage 2018&tid ACSST5Y2018.S0901&hidePreview false8224 (18.5%)05000100001500020000250003000035000
Total Child Population 18,682Child Population byRaceVermillion CountyHispanicAfrican- White1345(8.2%)Source: U.S. Census Bureau, ChildCharacteristics, 2010-2018 AmericanCommunity Survey 5-Year Estimates.Table S0901. Retrieved from:https://data.census.gov/cedsci/table?q fostercare&g ,17183&layer VT 2018 050 00 PYD1&text S0901&t Children&cid S0901 C01 001E&vintage 2018&tid ACSST5Y2018.S0901&hidePreview 1200014000
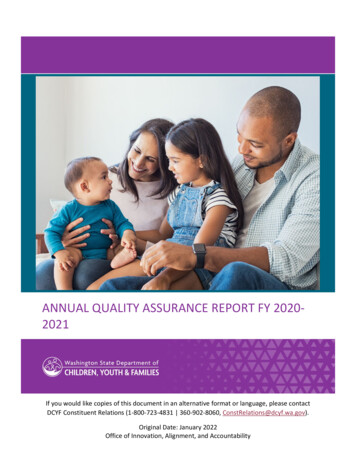
Children at orBelow PovertyChildren at or Below PovertyVermillionSangamonRock IslandPeoriaMcLeanMaconColesChampaign5410 (30%)Total Child Population 18682Total Child Population 4445610622 (24.4%)Total Child Population 325127556 (23.6%)Total Child population 437769271 (21.6%)Source: U.S. Census Bureau, ChildCharacteristics, 2010-2018 AmericanCommunity Survey 5-Year Estimates.Table S0901. Retrieved from:https://data.census.gov/cedsci/table?q fostercare&g ,17183&layer VT 2018 050 00 PYD1&text S0901&t Children&cid S0901 C01 001E&vintage 2018&tid ACSST5Y2018.S0901&hidePreview falseTotal Child population 376474393 (11.8%)Total Child Population 237226016 (25.7%)Total Child Population 93312085 (25.6%)Total Child Population 389060%10%6877 (17.9%)20%30%
UnemploymentRatesUnemployment RatesWhiteLatinoAfrican AmericanAsians1495 (19.7%)20%1978 (18.7%)1965 (17.2%)18%3904 (17%)2936 (16.2%)16%211 (13.3%)14%177 (11.8%)12%377 (12.1%)546 (9.7%)948 (8.9%)57 (5.9%)10%4980 (5.1%)8%595 (6.8%)2236 (5.5%)273 (4.7%)4206 (6.1%)4905 (3.8)Source: U.S. Census Bureau,Employment Status, 2012-2016American Community Survey 5-YearEstimates. Retrieved from:https://data.census.gov/cedsci/table?g ,17183&tid ACSST5Y2018.S2301&vintage 2018&text S2301&hidePreview false&layer VT 2018 050 00 PY D1&cid S2301 C01 001E6%6684 (6.0%)247 (4.6%)187 (5.9%)160 (5.8%)6412 (4.8%)34 (5.7%)3094 (5.9%)3562 (3%)604 (3%)14 (2.7%)4%298 (11.8%)831 (6.6%)2250 (10.9%)21 (2.2%)168 (2.4%)2%0%ChampaignColesMaconMcLeanPeoriaRock Island SangamonVermillion
UnemploymentRatesUnemployment RatesWhiteLatinoAfrican AmericanAsians20%18%16%14%12%10%8%Source: U.S. Census Bureau,Employment Status, 2012-2016American Community Survey 5-YearEstimates. Retrieved from:https://data.census.gov/cedsci/table?g ,17183&tid ACSST5Y2018.S2301&vintage 2018&text S2301&hidePreview false&layer VT 2018 050 00 PY D1&cid S2301 C01 001E6%4%2%0%ChampaignColesMaconMcLeanPeoriaRock IslandSangamonVermillion
Total Unemployed Population 8353Unemployed Adultsin ChampaignCountyAsiansAfrican AmericanLatinoWhite3.0% (603)10.9%(2250)Source: U.S. Census Bureau,Employment Status, 2012-2016American Community Survey 5-YearEstimates. Retrieved from:https://data.census.gov/cedsci/table?g ,17183&tid ACSST5Y2018.S2301&vintage 2018&text S2301&hidePreview false&layer VT 2018 050 00 PY D1&cid S2301 C01 001E6.8% (595)3.8% (4905)0.0%2.0%4.0%6.0%8.0%10.0%12.0%
Total Unemployed Population 2518UnemployedAdults in ColesCountyAsiansAfrican AmericanLatinoWhite2.7% (14)13.3% (211)Source: U.S. Census Bureau,Employment Status, 2012-2016American Community Survey 5-YearEstimates. Retrieved from:https://data.census.gov/cedsci/table?g ,17183&tid ACSST5Y2018.S2301&vintage 2018&text S2301&hidePreview false&layer VT 2018 050 00 PY D1&cid S2301 C01 001E5.9% (57)5.5% (2236)0.0%2.0%4.0%6.0%8.0%10.0%12.0%14.0%
Total Unemployed Population 6369UnemployedAdults in MaconCountyAsiansAfrican AmericanLatinoWhite2.2% (21)17.2%(1965)Source: U.S. Census Bureau,Employment Status, 2012-2016American Community Survey 5-YearEstimates. Retrieved from:https://data.census.gov/cedsci/table?g ,17183&tid ACSST5Y2018.S2301&vintage 2018&text S2301&hidePreview false&layer VT 2018 050 00 PY D1&cid S2301 C01 001E11.8% (177)6.1% %20.0%
Total Unemployed Population 4951Unemployed AdultsinMcLean CountySource: U.S. Census Bureau,Employment Status, 2012-2016American Community Survey 5-YearEstimates. Retrieved from:https://data.census.gov/cedsci/table?g ,17183&tid ACSST5Y2018.S2301&vintage 2018&text S2301&hidePreview false&layer VT 2018 050 00 PY D1&cid S2301 C01 001EAsiansAfrican AmericanLatinoWhite2.4% (168)8.9% (948)4.7% (273)3.0% %
Total Unemployed Population 11381UnemployedAdults inPeoria CountyAsiansAfrican AmericanLatinoWhite4.6% (247)17.0%(3904)Source: U.S. Census Bureau,Employment Status, 2012-2016American Community Survey 5-YearEstimates. Retrieved from:https://data.census.gov/cedsci/table?g ,17183&tid ACSST5Y2018.S2301&vintage 2018&text S2301&hidePreview false&layer VT 2018 050 00 PY D1&cid S2301 C01 001E9.7% (546)6.0% %
UnemployedAdults inRock IslandCountyTotal Unemployed Population 7949AsiansAfrican AmericanLatinoWhite5.8% (160)18.7%(1978)Source: U.S. Census Bureau,Employment Status, 2012-2016American Community Survey 5-YearEstimates. Retrieved from:https://data.census.gov/cedsci/table?g ,17183&tid ACSST5Y2018.S2301&vintage 2018&text S2301&hidePreview false&layer VT 2018 050 00 PY D1&cid S2301 C01 001E6.6% (831)5.1% %20.0%
Total Unemployed Population 9912Unemployed Adultsin SangamonCountyAsiansAfrican AmericanLatinoWhite5.9% (187)16.2%(2936)Source: U.S. Census Bureau,Employment Status, 2012-2016American Community Survey 5-YearEstimates. Retrieved from:https://data.census.gov/cedsci/table?g ,17183&tid ACSST5Y2018.S2301&vintage 2018&text S2301&hidePreview false&layer VT 2018 050 00 PY D1&cid S2301 C01 001E12.1% (377)4.8% %
Total Unemployed Population 4990UnemployedAdults inVermillion CountyAsiansAfrican AmericanLatinoWhite5.7% (34)19.7%(1495)Source: U.S. Census Bureau,Employment Status, 2012-2016American Community Survey 5-YearEstimates. Retrieved from:https://data.census.gov/cedsci/table?g ,17183&tid ACSST5Y2018.S2301&vintage 2018&text S2301&hidePreview false&layer VT 2018 050 00 PY D1&cid S2301 C01 001E11.8% (298)5.9% (3094)0.0%5.0%10.0%15.0%20.0%25.0%
Child Welfare Outcomes
Child Abuse andNeglectHotline Reports
ChampaignCountyReports Made vs.Indicated bySourceChampaign CountyReports Made vs. Indicated by SourceReports Made200018001860949 (51%)16001400120010001307200 (23%)879438 (38%)59 (59%)4002000Source: Central Region DCFSMindshare Data FY 20210 (16%)1149800600Indicated Reports10024 (20%)43 (32%)134119774145 (19%)53 (25%)213
Macon CountyReports Made vs.Indicated by SourceMacon CountyReports Made vs. Indicated by Source1400Reports Made1328Indicated Reports1200216 (45%)1000806 (61%)182 (28%)800650621600319 (51%)400200410Source: Central Region DCFSMindshare Data FY 2012 (29%)10650 (47%)21 (37%)57643483224 (35%)229 55 (24%)
McLean CountyReports Made vs.Indicated by Source15861600McLean CountyReports Made vs. Indicated by Source1400Reports MadeIndicated Reports1200125 (14%)1000883800587 (37%)60052340064017 (29%)174 (33%)14 (40%)200350Source: Central Region DCFSMindshare Data FY 20179 (12%)33 (19%)45586 (19%)66 (73%)1779159
Peoria CountyReports Made vs. Indicated by SourcePeoria CountyReports Made vs.Indicated by Source1092 (52%)Reports Made24222500Indicated Reports199 (17%)209520001627150011581083 (45%)1095361 (33%)100061 (33%) 72 (51%)5000Source: Central Region DCFSMindshare Data FY 20612 (38%)18714226 (25%)103278 80 (29)
Rock Island CountyReports Made vs. Indicated by Source1800Rock Island CountyReports Made vs.Indicated by Source163216001400Reports MadeIndicated Reports1200117 (20%)1000800787653 (40%)6005766004002000Source: Central Region DCFSMindshare Data FY 20120 (15%)174 (29%)650175 (30%)32 (40%)12 (33%)8036390 (0%)127 12 (9%)
Sangamon CountyReports Made vs.Indicated by SourceSangamon CountyReports Made vs. Indicated by SourceReports Made2500Indicated Reports329 (19%)2007989 (49%)18732000172016901500418 (22%)12771000652 (38%)50023 (30%) 324770Source: Central Region DCFSMindshare Data FY 20116 (36%)19 (15%)130348 (27%)100 (27%)377
Vermilion CountyReports Made vs.Indicated by SourceVermilion CountyReports Made vs. Indicated by SourceReports Made900768800700635526 (59%)88 (29%)6005004003002001000Source: Central Region DCFSMindshare Data FY 20Indicated Reports889171 (22%)36339 (23%)170 (27%)304151 (42%)52 (54%)20 (38%) 97521711 (9%)11
IL StatewideReports Made vs. Indicated by SourceIL StatewideReports Made vs.Indicated by SourceReports Made8000073827Indicated Reports10915 (16%)33949 (46%)676797000010625 (26%)600005000045163 10819 (24%)443244049316930 (38%)4000030000797 (22%)1196 (39%)100000Source: Central Region DCFSMindshare Data FY 20229052015 (47%)20000307243064509 (20%)3615
Associationsbetween reportertype and findings?Across counties, there are statisticallysignificant differences for reporter typepredicting total reports and percentage ofindicated reports, with most reports andthe highest percentage coming from lawenforcement (p .01)
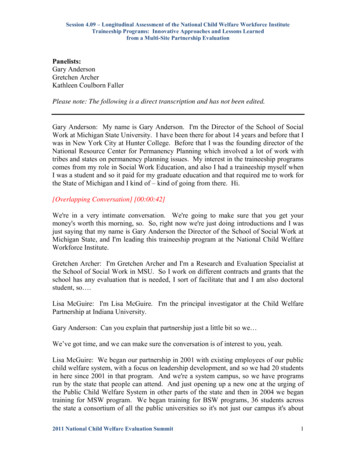
Accepted Reports by Race/Ethnicity3210 (46%)African- White2971 (43%)HispanicOther2998 (64%)2629 (46%)618 (9%)469 (9%)2868 (51%)4247 (44%)2605 (52%) 4628 (52%)5112 (52%)2061 (51%)167036 (51%)3750 (42%)1901 (31%)1826 (37%)Accepted Reportsby Race/Ethnicity96437 (29%)57478 (18%)1345 (29%)886 (15%)115 (2%)196 (2%)238 (5%)7209 (2%)413 (5%)196 (3%)117 (2%)85 (2%)55 (1%)Source: Central Region DCFSMindshare Data FY 20ChampaignMacon152 (2%)McLeanPeoria69 (1%)195 (2%)SangamonVermilionRock IslandIllinois
Accepted Reports by Race/EthnicityAfrican- WhiteHispanicOtherAccepted Reportsby Race/EthnicitySource: Central Region DCFSMindshare Data FY 20ChampaignMaconMcLeanPeoriaSangamonVermilionRock IslandIllinois
Champaign CountyAccepted reportsby Race/EthnicityChampaign countyOtherHispanicWhiteAfricanAmerican2% (117)43% (2971)9% (618)46% (3210)Source: Central Region DCFSMindshare Data FY 200%5%10%15%20%25%30%35%40%45%50%
Macon CountyAccepted reportsby Race/EthnicityMacon countyOtherHispanicWhiteAfricanAmerican1% (55)2% (115)51% (2868)46% (2629)Source: Central Region DCFSMindshare Data FY 200%10%20%30%40%50%60%
McLean CountyAccepted reportsby Race/EthnicityMcLean CountyOtherHispanicWhiteAfricanAmerican2% (85)9% (469)52% (2605)37% (1826)Source: Central Region DCFSMindshare Data FY 200%10%20%30%40%50%60%
Peoria CountyAccepted reportsby Race/EthnicityPeoria CountyOtherHispanicWhiteAfricanAmerican2% (152)5% (413)42% (3750)52% (4628)Source: Central Region DCFSMindshare Data FY 200%10%20%30%40%50%60%
Sangamon CountyAccepted reportsby Race/EthnicitySangamon CountyOtherHispanicWhiteAfricanAmerican2% (195)2% (196)52% (5112)44% (4247)Source: Central Region DCFSMindshare Data FY 200%10%20%30%40%50%60%
Vermilion CountyAccepted reportsby Race/EthnicityVermilion CountyOtherHispanicWhite1% (69)AfricanAmerican5% (238)64% (2998)29% (1345)Source: Central Region DCFSMindshare Data FY 200%10%20%30%40%50%60%70%
Rock Island CountyAccepted reports byRace/Ethnicity RockIsland CountyOtherHispanicWhiteAfricanAmerican3% (196)15% (886)51% (2061)31% (1901)Source: Central Region DCFSMindshare Data FY 200%10%20%30%40%50%60%
IL StatewideAccepted Reportsby Race/EthnicityIL StatewideAccepted Reports by Race/EthnicityOtherHispanicWhiteAfricanAmerican2% (7209)18%(57478)51%(167036)29%(96437)Source: Central Region DCFSMindshare Data FY 200%10%20%30%40%50%60%
Disparity Ratio for Accepted arity Ratio forAccepted aignSource: Central Region DCFSMindshare Data FY 20MaconMcLeanPeoriaSangamonVermilionRock IslandIllinois
Champaign CountyDisparity ratio foraccepted reportsChampaign CountyHispanicAfricanAmerican1.393.460.00Source: Central Region DCFSMindshare Data FY 200.501.001.502.002.503.003.504.00
Macon CountyDisparity ratio forHispanicAfricanAmericanaccepted reportsMacon County0.673.320.00Source: Central Region DCFSMindshare Data FY 200.501.001.502.002.503.003.50
McLean countyDisparity ratio foraccepted reportsMcLean CountyHispanicAfricanAmerican1.774.410.00Source: Central Region DCFSMindshare Data FY 200.501.001.502.002.503.003.504.004.505.00
Peoria CountyDisparity ratio foraccepted reportsPeoria CountyHispanicAfricanAmerican0.893.09Source: Central Region DCFSMindshare Data FY 200.000.501.001.502.002.503.003.50
Sangamon CountyDisparity ratio foraccepted reportsSangamon CountyHispanicAfricanAmerican0.813.230.00Source: Central Region DCFSMindshare Data FY 200.501.001.502.002.503.003.50
Vermilion CountyDisparity ratio foraccepted reportsVermilion CountyHispanicAfricanAmerican0.771.690.00Source: Central Region DCFSMindshare Data FY 200.200.400.600.801.001.201.401.601.80
Rock Island CountyDisparity ratio foraccepted reportsRock Island CountyHispanicAfrican- 0.862.990.00Source: Central Region DCFSMindshare Data FY 200.501.001.502.002.503.003.50
IL StatewideIL StatewideDisparity ratio foraccepted reportsHispanicAfricanAmerican2.822.250.00Source: Central Region DCFSMindshare Data FY 200.501.001.502.002.503.00
Indicated Reports by RaceAfricanAmerican70%1927 (54%)1261 (48%)60%Other48823 (47%)1454 (48%)1460 (48%)695 (48%)843 (38%)Hispanic1117 (65%)1311(50%)1134 (51%)Indicated Reportsby RaceWhite860 (51%)1448 (41%)243 (14%)56 (1.8%))53 (2%)624 (43%)18719 (18%)109 (8%)50%144 (4%)220 (10%)35166 (34%)489 (29%)40%527 (31%)30%Note. Rates specify the numberindicated reports by the total numberof reports for each race/ethnicity67 (2%)10 (0.4%))1583 (2%)20%68 (4%)11 (1%)32 (1%)10%Source: Central RegionDCFS Mindshare Data FY 2087 (5%)26 (1%)20 ock IslandIllinois
Indicated Reports by ed Reportsby Race50%40%30%Note. Rates specify the numberindicated reports by the total numberof reports for each race/ethnicity20%10%Source: Central RegionDCFS Mindshare Data FY k IslandIllinois
Champaign CountyIndicated Reportsby Race ChampaignCountyOtherHispanicWhiteAfricanAmerican1% (32)10% (220)38% (843)Note. Rates specify the numberindicated reports by the totalnumber of reports for eachrace/ethnicitySource: Central Region DCFSMindshare Data FY 2051% (1134)0%10%20%30%40%50%60%
Macon CountyIndicated Reportsby RaceMacon CountyOtherHispanicWhiteAfricanAmerican0.4% (10)2% (53)48% (1261)Note. Rates specify the numberindicated reports by the totalnumber of reports for eachrace/ethnicity50% (1311)0%Source: Central Region DCFSMindshare Data FY 2010%20%30%40%50%60%
Peoria CountyIndicated Reportsby RacePeoria CountyOtherHispanicWhiteAfricanAmerican1% (26)4% (144)41% (1448)Note. Rates specify the numberindicated reports by the totalnumber of reports for eachrace/ethnicity54% (1927)0%Source: Central Region DCFSMindshare Data FY 2010%20%30%40%50%60%
Sangamon CountyOtherIndicated Reportsby RaceSangamon CountyHispanicWhiteAfrican- 2% (67)1.8% (56)48% (1460)Note. Rates specify the numberindicated reports by the totalnumber of reports for eachrace/ethnicitySource: Central Region DCFSMindshare Data FY 2047.8%(1454)0%10%20%30%40%50%60%
Vermilion CountyOtherIndicated Reportsby RaceVermilion CountyHispanicWhiteAfricanAmerican1% (20)5% (87)65% (1117)29% (489)Note. Rates specify the numberindicated reports by the totalnumber of reports for eachrace/ethnicity0%Source: Central Region DCFSMindshare Data FY 2010%20%30%40%50%60%70%
Rock Island CountyIndicated Reportsby RaceRock Island CountyOtherHispanicWhiteAfricanAmerican4% (68)14% (243)51% (860)Note. Rates specify the numberindicated reports by the totalnumber of reports for eachrace/ethnicitySource: Central Region DCFSMindshare Data FY 2031% (527)0%10%20%30%40%50%60%
IL Statewide Indicated Reports by RaceIL StatewideIndicated Reportsby RaceOtherHispanicWhiteAfricanAmerican2% (1583)18%(18719)47%(48823)Note. Rates specify the numberindicated reports by the totalnumber of reports for eachrace/ethnicitySource: Central Region DCFSMindshare Data FY 2034%(35166)0%5%10%15%20%25%30%35%40%45%50%
Disparity Ratio for Indicated y Ratio forIndicated 8 0.981.000.98 0.991.110.800.600.400.20Source: Central Region DCFSMindshare Data FY ock IslandIllinois
Foster CareEntries
IL Statewide Foster Care Entries byRace/EthnicityIL Statewide FosterCare Entries byRace/EthnicityFoster %20%16%13%20%8% (3,102)1% (414)10%0%Source: Central Region DCFSMindshare Data FY 20AfricanAmericanWhiteHispanicOther
Illinois Foster Care DisparitiesIllinois Foster 0Source: Central RegionDCFS Mindshare DataFY 200.00AfricanAmericanHispanic
Foster Care byRace/EthnicityFoster Care by Race/Ethnicity25002352 (58%)AfricanAmericanWhiteHispanicOther1555 (39%)20001285 (49%)1312 (51%)1208 (47%)15001255 (48%)848 (69%)848 (56%)1000507 47%)575 (38%)602 (57%)36 (3%)343 (28%)54 (5%)53 (2%)50048 (3%)36 (2%)Source: Central Region DCFSMindshare Data FY 2048 2%)372 (35%)16 (1%)484 45%)63 (6%)101 (3%)25 (2%)21 (1%)41 (2%)31 (3%)8 k Island
Foster Care by Race/EthnicityFoster Care byRace/Ethnicity25002352 (58%)AfricanAmericanWhiteHispanicOther1555 (39%)20001285(49%)1312 (51%)1208 (47%)15001255 (48%)84 848 (56%)1000507 47%)575 (38%)343 (28%)36 (3%) 602 (57%)53 2%)50048 (3%)36 (2%)Source: Central Region DCFSMindshare Data FY 2048 2%)484 45%)16 (1%)372 (35%)63 (6%)101 (3%)25 (2%)21 (1%)54 (5%)41 (2%)8 (1%31 ck Island
Foster Care by Race for ChampaignCountyFoster Care byRace/EthnicityChampaign CountyOtherHispanicWhite36 (2%)48 (3%)AfricanAmerican575 (38%)848 (56%)0Source: Central Region DCFSMindshare Data FY 20100200300400500600700800900
Foster Care by Race for Macon CountyFoster Care byRace for MaconCountyOtherHispanicWhiteAfricanAmerican48 (2%)53 (2%)1285 (49%)1255 (48%)Source: Central Region DCFSMindshare Data FY 200200400600800100012001400
Foster Care by Race for McLean CountyFoster Care by RaceMcLean CountyOtherHispanicWhiteAfricanAmerican25 (2%)63 (6%)484 (45%)507 (47%)Source: Central Region DCFSMindshare Data FY 200100200300400500600
Foster Care by Race for Peoria CountyOtherFoster Care by RacePeoria CountyHispanicWhiteAfricanAmerican21 (1%)101 (3%)1555 (39%)2352 (58%)Source: Central Region DCFSMindshare Data FY 2005001000150020002500
Foster Care by Race for SangamonCountyFoster Care by RaceSangamon CountyOtherHispanicWhiteAfricanAmerican41 (2%)16 (1%)1208 (47%)1312 (51%)Source: Central Region DCFSMindshare Data FY 200200400600800100012001400
Foster Care by Race for VermilionCountyFoster Care byRace VermilionCountyOtherHispanicWhiteAfricanAmerican8 (1%)36 (3%)848 (69%)343 (28%)Source: Central RegionDCFS Mindshare DataFY 200100200300400500600700800900
Foster Care by Race for Rock IslandCountyFoster Careby RaceRock Island CountyOtherHispanicWhite31 (3%)AfricanAmerican54 (5%)602 (57%)372 (35%)Source: Central RegionDCFS Mindshare DataFY 200100200300400500600700
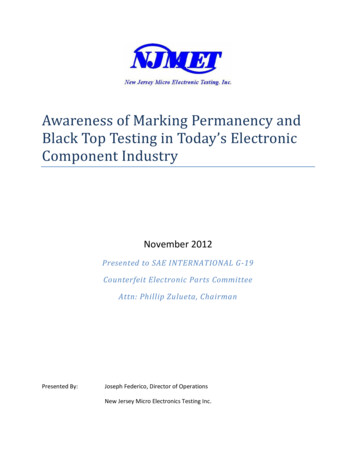
Foster Care Entries by RaceFoster Care Entriesby RaceAfricanAmericanWhiteHispanicOther40%406 (35%)287 (22%)1126 (30%)244 (25%)35%592 (23%)614 (25.9%)420 (32%)230 (24%)654 (26%)30%741 (19%) 617 (26%)30 ( 1%)30 (2%)28 (3%)25%279 (27%)180 (18%)45 (1%)20%5 ( 1%))22 (2%)159 (14%)15%18 (2%)10%13 ( 1%)17 ( 1%)19 ( 1%)10 ( 1%)5%Source: Central Region DCFSMindshare Data FY 204 ( 1%))19 ( 1%)9 ( ck Island
Foster Care Entriesby RaceFoster Care Entries by 0%15%10%5%0%Source: Central Region DCFSMindshare Data FY 20ChampaignMaconMcLeanPeoriaSangamonVermilionRock Island
Foster Care Entries by Race/EthnicityChampaign CountyFoster Care Entriesby Race/EthnicityChampaign CountyOtherHispanicWhiteAfricanAmerican0.1% (17)2% (30)Champaign22% (287)32% (420)Source: Central Region DCFSMindshare Data FY 200%5%10%15%20%25%30%35%
Foster Care Entries by Race/EthnicityMacon CountyFoster Care Entries byRace/EthnicityMacon CountyOtherHispanicWhiteAfricanAmerican0.01% (19)1% (30)Macon26% (654)23% (592)Source: Central Region DCFSMindshare Data FY 200%5%10%15%20%25%30%
Foster Care Entries by Race/EthnicityMcLean CountyFoster Care Entriesby Race/EthnicityMcLean CountyOtherHispanicWhiteAfricanAmerican0.01 (13)3% (28)McLean24% (230)25% (244)Source: Central Region DCFSMindshare Data FY 200%5%10%15%20%25%30%
Foster Care Entries by Race/EthnicityPeoria CountyFoster Care Entries byRace/EthnicityPeoria % (45)Peoria19% (741)30% (1126)Source: Central Region DCFSMindshare Data FY 200%5%10%15%20%25%30%35%
Foster Care Entries by Race/EthnicitySangamon CountyFoster Care Entries byRace/EthnicitySangamon CountyOtherHispanicWhiteAfricanAmerican0.008% (19)0.21% (5)Sangamon26% (617)25.9%(614)Source: Central Region DCFSMindshare Data FY 200%5%10%15%20%25%30%
Foster Care Entries by Race/EthnicityVermilion CountyFoster Care Entriesby Race/EthnicityVermilion CountyOtherHispanicWhiteAfricanAmerican0.003% (4)2% 22)Vermilion35% (406)14% (159)Source: Central Region DCFSMindshare Da
Illinois Permanency Enhancement Project (PEP) Central Region (July 27, 2021) . Illinois State University School of Social Work Center for Child Welfare and Adoption Studies . Statewide Partnership (established in 2006) DCFS African American Advisory Council Private Child Welfare Agencies Concerned Citizens Illinois Courts African American .