Transcription
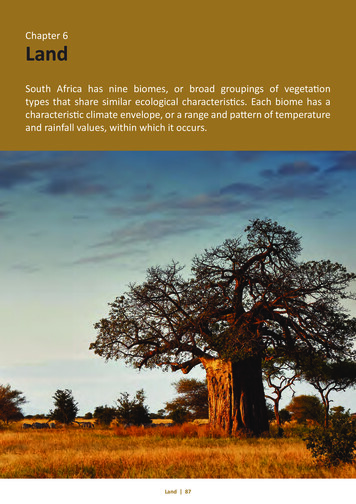
Chapter 6LandSouth Africa has nine biomes, or broad groupings of vegetationtypes that share similar ecological characteristics. Each biome has acharacteristic climate envelope, or a range and pattern of temperatureand rainfall values, within which it occurs.Land 87
Chapter 6Contents6.16.2INTRODUCTIONLAND TRANSFORMATION6.2.1Land .2.5Mining6.3ENVIRONMENTAL IMPACTS6.3.1Land degradation and desertification6.3.2Land cover and vegetation loss6.3.3Soil erosion and soil transportation6.3.4Alien plant invasion6.3.5Contamination of land6.3.6Climate change6.3.7Field crops6.3.8Deforestation6.3.9Impacts of urban development6.4RESPONSES6.4.1Land development, population andenvironment6.4.2South Africa’s land administration,interventions and responses6.4.3Land administration6.4.4Government interventions and responses6.4.5Land reform programme6.5EMERGING ISSUES6.5.1Land restitution and land recapitalization6.5.2Climate change and rural development6.5.3Timber shortage6.5.4Acid mine drainage6.6CONCLUSION6.7REFERENCES6.1 INTRODUCTIONSouth Africa’s historical background places the landresources under tremendous political, socio-economic, andenvironmental pressure. All these pressures emanate fromthe past inequitable land distribution and ownership, spatialmismatch in land management, and the past unsustainableland use practices. Therefore, an in-depth understanding ofmajor drivers of land transformation and change should takeconsideration of the following: Land resource poverty and its inappropriate use; Exploitation of mineral reserves to drive the country’seconomy; Poor spatial and land use planning that result inpoor agricultural practices, poor transport planning,unsustainable settlements; Introduction of foreign substances and species; and, Lack of greenfield management or conservation, climatechange and/or global warming.These are key drivers giving effect to the context whichunderpins reporting on land resources in South Africa. It drawsattention to major land uses, socio-political considerations,environmental issues and aspects, and some emerging landLand 88
issues in the country. It is within this context that this chaptershould be understood.In brief, the land chapter describes the status of the landresource in South Africa over the last five years. It providesan overview of land cover, land use, environmental impactson the land resource, current legislative and institutionalframework governing the land resource, and finally highlightsemerging land issues that require attention in the short tomedium term.Recognition is given to the difficulties of unavailable newdata and sufficient scientific body of knowledge of goodquality, regarding the land resources in South Africa overthe last decade. This is mainly attributed to the very little ornot enough scientific attention which has been given to landresources during this past decade. Some ad hoc scientificresearch has been conducted but produced papers have notbeen synthesized enough into accessible literature. As a result,there is reliance on old management interventions which maynot sufficiently reflect the current thinking and threats to theland subject.First, the overview provided pays attention to status andtrends on the available land-cover data, and various land useclassifications. Each land cover type such as, forest, woodlands,bushlands, etc. is mapped, described and the trends analysed.Second, the status and trends of major land use types inSouth Africa is assessed. Specific emphasis was placed onthe four major land use types of agriculture, forestry, urban,and mining. Each key land use type is mapped, described andtrends analysed.Third, the status and trends of land cover and land use typesin South Africa described above is used to describe theenvironmental impact and issues related to each land usetype, and the changes in the land use are also discussed. Thestresses and impacts that are discussed are for agriculture(i.e. land degradation, desertification, vegetation loss, andspread and prevalence of alien invasive plants), for forestry(i.e. afforestation), for urban land use (i.e. illegal settlements)and for mining (i.e. mining drainage).Fourth, the legislative and institutional framework governingland resources in South Africa is described. The sectionprovides a description of what tools are available to governgovernmental and private land on the key land types.Furthermore, a contextual analysis of the country’s frameworkis presented with the context of population, environment, anddevelopment nexus. The section also provides an overview ofthe key institutional players and governance issues for eachland use type.Fifth, mining land use and associated environmentalimplications are assessed. The extent of land covered bymining activities, and the potential environmental impacts aredetermined. Land use change and the general environmentalimpacts associated with mineral extraction are mapped andpresented. Emphasis on the most critical emerging issues inmining are also highlighted and conclusions drawn.Lastly, attention is given to emerging issues that have been andwill be key features of land cover and land use developmentin the coming years. Issues that require specific attention arehighlighted. The following key emerging issues are discussed:land degradation; land restitution and land recapitalization;climate change and rural development; timber shortage; landrestitution; skills shortage in technical forestry; and, acid minedrainage as an ever growing concern in the country.6.2 LAND TRANSFORMATIONSouth Africa has nine biomes, or broad groupings of vegetationtypes that share similar ecological characteristics. Each biomehas a characteristic climate envelope, or a range and patternof temperature and rainfall values, within which it occurs(Driver et al. 2011). The detailed description on biodiversityis provided in Chapter 7: Biodiversity and Ecosystem Health.The 2006 SAEO (DEAT 2006) highlighted the following majorarea statistics of the land cover classes: Of the 12.8 million hectares of cultivated areas in SouthAfrica, nearly 10.5 million hectares (82 per cent) is forcommercial purposes, 0.8 million ha (only 6.2 per cent)is permanently under cultivation, and more than 10.8million hectares (85 per cent) is rain-fed; Over 0.7 million hectares of land is degraded and leftbare by soil erosion (sheet and gully erosion); 4.6 millionhectares of natural vegetation are degraded, mainly inindigenous forests, woodlands, and grasslands; a further0.2 million hectares is degraded by mine tailings, wasterock dumps, and surface-based mining; Urban areas comprise mainly formal residential suburbsand townships (1 million hectares) and informalsettlements (0.2 million hectares); and, Savannahs (woodlands and bushlands) and grasslandscover 25.7 and 19.9 per cent of South Africa, respectively(DEAT 2006).Land cover data is used to quantify where natural habitat hasbeen irreversibly lost (Driver et al. 2011). The best currentlyavailable land cover data for South Africa is the SANBI mosaicland cover 2009 (Map 6.1). It is based on the National LandCover 2000 supplemented with more recent data fromprovinces and other sources where available.There has been outright loss of natural habitat, over 18 percent of South Africa’s land surface, mostly as a result ofcultivation of crops (such as maize, wheat and sugar cane),but also mining, forestry plantations and urban development(Driver et al. 2011). In some regions the percentage is muchhigher and the rates of loss are alarming. For example, inNorth West, Gauteng and KwaZulu-Natal, if loss of naturalhabitat continues at current rates there will be little naturalvegetation left outside protected areas in these provinces byabout 2050.It is estimated that close to 18 per cent of South Africa’snatural land cover is transformed, mainly by cultivation (10.4per cent), degradation of the natural cover (4.5 per cent),urban land use (1.5 per cent), and forestry (1.4 per cent). Map6.1 shows the existing land cover in South Africa (DEAT 2006).Recently, the natural land cover situation may have changed.Such reasonable changes may have not been sufficientlyLand 89
recorded. As such, natural land cover transformation and landdegradation trends could not be sufficiently depicted.One means of monitoring population growth, agriculturalproduction, and the increasing demand on natural resourcesis through land cover change mapping. Modern EarthObservation technologies, especially those Earth Observationdatasets comprising a multi-year data archive, lend themselvesto land cover change studies.Land use profoundly influences the productivity and conditionof land, as well as its biodiversity integrity. Land cover change,which reflects an underlying change in land use, is therefore animportant indicator of the condition of terrestrial ecosystems(DEA 2006).Map 6. 1: Land cover mapSource: SANBI (2009)6.2.1 Land useLand use, defined as the sequence of operations carriedout with the purpose to obtain goods and services fromthe land, can be characterized by the actual goods andservices obtained as well as by the particular managementinterventions undertaken by the land users. Socio-economicmarket forces generally determine land use; however it is stillbound by biophysical constraints imposed by the ecosystemsin which they occur (Pretorius 2009).Land use is one of the most important pressures leading toland change and degradation, which directly affect its status,and impacts on goods and services provided by the land. Theland use pattern therefore provides an important contextfor the understanding of land use change, opportunities anddegradation. To characterize land use in a systematic wayallows evaluating the various aspects of land use changeand degradation, particularly when information is relatedto ecosystem characteristics and socio-economic attributes(Pretorius 2009).At regional and global scales, information on land use can beindirectly derived from agricultural census data, land coverinformation and from maps of the biophysical resource. Fewdatabases are available that allow the characterization of theland management interventions themselves. For instanceLand 90
information on mechanization or fertilizer used is often onlyavailable as national statistics. In fact only data for irrigation,livestock presence and protected areas are consistent globaldatabases available which allow refining the mapping andcharacterization of land use (Pretorius 2009).Cropland covers the main areas in the Western Cape, FreeState, Mpumalanga, and North West (Map 6.2). However, itforms the smallest area proportion of the Northern Cape dueto aridity. Dry provinces tend to have greater areas of grazinglands or veld than the wetter provinces. The Northern andEastern Cape (especially in the west) possess on average thehighest proportion of grazing lands.Section 6.2.2 to 6.2.5 presents the status and trends of thefour major land use types in South Africa, namely agriculture(or croplands), forestry, urbanization and mining.6.2.2 UrbanizationThe importance of the expanding urban land use area in SouthAfrica is underlined by an ecological footprint associated withurban land use activities. According to Ros (2007) settlementin South Africa can be classified into five urban land categories(Table 6.1).The Free State, KwaZulu-Natal, Limpopo, and North West allhave between 54 and 58 per cent of land used for grazing.Gauteng has less than 20 per cent of its area used for grazing.Commercial forests occupy the greatest area in KwaZuluNatal and Mpumalanga, while they are absent from theFree State, Gauteng, and the arid Northern Cape and NorthWest. Conservation areas are greatest in Mpumalanga but donot make up more than three per cent in any of the otherprovinces.Gauteng possesses by far the greatest proportion of settlementarea in South Africa. The Northern Cape has particularly lowsettlement areas while all the other provinces range betweenfive and 14 per cent (Hoffman & Todd 2000).Map 6. 2: Land use systems in South AfricaSource: FAO (2012)Land 91
Table 6. 1: Overview of urban land use classification in South AfricaTypeHierarchy ofsettlementDefining aPopulation is greater than 1,000,000individuals. Has a strong, diverse economy.Johannesburg, Cape Town,eThekwini, Tshwane andEkurhuleni.Secondary citiesPopulation is between 250,000 and1,000,000 individuals. Has a strong, diverseeconomy base.Nelson Mandela, Emfuleni andBloemfontein.Large townsPopulation between 25,000 and 250,000individuals. Economic base is focused onlimited products/services.Buffalo City, Pietermaritzburg andMogale City.Small townsPopulation is between 2,000 and 25,000.Economic base is focused on limitedproducts.Cers, Underberg, Port Edward,Upington, Ficksburg, Vryburg,Cullinan and Bethal.Rural villagesVarying population, clusters or dispersed, with few urban amenities and formaleconomic activities and mostly in former homeland areas.Agricultural landFarming areas and non-urban.RuralSource: Ros (2007)Urban growth in South Africa is accelerating. Concerns aboutthis relate to the deterioration in quality and reliability ofenergy services available to the poor as a whole but particularlyto the growing population in the urban and peri-urban areas.Population densities in these areas make people vulnerable tohealth threats due to limited access to cleaner energy.The urbanization trend followed by South Africa is ahead ofthe global trend and that of sub-Saharan Africa. Due to thistrend and the repealing of apartheid legislation that restrictedmovement, land ownership, and promoted tribal landoccupation arrangements (e.g. Bantustans), there is a largerpopulation movement towards urban areas. However, thepopulation of the country remains stratified along the linesof inequality. This is mainly because race, gender, and classcharacterize it.South Africa is also ranked amongst the most unequal societiesin the world. It is estimated that 13 per cent of the populationlive in conditions similar to first world countries, whilst themajority remains in poor living conditions. The outcome ofthe apartheid spatial planning practices has seen many urbansettlements in the country without proper functionality toprovide services to the majority of the poor. There is a generallack of access to amenities and livelihood opportunities. Itwas only after 1986 that rural-urban migration amongst blackSouth Africans was encouraged (ERC 2008).As such, most of the urban centres and cities were not gearedup or ready for the population influx. Most people foundthemselves relegated to the periphery of these cities. Thiscreated challenges on urban sprawl and led to the rise ofinformal settlements and/or slums, depriving people accessto basic services. Furthermore, these high concentrations ofinformal settlement have since become an epitome of poverty.With the high influx of people into cities, provision of servicessuch as access to clean water, sanitation, and affordable energyfor the poor has also become increasingly important. Mostof the urban and peri-urban settlements in South Africa arefaced with the challenge of formal housing, illegal electricityconnections, safety and land tenure. There is a predominantuse of coal in the cities with resultant secondary emissionsthat impact negatively on the air quality (indoor and ambient)in these areas. Most of the cities found themselves having todeal with cases of electrocutions, voltage surges and blackouts(ERC 2008).6.2.3 AgricultureLand and agricultural production have been highlightedas critical for economic growth and poverty reduction. Forexample, it has been emphasized that most African economiesare heavily reliant on agriculture and natural resources for asignificant share of GDP, national food needs, employmentand export revenue (Mutangadura 2007).South Africa has a two-tiered economy, one with characteristicsof developed countries and the other with only the most basicinfrastructure. This two-tiered economy is also prevalent inthe agricultural economy; a well-developed commercial sectorco-exists with a predominantly subsistence agricultural sector.The total land area of South Africa is 127 million hectares ofwhich 82 per cent (100 million hectares) is agricultural land.Only 14 per cent of agricultural land (14 million hectares)receives sufficient rainfall for arable crop production, whilethe remainder is used for extensive grazing, forestry, andwildlife/nature conservation. Only 1.35 million hectares (lessthan ten per cent of total arable land) are under irrigationbut produces a significant proportion of the country’s totalagricultural output, notably in horticultural and vegetableproduction and viticulture (FAO 2005).Agricultural activities range from intensive livestock cropproduction and mixed farming, to cattle ranching in thebushveld, and sheep farming in the more arid regions. 68 percent of the agricultural land is mainly suitable for extensiveLand 92
livestock farming, but livestock are also kept in other areas,usually in combination with other farming enterprises. Stockbreeders concentrate mainly on developing breeds thatare well adapted to diverse weather and environmentalconditions. The livestock sector contributes almost half of allagricultural output (FAO 2005).It can be seen from Map 6.3 that areas of moderate to higharable potential occur mainly in the eastern part of the country,in Mpumalanga and in Gauteng. Scattered patches also occurin KwaZulu-Natal, Eastern Cape, and Limpopo. Low to marginalpotential areas occur in the eastern-half of the country and inparts of the Western Cape. There are large areas in the drierparts of the country that are being cultivated. These includeareas in the south-western Free State, the western parts ofthe Eastern Cape, and North West, but are not classified ashaving any potential for arable agriculture (DEAT 2006).Map 6. 3: Potential for arable agricultureNote: This map has been adopted from the 2006 South Africa Environment Outlook. Recent updated maps could not be found.Source: DEAT (2006)6.2.4 ForestryDAFF (2011) provides a detailed perspective on the stateof the national forest assets. The following provides a briefsynthesis of the current state of the forest resources in SouthAfrica.South Africa’s forest resources are primarily classified intothree main forest types according to their use, namely:natural or indigenous forests, which are valued for theirhigh biodiversity; the wooded savannah woodlands; and,commercial timber plantations. All of these forest typesplay an important environmental role in soil protection (thisis not in comparison to any vegetation cover e.g. native oragricultural land cover) and act as carbon sinks for storingcarbon, thereby mitigating the effects of climate change.The South African forest resources are spread over some ofthe poorest areas in the country, covering a land surface areaof over 40 million hectares.Natural forest types in South Africa are generally fragmentedand cover a very small percentage of the country’s landsurface. They are estimated to cover nearly half a million(492,700 ha) or 0.4 per cent of the country’s land surface. Onthe other hand, the forest biome is the smallest of all biomes,but constitutes the highest biodiversity. Natural forests arepredominant in KwaZulu-Natal and the Eastern Cape. Theextent of natural forest areas remains fairly stable, at leastaccording to the National Land Cover data sets, thoughthere is evidence of insignificant decline in certain areas andexpansion in others (DAFF 2011). The extent and distributionof indigenous forest and woodland areas by forest type andclass is presented in Table 6.2.Land 93
Table 6. 2: The extent and distribution of indigenous forests and woodland area by type and classNatural forest typeArea (ha) Woodland classArea (ha)AlbanyAmotale MistbeltDrakensberg Montane22,046.3764,221.091,926.36High Altitude Acacia18,442,443Eastern Cape DuneEastern Mistbelt10,940. 5841,841. 86Low Altitude Acacia4,092,504Eastern ScarpKwaZulu-Natal Coastal33,750.1721,089. 11Ghaap Plateau2,335,628Kwazulu-Natal DuneLicuati Sand12,359.8924,275.67Kuruman1,294,580Lowveld RiverineMangrove11,401. 282,392. 70Southern Rhenosterveld129,293Mpumalanga MistbeltNorthern KwaZulu-Natal Mistbelt32,772.365,323. 42Waterberg967,868Northern MistbeltPondoland Scarp19,203. 6512,337.00CombretumSouthern Cape nskei Coastal platformTranskei Mistbelt61,484.0130,249.74Spekboom1,493 ,76North SucculentMouth SucculentMopane1,279,392920,3171,230,299Western Cape AfrotemperateWestern Cape e: DAFF (2011)492,699.76 TOTALThe benefits derived from natural forests are difficult toexpress in monetary terms. However, the specialist furnitureindustry in Knysna, Western Cape, based on 25,000 m3 ofindigenous timber per year, contributes an annual amount ofR20 million to the GDP. The rate at which natural forests aredeclining or expanding is unknown but property developmentand land invasions, noticeable in some parts of the country,seem to be the major threats to our natural forests (DAFF2011).These basic demands pose a serious threat towardssustainability of woodlands. It is currently estimated that1.5 million rural households are still without electricity. Thistrend is expected to remain unchanged for the next 20 yearsand the reliance on forests will continue. It is further evidentthat degradation and deforestation of woodlands can also beattributed to rural poverty and illiteracy levels (DAFF 2011).The largest portion of the country’s forestland is made upof Savannah, which cover about 39 million hectares. Thisforest type covers a large land surface within the boundariesof protected areas and also occurs in communal areas.Savannahs serve as habitat for a diverse group of wildlife. Thewoodland Savannah provides direct and indirect benefits tothe country’s population due to their provision of goods andservices. It mainly serves as a safety net for rural communities,providing opportunities in eco-tourism (DAFF 2011).Apart from its known protective function, woodlands alsoprovide for the basic needs of rural communities, especiallythe rural poor who are mostly dependent on forests for theirlivelihoods. These communities fulfil their specific needsby sourcing building materials, fuel wood, wild fruits andmedicinal plants from woodlands. It is estimated that over80 per cent of the rural communities in South Africa rely onforests biomass for fuel. There are about 28 million peoplewho use traditional medicine and require security of supply(DAFF 2011).40,971,848South Africa remains the third most diverse country in theworld. Therefore, woodlands and forests provide the requiredprotection to the key natural resources such as soil and water.The secondary benefit becomes the natural beauty andaesthetics that are contributed by wildlife and opportunitiesfor outdoor recreation. The Cape Floristic Kingdom hasthe highest recorded species diversity of any similar-sizedtemperate or tropical region worldwide, making it the world’s’hottest hotspot’, meaning that it is an area where high levelsof species richness, endemism, and threat coincide. The KathuForest in the Northern Cape consists mainly of camel thorntrees (Acacia erioloba), and is known for its exceptional sizeand density of tree cover. However, literature indicates thatbiodiversity is under tremendous threat in South Africa, with asubstantial proportion of natural habitat already having beentotally transformed into other land uses (DAFF 2011).Commercial timber plantations cover approximately 1.3million hectares of the country, constituting about 1.1 percent of South Africa’s forest land. Over 80 per cent of timberplantations occur in the three provinces of Mpumalanga,Eastern Cape and KwaZulu-Natal. Approximately 68 per centof the area covered by plantation estates in South Africa isLand 94
planted with exotic tree species. The balance of these estatescontains natural vegetation, including natural forests thathave to be protected (DAFF 2011).It is apparent from the extract from the State of Forest Report,2011, that forestry remains one of the critical natural assetsthat require attention in South Africa.6.2.5 Miningplatinum-group metals, chrome ore, and manganese ore,and the second largest reserves of zirconium, vanadiumand titanium. The sector spans the full spectrum of the fivemajor mineral categories i.e. precious metals and minerals,energy minerals, non-ferrous metals and minerals, ferrousminerals, and industrial minerals. The country furthermorehas world-class primary processing facilities covering carbonsteel, stainless steel, and aluminium, in addition to gold andplatinum (GDACE 2008) (Map 6.4).South Africa holds the world’s largest reserves of gold,Map 6. 4: Simplified mining locality mapSource: Council for Geoscience (2008)The South African mining industry is long recognized as themost prominent sector, despite the fact that it is only the sixthlargest contributor to total GDP at present. It is still regardedas the largest employer.South Africa’s mineral industry, based mainly on gold,diamonds, coal, and recently, platinum-group metals, hasmade an important contribution to the national economy.Gold: South Africa held its position as the world’s largest goldproducer in terms of extraction for more than a century. In2009 China became the leading gold producer, while goldproduction in South Africa was ranked number five in theworld. South African gold production decreased from 675tonnes in 1980 to 198 tonnes in 2009, which representsa 71 per cent decrease over a 29-year period. Even thoughthe production of South African gold has been decreasing,the output (sales) has shown an increase over the years.The output revenue of gold was R45,992 million in 2008 butincreased by six per cent to R48,696 million in 2009 (StatsSA2012).Platinum group metals (PGM): this group constitutes a familyof six chemically similar elements, which include platinum,palladium, rhodium, ruthenium, iridium and osmium.They are divided according to their densities into a heaviercategory (platinum, iridium and osmium) and a lighter group(palladium, rhodium and ruthenium). South Africa’s platinumgroup metal production (extraction) has increased by 138 percent from 114 tonnes in 1980 to 271 tonnes in 2009. PGMexport sales for 2008 totalled R77,904 million and decreasedby 31 per cent to R53,459 million in 2009. Platinum-groupmetals output (sales) for 2009 amounted to R57,782 million(StatsSA 2012).Coal: In 2009, South African mines produced 251 milliontonnes of coal, which constitutes an increase of 118 per centfrom 115 million tonnes in 1980. In 2008, coal production(extraction) was 253 million tonnes. Of the 2009 coalproduction, 185 million tonnes were sold domestically ata value of R34,463 million, with export sales totalling 60million tonnes at a value of R30,935 million. South Africa hadapproximately 30,408 million tonnes of proven coal reserves,Land 95
which places the country as the sixth-largest holder of provencoal reserves in the world (StatsSA 2012).Mining activities cover most parts of the country’s land area,and are spread over South Africa based on the distributionof the various major geological formations (Map 6.4). Thekey areas utilized for mining, according to the Mining andEnvironmental Impact Guide (GDACE 2008) include: The Witwatersrand Basin and its sediments, which is thelargest known repository of gold on earth but which alsoyield uranium, silver, pyrite and osmiridium; The Bushveld Igneous Complex with a suite of mafic andultramafic rocks and which hosts more than half of theearth’s chrome ore and platinum group metals, as well assignificant deposits of vanadium, iron, titanium, copperand nickel. Its acidic rocks contain fluorspar, tin andcopper mineralization whilst the aluminium-rich rocksadjacent to the Complex host vast quantities of alusite; The Transvaal Supergroup which contain enormousresources of dolomite and limestone together with morethan three quarters of the world’s exploitable manganeseand some lead/zinc deposits; The Karoo Supergroup sediments which contain extensivecoal resources used in the generation of the bulk of thecountry’s electricity; Kimberlite Intrusions of various ages which have yielded,and continue to yield, significant quantities of diamonds; The Phalaborwa Complex which hosts the world’s largestdeposits of high-grade vermiculite as well as significantquantities of phosphates, copper, iron, titanium andzirconium; and, Coastal dunes and sands some of which host high-gradealluvial diamonds as well as vast quantities of titanium,iron and zirconium.6.3 ENVIRONMENTAL IMPACTSLand is under continuous transformation because it is hostto most or all human activities. This transformation is areflection of indicators of land resource-use trends, associatedenvironmental issues that require attention which need to beunderstood and managed. Below some environmental issuesand impacts associated with the land resources within themain four land use categories of South Africa are discussed.6.3.1 Land degradation and desertificationDegradation continues to threaten the local resource-baseupon which rural communal livelihoods depend. Degradationis caused by a combination of unemployment, poverty andan absence or failure of land use regulation. The degradationobserved in the communal lands is thus principally aconsequence of high population densities aggravated by theoppressive apartheid system rather than the outcome oftraditional communal pastoralism (Wessels 2011).6.3.2 Land cover and vegetation lossLand cover or vegetation loss in South Africa, is both humaninduced and/or naturally occurring. The causes range fromfire to floods, drou
State, Mpumalanga, and North West (Map 6.2). However, it . forms the smallest area proportion of the Northern Cape due to aridity. Dry provinces tend to have greater areas of grazing lands or veld than the wetter provinces. The Northern and Eastern Cape (especially in the west) possess on average the highest proportion of grazing lands. The .