Transcription
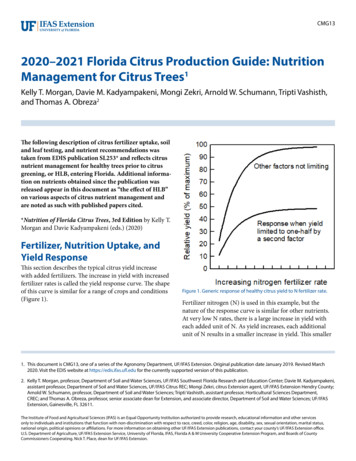
CMG132020–2021 Florida Citrus Production Guide: NutritionManagement for Citrus Trees1Kelly T. Morgan, Davie M. Kadyampakeni, Mongi Zekri, Arnold W. Schumann, Tripti Vashisth,and Thomas A. Obreza2The following description of citrus fertilizer uptake, soiland leaf testing, and nutrient recommendations wastaken from EDIS publication SL253* and reflects citrusnutrient management for healthy trees prior to citrusgreening, or HLB, entering Florida. Additional information on nutrients obtained since the publication wasreleased appear in this document as “the effect of HLB”on various aspects of citrus nutrient management andare noted as such with published papers cited.*Nutrition of Florida Citrus Trees, 3rd Edition by Kelly T.Morgan and Davie Kadyampakeni (eds.) (2020)Fertilizer, Nutrition Uptake, andYield ResponseThis section describes the typical citrus yield increasewith added fertilizers. The increase in yield with increasedfertilizer rates is called the yield response curve. The shapeof this curve is similar for a range of crops and conditions(Figure 1).Figure 1. Generic response of healthy citrus yield to N fertilizer rate.Fertilizer nitrogen (N) is used in this example, but thenature of the response curve is similar for other nutrients.At very low N rates, there is a large increase in yield witheach added unit of N. As yield increases, each additionalunit of N results in a smaller increase in yield. This smaller1. This document is CMG13, one of a series of the Agronomy Department, UF/IFAS Extension. Original publication date January 2019. Revised March2020. Visit the EDIS website at https://edis.ifas.ufl.edu for the currently supported version of this publication.2. Kelly T. Morgan, professor, Department of Soil and Water Sciences, UF/IFAS Southwest Florida Research and Education Center; Davie M. Kadyampakeni,assistant professor, Department of Soil and Water Sciences, UF/IFAS Citrus REC; Mongi Zekri, citrus Extension agent, UF/IFAS Extension Hendry County;Arnold W. Schumann, professor, Department of Soil and Water Sciences; Tripti Vashisth, assistant professor, Horticultural Sciences Department,CREC; and Thomas A. Obreza, professor, senior associate dean for Extension, and associate director, Department of Soil and Water Sciences; UF/IFASExtension, Gainesville, FL 32611.The Institute of Food and Agricultural Sciences (IFAS) is an Equal Opportunity Institution authorized to provide research, educational information and other servicesonly to individuals and institutions that function with non-discrimination with respect to race, creed, color, religion, age, disability, sex, sexual orientation, marital status,national origin, political opinions or affiliations. For more information on obtaining other UF/IFAS Extension publications, contact your county’s UF/IFAS Extension office.U.S. Department of Agriculture, UF/IFAS Extension Service, University of Florida, IFAS, Florida A & M University Cooperative Extension Program, and Boards of CountyCommissioners Cooperating. Nick T. Place, dean for UF/IFAS Extension.
response to increasing the fertilizer amount is also referredto as the law of diminishing returns. The two responsecurves in Figure 1 compare the effect of N rate for twosituations: one where the amount of fertilizer nutrients inthe soil limits or reduces yield, and another where the yieldis limited to one-half by low concentrations of a secondfertilizer nutrient. The shapes of the curves are similar,and the rate of N where the slope levels off is only slightlyhigher for the more productive grove.The amount of nutrient the crop removes varies from afraction of a lb/acre for some of the micronutrients to asmuch as 100 lb/acre of N or K from a high-producinggrove. For oranges, approximately 0.12 lb N/box is removedwith the harvest. Therefore, crop removal ranges from 12 lbN/acre for a 100 box/acre yield to around 100 lb N/acre fora grove producing 800 boxes/acre.Nutrient uptake from applied fertilizers is not 100% efficient—that is, not all the fertilizer applied is taken up by thetree, so more nutrients must be applied than the minimumrequired by the tree. N use efficiency, expressed as lb Nremoved by the crop divided by lb N applied, ranges from0.2 to 0.4 in groves with low to moderate yield. For healthycitrus trees, N efficiencies around 0.5 have been observed ingroves with a good production record. Application of 200lb N/acre supplies sufficient N for an 800 box/acre orangeyield when N use efficiency is 0.5.Effect of HLB on Nutrient UptakeNutrient uptake efficiency of HLB-affected trees may beat the low range of N use efficiency because of root loss(up to 80% depending on HLB severity). Therefore, anHLB-affected citrus grove picking 300 boxes per acre andrequiring 12 pounds of N per 100 boxes would need only 36pounds of N. However, assuming an N use efficiency of 0.2,the amount of fertilizer N required for the year would be 36divided by 0.2 or 180 pounds.Leaf Nutrient AnalysisLeaf analysis is a useful tool to detect problems and adjustfertilizer programs for citrus trees because leaf nutrientconcentrations are the most accurate indicators of sufficientnutrition of fruit crops. Leaves reflect nutrients takenup from the soil and redistributed throughout the plant,so the deficiency or excess of an element in the soil isoften reflected in the leaf analysis. Nutrient deficiency orexcess will cause citrus trees to grow poorly and producelower yields and/or fruit quality. Determining potentialnutritional problems should be a routine citrus-growingpractice. Quantifying nutrients in trees or soils with leafand soil analysis eliminates guesswork in adjusting afertilizer program.Leaf analysis should include N, phosphorus (P), potassium(K), calcium (Ca), magnesium (Mg), sulfur (S), manganese(Mn), zinc (Zn), copper (Cu), iron (Fe), and boron (B).Chlorine (Cl) concentration is sufficient under most fieldconditions, but Cl may become excessive where soil orirrigation water is saline. Similarly, molybdenum (Mo)deficiency or toxicity is rare. The goal in tissue analysis is toadjust fertilization programs such that nutritional problemsand their costly consequences from higher costs and loweryields are prevented.Leaf analysis integrates all the factors that might influencenutrient availability and uptake. It shows the relationship ofnutrients to each other. For example, potassium deficiencymay result from a lack of K in the soil or from excessiveCa, Mg, or sodium (Na). Similarly, adding N when K is lowmay result in K deficiency because the increased growthrequires more K.Tissue analysis: Determines if the soil is sufficiently supplying the essential nutrients. Confirms nutritional deficiencies, toxicities, orimbalances. Identifies “hidden” toxicities and deficiencies when visiblesymptoms do not appear. Evaluates the effectiveness of fertilizer programs. Provides a way to compare several fertilizer treatments. Determines the availability of elements not tested for byother methods. Helps in determining interactions between nutrients.Steps in Leaf AnalysisCitrus trees affected by HLB are typically low to optimumfor many nutrients, but sampling guidelines should befollowed precisely to ensure that analytical results aremeaningful.Procedures for proper sampling, preparation, and analysisof leaves have been standardized to achieve meaningfulcomparisons and interpretations. If done correctly, thereliability of the chemical analysis, data interpretation,fertilization recommendations, and adjustment of fertilizerprograms will be sound. Therefore, considerable careshould be taken from the time leaves are selected for2020–2021 Florida Citrus Production Guide: Nutrition Management for Citrus Trees2
sampling to the time they are received at the laboratory foranalysis.LEAF SAMPLE TIMINGfield observations and experiments conducted in differentcountries with different citrus varieties, rootstocks, andmanagement practices and are used to gauge citrus treenutrition throughout the world. Leaf samples must be taken at the correct time of year because nutrient concentrations within leaves continuouslychange. As leaves age from spring through fall, N, P, andK concentrations decrease, while Ca and Mg increase.However, leaf mineral concentrations are relatively stablefrom 4 to 6 months after emergence in the spring. The goal in nutrition management is to maintain leafnutrient concentrations within the optimum range everyyear. If the interpretation for a particular nutrient is notoptimum, various strategies can be used to address thesituation (Table 2). The best time to collect spring flush leaves of this age isJuly and August. If leaves are sampled later in the season,summer leaf growth can easily be confused with springgrowth.Soil Nutrient AnalysisLEAF SAMPLING TECHNIQUE A sampled citrus grove block or management unit shouldbe no larger than 20 acres. The sampler should make surethat the leaves taken represent the block being sampled. Each leaf sample should consist of about 100 leaves takenfrom nonfruiting twigs of 15 to 20 uniform trees of thesame variety and rootstock and under the same fertilizerprogram. Use clean paper bags to store the sample. Label them withan identification number that can be referenced when theanalytical results are received. Avoid immature leaves due to their rapidly changingcomposition. Do not sample abnormal-appearing trees, trees at theedge of the block, or trees at the end of rows because theymay be coated with soil particles and dust or have otherproblems. Do not include diseased, insect-damaged, or dead leavesin a sample. Select only one leaf from a shoot and remove it with itspetiole (leaf stem). Leaves should be washed with soapy water and rinsedwith distilled water within 24 hours of sampling.ANALYSIS AND INTERPRETATION The laboratory determines the total concentration of eachnutrient in the leaf sample. Because total concentration isdetermined, there should be no difference in leaf analysisresults between different laboratories. The laboratory usually interprets each result as deficient,low, optimum, high, or excess, but the citrus grower canalso interpret the results using UF/IFAS leaf analysis standards (Table 1). These standards are based on long-termSoil analysis measures organic matter content, pH, andextractable nutrients, which are useful in formulating andimproving a fertilization program. Soil analysis is particularly useful when conducted for several consecutive years sothat trends can be observed.Similar to leaf analysis, methods to determine organicmatter and soil pH are universal, so results should not differbetween laboratories. However, soil nutrient extractionprocedures vary from lab to lab. Several accepted chemicalprocedures exist that remove different amounts of nutrientsfrom the soil because they vary in strength. To draw usefulinformation from soil tests, consistency in use of a singleextraction procedure from year to year is important toavoid confusion when interpreting the amount of nutrientsextracted.A soil extraction procedure does not measure the totalamount of nutrients present, nor does it measure thequantity actually available to citrus trees. A perfect extractant would remove nutrients from the soil in amounts thatare exactly correlated with the amount available to theplant. Therefore, the utility of a soil testing procedure ishow well the extractable values correlate with the amountof nutrient a plant can take up. The process of relating thesetwo quantities is called calibration.A soil test is only useful if it is calibrated with plant response. Calibration means that as a soil-test value increases,nutrient availability to plants increases in a predictableway (Figure 2). Low soil-test values imply that a crop willrespond to fertilization with the particular nutrient. Highsoil-test values indicate the soil can supply all the plantneeds, so no fertilization is required (Figure 3). Cautionshould be taken on some high soil-test values, such as Caand P, where all extractable nutrient might not necessarilybe available for plant uptake, and supplemental fertilizermight be required.2020–2021 Florida Citrus Production Guide: Nutrition Management for Citrus Trees3
Steps in Soil SamplingStandard procedures for sampling, preparing, and analyzingsoil should be followed for meaningful interpretations ofthe test results and accurate recommendations.Soil Sample Timing In Florida, if soil samples are collected once per year, thebest time is at the end of the summer rainy season andprior to fall fertilization (September and October). Annual soil samples should be taken at the same time asleaf samples to save time and reduce cost.Figure 2. Ideal soil test calibration curve.Soil Sampling Technique The accuracy of soil-test interpretations depends onhow well the soil sample represents the grove block ormanagement unit sampled. Each soil sample should consist of one soil core takenabout 8 inches deep at the dripline of 15 to 20 treeswithin the area wetted by the irrigation system in thezone of maximum root activity. Areas sampled should correspond to the grove blockswhere leaf samples were taken. They should containsimilar soil types with trees of roughly uniform size andvigor.Figure 3. Soil test interpretation categories and their relationship toexpected fertilizer response.In Florida, soil testing for mobile, readily leached elementslike N and K has no value. In addition to organic matterand pH, soil testing is important for P, Mg, Ca, and Cu. TheUF/IFAS soil-test interpretations for P, K, and Mg usingMehlich 3 extraction were established from experimentsconducted for many years (Table 3).The single most useful soil test in a citrus grove is forpH. Soil pH greatly influences nutrient availability. Somenutrient deficiencies can be avoided by maintaining soil pHbetween 5.5 and 6.5. Deficiencies or excesses (toxicities) aremore likely when the pH is outside this range.In some cases, soil tests can determine the best way to correcting a deficiency identified by leaf analysis. For example,Mg deficiency may result from low soil pH or excessivelyhigh soil Ca. Dolomitic lime applications are advised if thepH is too low, but magnesium sulfate is preferred if soil Cais very high and the soil pH is in the desirable range. If soilCa is excessive and soil pH is relatively high, then foliarapplication of magnesium nitrate is recommended. Thoroughly mix the cores in a nonmetal bucket to forma composite sample. Take a subsample from this mixtureand place it into a labeled paper bag.Preparation for Analysis Soil samples should be dried in the oven before shippingto the laboratory for analysis.Analysis and Interpretation The basic soil analysis package run by most agriculturallaboratories includes soil pH and extractable P, K, Ca,and Mg. Organic matter is sometimes also part of thepackage, or it may be a separate analysis. Extractable Cuis normally determined upon request. The laboratory interprets each soil test result as very low,low, medium, high, or very high and may also providefertilizer recommendations accordingly. A citrus growershould independently interpret the numerical resultsaccording to UF/IFAS guidelines based on the Mehlich 3extractant used (Table 3). The interpretations should be used to make decisionsregarding soil pH control or fertilizer application (Table4).2020–2021 Florida Citrus Production Guide: Nutrition Management for Citrus Trees4
Recommended Fertilizer Rates andTimingYoung Tree (1 to 3 Years after Planting)NITROGENRecommended rates of N for the first three years a citrustree is in a grove can be found in Table 5. A constant supplyof N is essential to achieve maximum tree growth andearly fruit yield. It is recommended that controlled-releasefertilizer or fertigation be applied frequently (Table 5).PHOSPHORUShave substantial effects on production and fruit quality.Removal of elements by harvesting the crop becomessignificant but accounts for only part of the fertilizerrequirement.NITROGENRecommended N fertilizer rates (Table 6) provide enoughN for canopy expansion towards containment size whileproducing maximum economic yields of high quality fruit.The chosen N rate will depend on soil characteristics,yield potential, and tree needs as indicated by leaf analysisinterpretation (Table 1).If soil testing justifies P fertilizer application, test the soilagain the following year and compare with Table 3 todetermine if P fertilization can be decreased or omitted. Aleaf tissue-testing program for P should begin at this time,comparing the results with the standards in Table 1. For grapefruit, the recommended annual N rate is 120 to160 lb/acre.POTASSIUMMature Bearing Trees (8 Years in Grove)Apply K fertilizer at a K2O rate equal to the 1.25 times theN rate.CALCIUMIf the soil pH is in the optimum range of 5.5 to 6.5, there isno need to apply Ca. If soil pH is below 5.5, the soil shouldbe limed to pH 6.5, which will supply needed Ca. If soil pHis above 6.5, the soil will contain abundant Ca. At pH closeto 8, Ca will form precipitates.NUTRIENT MANAGEMENTApplying fertilizer in several small doses increases fertilizerefficiency by maintaining more constant nutrient availability and by reducing leaching if unexpected rain occurs(Table 4). A minimum of 4 to 6 applications of dry fertilizeris recommended. Splitting fertigation into 10 to 30 applications per year is common and desirable. The cost of liquidinjection during irrigation is relatively small, particularly ifthe injection can be automated. Two or three applications ofcontrolled-release fertilizer is satisfactory for HLB-affectedtrees because nutrients are protected from leaching rains.Controlled-release formulations may be applied preplant,incorporated after planting, or broadcast to ensure uniformdistribution of nutrients throughout the enlarging rootzone of young trees.Bearing Trees (4 Years in Grove)Nutrient management for bearing trees requires many ofthe same considerations important for nonbearing trees.Nitrogen continues to be the most important element fortree growth, fruit yield, and fruit quality, but others also For oranges and other varieties, the recommended annualN rate is 120 to 200 lb/acre.Once trees reach containment size, further canopy growthis not desired, so nutrition inputs can be stabilized andpossibly reduced. Nitrogen fertilizer management shouldfocus on replacing N exported with the harvested cropplus that needed to maintain tree biomass. The guidelinesfor annual N fertilizer rates accounts for the needs of bothvegetative growth and crop removal (Table 6). For grapefruit, the recommended annual N rate is 120to 160 lb/acre. The chosen N rate will depend on soilcharacteristics, desired fresh-fruit quality characteristics,yield potential, and tree needs as indicated by leaf analysisinterpretation (Table 1). For oranges, the annual N rate should fall within therange of 125 to 245 lb/acre. The recommended rate for aspecific grove depends on either expected yield potential(for 8-to-11-year-old trees) or 4-year running averageproduction history (for trees 12 years and older) expressed as either fruit yield or soluble solids production.When basing N fertilization on expected yield potential,the rate should be chosen considering 1) how well theyoung, bearing trees have produced, and 2) leaf tissueanalysis. If leaf N is maintained in the optimum range,additional fertilizer likely will not produce additionalfruit and may reduce quality.Leaching Rain Rule. If more than 3 inches of rainfallaccumulates within a 72-hour period after an N fertilizerapplication, “replacement” fertilizer may be applied within1 week up to one-half of the N rate used in the precedingapplication (not to exceed 30 lb/acre).2020–2021 Florida Citrus Production Guide: Nutrition Management for Citrus Trees5
PHOSPHORUSDetermine the need for P fertilization using leaf tissue andsoil test results. Sample leaves and soil. Compare the analytical results with the interpretationsprovided in Tables 1 and 2. Follow the P fertilization guidelines in Table 7.POTASSIUMApply K fertilizer at a K2O rate equal to 1.25 the N rate. Ifleaf K is consistently below optimum, increase the K2O rateby 25%, especially if the grove soil is calcareous.and September was found to maintain leaf concentrationsin the optimum range with improved canopy density andyield. For example, the UF/IFAS recommendation for Mnand Zn is five pounds metallic per acre per year; thus, treesreceiving three times UF/IFAS recommendation wouldreceive three applications for a total of 15 pounds metallicper acre per year.*Kelly T. Morgan, Robert E. Rouse, and Robert C. Ebel.2016. “Foliar Applications of Essential Nutrients on Growthand Yield of ‘Valencia’ Sweet Orange Infected with Huang longbing.” HortScience 51 (12): 1482–1493.CALCIUMIf the soil pH is in the optimum range of 5.5 to 6.5, there isno need to apply Ca. If soil pH is below 5.5, the soil shouldbe limed to pH 6.5, which will supply needed Ca. If soil pHis above 6.5, the soil will contain abundant Ca.Effect of Huanglongbing on MicronutrientRequirementsLeaf chlorosis develops as a result of infection with Candidatus Liberibacter asiaticus (CLas), including interveinalchlorosis of young leaves, similar in symptomology toMn and Zn deficiencies that develop early in the growingseason. Leaf chlorosis is followed by blotchy mottling ofolder leaves, which develops later in the growing season.Symptoms similar to those of nutrient deficiency developin HLB-affected trees, including K, P, Mg, Ca, Mn, Zn, andFe. HLB causes fibrous roots to decline within a few monthsafter infection and before foliar symptoms develop. Fibrousroots are responsible for the bulk of nutrient uptake, andtheir decline likely explains the deficiency symptoms thatdevelop in the canopy. Research has demonstrated thatHLB symptoms can be reduced by foliar applications ofmicronutrients, especially Ca, Mg, Mn, and Zn. Theseresponses have promoted development and use of enhancedfoliar nutritional programs in Florida. The efficacy of theseprograms has been a topic of considerable discussion anddebate. Fertilization programs have varied considerablyamong growers and have consisted of various rates and application schedules of essential macro- and micronutrients.Foliar nutrition applications are not likely to lead to pastproduction levels in the short term. Research* has foundthat maintaining leaf concentration of essential nutrientsincreased canopy volume and occasionally yield. Application of the current UF/IFAS foliar recommendations (Table8) three times per year following flushes in March, May,2020–2021 Florida Citrus Production Guide: Nutrition Management for Citrus Trees6
Table 1. Guidelines for interpretation of leaf analysis based on 4-to-6-month-old spring-flush leaves from nonfruiting twigs ofhealthy trees.12ElementUnit of MeasureDeficientLowOptimumHighExcessN% 2.22.2–2.42.5–2.72.8–3.0 3.0P% 0.090.09–0.110.12–0.160.17–0.30 0.30K% 0.70.7–1.11.2–1.71.8–2.4 2.4Ca% 1.51.5–2.93.0–4.95.0–7.0 7.0Mg% 0.200.20–0.290.30–0.490.50–0.70 0.70Cl%------ 0.20.20–0.70 0.701Na%---------0.15–0.25 0.25Mnmg/kg or ppm2 1818–2425–100101–300 300Znmg/kg or ppm 1818–2425–100101–300 300Cumg/kg or ppm 33–45–1617–20 20Femg/kg or ppm 3535–5960–120121–200 200Bmg/kg or ppm 2020–3536–100101–200 200Momg/kg or ppm 0.050.06–0.090.10–2.02.0–5.0 5.0Leaf burn and defoliation can occur at Cl concentration 1.0%.ppm parts per million.Table 2. Adjusting a citrus fertilization program based on leaf tissue analysis.NutrientWhat if it is less than optimum in the leaf? Options:What if it is greater than optimum in the leaf?Options:NCheck yield.Check tree health.Review water management.Review N fertilizer rate.Check soil organic matter.Review N fertilizer rate.PApply P fertilizer (see Chapter 8 of SL253).Do nothing.KIncrease K fertilizer rate (see Chapter 8 of SL253).Apply foliar K fertilizer.Decrease K fertilizer rate.CaCheck soil pH.Do nothing.MgCheck soil pH.Apply dolomite or Mg fertilizer.Do nothing.Check soil pH.Apply foliar micronutrients for immediate uptake.Include micronutrients in soil-applied fertilizer.Check for spray residue on tested leaves.Do nothing.MicronutrientsTable 3. Interpretation of soil analysis data for citrus using the Mehlich 3 extractant.ElementSoil Test InterpretationVery LowLowMediumHighVery Highmg/kg (ppm)1PMg2Ca2Cu 1010–1516–3031–60 60--- 1515–30 30---250 250 25425–5053 506parts per million (ppm) 2 lb/acre.A Ca-to-Mg ratio greater than 10 may induce Mg deficiency.3The UF/IFAS Extension Soil Testing Laboratory does not interpret extractable Ca. Work with Florida citrus trees suggests that a Mehlich 1 soiltest Ca of 250 mg/kg or greater is sufficient.4Cu toxicity is unlikely even if soil pH is less than 5.5.5Cu toxicity is possible if soil pH is less than 5.5.6Cu toxicity is likely unless soil pH is raised to 6.5.122020–2021 Florida Citrus Production Guide: Nutrition Management for Citrus Trees7
Table 4. Adjusting a citrus fertilization program based on soil analysis.Property or NutrientWhat if it is below the sufficiency value in the soil?Options:Soil pH1Lime to pH 5.5–6.5; pH in this range can avoid nutrientdeficiencies.Do nothing.Use acid-forming N fertilizer.Apply elemental sulfur.Change rootstocks.Do nothing (live with it).Apply organic material.Do nothing.PCheck leaf P status.Apply P fertilizer if leaf P is below optimum (seeChapter 8 of SL253 for further details).Do nothing.Organic matter212What if it is above the sufficiency value in the soil?Options:KApply K fertilizer.Lower K fertilizer rate.CaIf soil pH is 5.3, apply lime.Apply gypsum.Do nothing.Check leaf K and Mg status.MgIf soil pH is 5.3, apply dolomite.Check leaf Mg status.Do nothing.CuDo nothing.Lime to pH 6.5.The sufficiency value for soil pH is 6.0.There is no established sufficiency value for soil organic matter.Table 5. Recommended N rates and minimum number of applications for nonbearing citrus trees (1–3 years old).Year in Grovelb N/tree/yearLower Limit of Annual Application Frequency(range)Controlled-Release –0.601–410–2030.45–0.901–410–20Table 6. Recommended N rates and minimum number of applications for bearing citrus trees.Year in GroveOrangesGrapefruitOtherVarietieslb N/acre/year (range)Lower Limit of Annual Application FrequencyControlled-ReleaseFertilizerDry 0120–20013–4108 –2021 Florida Citrus Production Guide: Nutrition Management for Citrus Trees8
Table 7. Recommendations for P fertilization of bearing citrus trees based on leaf tissue and soil tests.If leaf tissue P is and soil test P is the recommendation for P fertilization is:ExcessiveHighVery HighHighMediumLowVery LowDo not apply P fertilizer to the soil for 12 months followingleaf and soil sampling, then sample again and reevaluate.OptimumVery HighHighMediumDo not apply P fertilizer to the soil for 12 months followingleaf and soil sampling, then sample again and reevaluate.OptimumLowVery LowApply 8 lb P2O5/acre for every 100 boxes/acre of fruitproduced during the current year. Sample leaves and soilagain in 12 months and reevaluate.LowLowVery LowApply 12 lb P2O5/acre for every 100 boxes/acre of fruitproduced during the current year. Sample leaves and soilagain in 12 months and reevaluate.DeficientLowVery LowApply 16 lb P2O5/acre for every 100 boxes/acre of fruitproduced during the current year. Sample leaves and soilagain in 12 months and reevaluate.Table 8. Recommended methods, timing, and rates for micronutrient application to citrus ilYes1NoYesYesYesFoliarWhen spring flush leaves reach full expansionSoilAny time as neededlb metallic equivalent/500 gallons of waterRatesFoliar3.755.03.750.25---1See below2lb metallic equivalent/acreSoil129---5Soil applications of Mn are not recommended on calcareous soils.Acid soil: Fe-EDTA, 20 grams/tree; Calcareous soil: Fe-EDDHA, 50 grams/tree.2020–2021 Florida Citrus Production Guide: Nutrition Management for Citrus Trees9
on various aspects of citrus nutrient management and are noted as such with published papers cited. *Nutrition of Florida Citrus Trees, 3rd Edition by Kelly T. Morgan and Davie Kadyampakeni (eds.) (2020) Fertilizer, Nutrition Uptake, and Yield Response This section describes the typical citrus yield increase with added fertilizers.