Transcription
Price Distortions inIndian AgricultureShweta Saini and Ashok Gulati
Price Distortions in Indian Agriculture
Price Distortions inIndian AgricultureShweta Saini and Ashok GulatiShweta Saini is a Senior Consultant and Ashok Gulati is Infosys Chair Professor for Agriculture at IndianCouncil for Research on International Economic Relations (ICRIER), New DelhiCorresponding authors’ emails: shwetasaini22@gmail.com and agulati115@gmail.com
2017 International Bank for Reconstruction and Development / The World Bank1818 H Street NWWashington DC 20433Telephone: 202-473-1000Internet: www.worldbank.orgWorld Bank Studies are published to communicate the results of the Bank’s work to the developmentcommunity with the least possible delay. The manuscript of this paper therefore has not beenprepared in accordance with the procedures appropriate to formally edited texts.This work is a product of the staff of The World Bank with external contributions. This papercarries the names of the authors and should be cited accordingly. The findings, interpretations,and conclusions expressed in this work do not necessarily reflect the views of The World Bank,its Board of Executive Directors, or the governments they represent. The World Bank does notguarantee the accuracy of the data included in this work. The boundaries, colors, denominations,and other information shown on any map in this work do not imply any judgment on the part ofThe World Bank concerning the legal status of any territory or the endorsement or acceptance ofsuch boundaries.Nothing herein shall constitute or be considered to be a limitation upon or waiver of the privilegesand immunities of The World Bank, all of which are specifically reserved.Cover photos: CRS PHOTO / Shutterstock.com, Arti Arun / Shutterstock.com, Dana Ward / Shutterstock.com.
ContentsList of Tables viList of ecutive Summary xiiiBackground of the Study 1Section I: India’s Trade and Domestic Policy Landscape 5India’s Domestic Agricultural Policies 6India’s Agricultural Trade Policy 10Section II: Study Methodology 19Section III: Commodity-Wise Analysis 25Cereal: Wheat 25Cereal: Rice 30Cereal: 41Oilseeds: Groundnut, Soybean, and Rapeseed and Mustard Seed 46Soybean � 52Rapeseed and Mustard Seed 56Dairy: Skimmed Milk Powder (SMP) 59Livestock: Buffalo Meat 64Cash Crop: Sugarcane (Refined Sugar) 69Cash Crop: Cotton 75Vegetable: Onion 80Vegetable: Potato 85Fruit: Banana 88Fruit: Mango 91Section IV: Analysis and Conclusions 95Conclusion 05Appendix 111v
List of TablesTable 1 Commodity Coverage of the Study 1Table 2 Percent Share in Value of Agriculture and Livestock Output (2004–05 Prices) 2Table 3 Trends in Customs Duties for Agri-commodities 14Table 4 India’s Agricultural Trade Policy (2015) 15Table 5 Major Producing States and Ports 20Table 6 Global Wheat Area, Production, and Yields 2013 25Table 7 Customs Duty on Wheat 29Table 8 Customs Duty on Maize Imports 38Table 9 India’s Major Pulse Exports 41Table 10 Major Pulse Imports of India 41Table 12 Global Gram Statistics 2013 42Table 11 Top Export and Import Destinations of Major Pulses from India 42Table 13 Import Policy for Pulses as of January 2016 43Table 14 India’s Oilseeds and Edible Oil Trade Policy 2015 48Table 15 Stages of Marketing Groundnut 53Table 16 Percentage of Skimmed Milk Powder in India’s Total Dairy Exports 60Table 17 Import Duty on Sugar 73Table 18 Adoption wof Bt Cotton in India 77Table 19 Import Duty on Cotton H-4 80Table 20 Trade Status of the 15 Commodities, 2004–05 to 2013–14 95Table 21 Commodity-wise Estimates of NPCs (2004–05 to 2013–14) 97Table 22 Average NPCs 98Table 23 Commodity wise NPC Trade-adjusted estimates 99Weighted Average NPCs for Exportables, Importables, and Total 111Annexure Estimates for Nominal Rates of Protection (NRPs),2004–05 and 2013–14 111vi
List of FiguresFigure 1 Changing Indian Food Consumption Patterns 6Figure 2 India’s Cereal and Pulses’ Production 9Figure 3 India’s Exports and Imports of Agri-Commodities 11Figure 4 Composition of Indian Agricultural Exports FY2015 12Figure 5 Trends in the MSP of Rice and Wheat Since 2001–02 17Figure 6 India’s Wheat Area, Production, and Yields 26Figure 7 Trends in Value and Volume of Wheat Exports, 2002–03 to 2014–15 28Figure 8 India’s Wheat Trade 28Figure 9 NPCs of Wheat at Wholesale Level 30Figure 10 India’s Rice Exports in MMT, 1990–1991 to 2014–2015 32Figure 11 October 2003–14 Rice Stock Levels with FCI 33Figure 12 India’s Rice Area, Production and Yield, 2013–14 34Figure 13 NPCs of Common Rice at Wholesale Level 36Figure 14 Value and Volume of Indian Maize Exports since 2002–03 37Figure 15 Trends in India’s Maize Production and Yield 38Figure 16 Production and Prices of Maize since 2004–05 39Figure 17 NPCs of Maize at Wholesale Level 40Figure 18 Value and Volume of Indian Gram Exports Since 2002–03 43Figure 19 Trends in India’s Gram Production and Yield 44Figure 20 Gram MSPs and Production Response 44Figure 21 Pulses’ Production, Area and Yields 45Figure 22 NPCs of Gram at Wholesale Level 46Figure 23 Indian Edible Oil Imports- Value and Volume 47Figure 24 Indian Soybean Exports: Quantity and Value 49Figure 25 India’s Soybean area, Production, and Yields 50Figure 26 Estimates of NPCs at Wholesale Level 51Figure 27 Indian Groundnut Exports: Value and Volume 53Figure 28 International Reference Prices vs. Indian WH Price and Export Quantity 54Figure 29 Estimates of NPCs for Groundnut at Wholesale Level 55Figure 30 Value and Volume of Indian R&M Seed Exports 57Figure 31 Comparing R&M Prices and Exports 58Figure 32 Estimates of NPCs for R&M Seeds at Wholesale Level 59vii
Figure 33 Production of Liquid Milk by States 61Figure 34 Quantity of SMP Exports and Imports 61Figure 36 Value and Quantity of SMP Exports 62Figure 37 NPCs of SMP at Wholesale Level 63Figure 38 Production of Buffalo Meat vs. Cow Meat in India since 1999–2000 65Figure 39 Value, Quantity, and Annual Growth of Exports 67Figure 40 NPCs of Buffalo Meat at Wholesale Level 68Figure 41 Production of Cane and Refined Sugar 70Figure 42 Area and Fair and Remunerative Price of Sugarcane 70Figure 43 Export-Import of Total Sugar in India 72Figure 43 Export-Import of Sugar in India (Raw Sugar) 72Figure 44 Export-Import of Sugar in India (Refined Sugar) 73Figure 45 NPC and Export Values of Refined Sugar 75Figure 46 India’s Production vs. Yield of Cotton 76Figure 47 India’s Cotton Import and Export Trends 77Figure 48 MSP for Cotton 78Figure 49 NPCs of Cotton at Wholesale Level 79Figure 50 India’s Onion Area, Production, and Yields 81Figure 51 India’s Onion Exports: Value and Volume 82Figure 52 MEP of Onions for 2013–14 and 2014–15 82Figure 53 NPCs of Onions at Wholesale Market Level 84Figure 54 India’s Potato Exports: Value and Volume 85Figure 55 India’s Potato Area, Production, and Yields 2013 86Figure 56 NPCs of Potato at Wholesale Market Level 87Figure 57 India’s Banana Exports: Value and Volume 89Figure 58 India’s Banana Area, Production, and Yields 90Figure 59 NPCs of Banana at Wholesale Market Level 91Figure 60 India’s Mango Exports: Value and Volume 92Figure 61 NPCs of Mango at Wholesale Market Level 93Figure 62 Trade Status of 15 Commodities (Percent in 10 years) 96Figure 63 10-Year average Trade-adjusted NPCs 100viii
PMCBAHSBPLBt cottonC&F ed Pulses Production ProgramAntyodaya Anna YojanaAgricultural Marketing Information NetworkDepartment of Agriculture, Cooperation and Farmers Welfare, MoA, GoIAndhra PradeshAgricultural Prices CommissionAgricultural and Processed Food Products Export Developmentabove poverty lineAgricultural Produce Market Committee ActBasic Animal Husbandry and Fisheries Statisticsbelow poverty linegenetically modified organism (GMO) cotton varietycarrying and forwarding agentsCommission for Agricultural Costs and Pricescompound annual growth rateCotton Corporation of IndiaConsultative Group on International Agricultural Researchcost, insurance, and freightcentral issue priceCentral Potato Research Institutecarcass weight equivalentcalendar yearDirectorate of Economics and StatisticsDirectorate General of Anti-Dumping and Allied DutiesDirectorate General of Commercial Intelligence and StatisticsDirectorate General of Foreign TradeDepartment of CommerceEssential Commodities Act, 1955electronic data interchangeExport Inspection Councileffective protection coefficienteffective subsidy coefficientEuropean Unionfinancial assistanceFood and Agriculture OrganizationUSDA Foreign Agricultural ServicesFood Corporation of Indiafarm harvest pricesfree on boardix
r-producer organizationfair and remunerative priceForeign Trade Policyfinancial yearfive-year planGeneral Agreement on Tariffs and TradeGujarat Co-operative Milk Marketing Federation Ltd.gross domestic productGlobal Food Crisis of 2007–08genetically modifiedgroundnut kernelsGovernment of Indiahybrid 4HectareHarmonized Commodity Description and Coding SystemHigh-yielding varietyHigh-Yielding Variety ProgrammeIndian Council of Agricultural Researchinland container depotInternational Crops Research Institute for the Semi-Arid TropicsIndian national rupeeIndian Oilseeed and Produce Export Promotion CouncilIndian Sugar Mills AssociationIndian Tobacco CompanyJawaharlal Nehru Port Trust, also called Nhava Shevakharif marketing season (October–September)LakhMerchandise Exports from India Schememinimum export pricemost favored nationmillion hectaresmillion metric tonnesMetric tonne per animalMinistry of AgricultureMadhya Pradeshminimum support pricesmarketing yearNational Agricultural Cooperative Marketing Federation of India Ltd.National Dairy Development BoardNational Family Health SurveyNational Food Security Act, 2013National Food Security Mission, 2007nominal protection coefficient
NRANRPNSSOOGLPDSPL480PPPPSSR&M TPDSTPSTRQUN comtradeUNCTADUPUS HRWUSDAUSDA-ERSUTUVVKGUYWHWTOnominal rate of assistancenominal rate of protectionNational Sample Survey Organizationopen general licensePublic Distribution SystemPublic Law 480peanut and peanut productsprice support systemrapeseed and mustard seedReserve Bank of Indiarabi marketing season (April-June)Revealed Comparative Advantageright hand siderelative rates of assistancerevenue sharing formulastate advised pricesingle cross-hybrid seedsskimmed milk powderstatutory minimum priceState Trading Corporation of Indiastate trading enterprisespecial countervailing dutytransport assistancetriennium endingTamil NaduTargeted Public Distribution Systemtrue potato seedtariff rate quotaUnited Nation Commodity Trade statistics databaseUnited Nations Conference on Trade and DevelopmentUttar PradeshU.S. Hard red winter No.2 wheat varietyU.S. Department of AgricultureUSDA Economic Research Serviceunion territoryunit valueVishesh Krishi and Gram Udyog Yojanastate-wise wholesale pricesWorld Trade Organizationxi
AcknowledgementsThis study is supported by the World Bank as a part of their multi-country project on this subject.We express our sincere thanks to the World Bank for entrusting this job to the Indian Councilfor Research on International Economic Relations (ICRIER). The authors would like to thankDr. Alberto Valdes, Dr. Will Martin and Dr. Donald F Larson for their valuable inputs during theresearch and Ms. Shreya Sarkar and Mr. Rajat Kochhar, former Research Assistants at ICRIER,for their contribution to the first Draft of this Report. The authors would also like to thank Directorate of Economics and Statistics (DES), Ministry of Agriculture and Farmers Welfare, andespecially Mr. Battu Lal Meena, Additional Economic Advisor at DES; Ms. Madhusmita Patra,Secretary General, Indian Railways Conference Association, New Delhi; Mr. Manoj Kumar fromOnline Cargo, and Mr. Sumit Gupta and Mr. Senthil Elangannan at Adani Agri Logistics Limitedfor providing vital data help and inputs for the research.xii
Executive SummaryThe current study is about estimating the extent to which domestic prices of major Indian agriculture commodities deviate from their corresponding free trade reference prices. The freetrade reference prices are the estimated export-parity reference prices in cases of exportedcommodities and import parity reference prices in cases of imported commodities. The deviation between domestic and free trade reference prices is termed as “distortion” which can resultfrom price- and trade-related policies.The extent of price distortions is analyzed using estimates of the “nominal rates of protection”(NRPs) and “nominal protection coefficients” (NPCs). The estimates are at the wholesale marketlevel. The study spans 15 agri-commodities, 11 Indian states that are the major producing statesof the identified commodities, and 5 ports through which the majority of trade of identifiedcommodities happens. The study period is 10 years, 2004–05 to 2013–14.Analysis of estimated coefficients shows that the domestic prices of the 15 commodities overthe 10–years (2004–05 to 2013–14) were on average 72 percent of the time below the exportparity prices, 11 percent of the time above the import parity prices, and 17 percent of the timebetween export parity and import parity prices. In commodities like rice, groundnut, cotton,buffalo meat, onion, banana, and potato, Indian prices were 90 to 100 percent of the time belowtheir corresponding export parity prices. For sugar and skimmed milk powder (SMP), domesticprices were above import parity prices in most of the years. India’s soybean, maize, and wheatprices were largely in the non-tradable band. However, fluctuating global prices saw domesticprices of soybean, wheat, and maize appear sometimes larger than its import party prices andsometimes lower than its export reference prices. The study also observed the influence of theglobal food crisis of 2007–08 and the resultant increased export opportunities for several Indianagri-commodities.In most years, for the majority of agri-products, the policy makers used restrictive export policies to keep domestic prices low. This showed the pro-consumer bias in the policy complex.This means that policies more than often harm the farmers’ interests, whose scope of gettinghigher returns globally are curbed at the prospect of the trade translating into rising domesticprices. To compensate the farmers, the Government made significant advances in the minimumsupport prices (MSP) and input subsidies, especially for basic staples like rice and wheat.The trade policies themselves were also subservient to the overall goal of ensuring food securityto the country’s poor consumers. After meeting domestic needs for consumption and stocking,the residual determined the broad direction of agri-trade policies in the country each year. Anypossibility of price hikes in agriculture in general and food in particular led policy makers torestrict trade. Ensuring food security of its poor consumers takes policy precedence over anywelfare-distorting global scenario.Over the years, even though India’s agri-trade as a percentage of agri-GDP increased from lessthan 5 percent in 1990–91 to about 20 percent by 2013–14, it still has not reached its full potential. In order to improve the sector, this study recommends the following policy reforms: (1)xiii
phase-out the built-in consumer bias (that is anti-farmer) in agri-policies; (2) create businessspace for private players to have integrated markets across space and time; (3) use an incomepolicy approach (through direct cash/benefit transfer) to protect both poor consumers andsmall farmers; (4) create a predictable and a stable agri-trade policy; and (5) streamline the highcustoms duties on India’s export-competing products like rice.xiv
Background of the StudyThe current study updates the research done earlier by Garry Pursell, Ashok Gulati, and Kanupriya Gupta (Pursell, Gulati, and Gupta 2007) and Garry Pursell (1999). The 2007 Pursell etal. study had estimated the nominal rates of assistance (NRAs) and relative rates of assistance(RRAs) for 13 commodities for a period of 41 years between 1964 and 2004. The present studyextends the work from 2004–05 to 2013–14 and estimates nominal rates of protection (NRPs)and nominal protection coefficients (NPCs) for 15 agri-commodities. Table 1 categorizes these15 commodities.Table 1 Commodity Coverage of the StudyCereals and pulsesCommon rice, wheat, maize/corn, gram/chickpeaOilseedsGroundnut, soybean, rape and mustard seedCash cropsSugarcane (refined sugar), cotton (lint)Dairy and livestockBuffalo meat, skimmed milk powder (SMP)HorticultureOnion, potato, mango (alphonso), banana (Cavendish)The listed commodities represent more than 67 percent of the total value of agricultural andlivestock output in 2010–11 (Table 2). Milk (20 percent), paddy (10 percent), wheat (7 percent),and meat (5 percent) are the most important products, in that order.Among cereals, the study focuses on rice (the common rice variety), wheat, and maize. Indiaexports two main categories of rice: basmati and common rice. About 67 percent of India’s riceexport basket in the triennium ending (TE) 2014–15 was of common rice. The country followsdifferent trade policies for both types of rice: while basmati rice is more open for exports, thecommon variety is subject to periodic bans and other restrictions.Among pulses, the study focuses on gram. Although India is a net importer of pulses, at times itdoes export limited quantities, especially of chickpea and some organic pulses. India produces alarge number of pulses, like gram (chickpea), tur (pigeon pea), moong (green gram), urad (blackgram), and lentils, among others. In terms of share in production and export of pulses, gramis the most important pulse. In 2013–14, 48 percent of total pulses produced and 97 percent oftotal pulses exported from India were gram (chickpea/garbanzo).1
Table 2 Percent Share in Value of Agriculture and Livestock Output (2004–05 Gram1.31.01.31.11.31.21.21.41.21.41.51.4Sugar onwith rcentof urce: Department of Agriculture, GoIIndia is a very important player in the oilseed market. Its diverse agro-ecological conditions arefavorable for growing as many as nine oilseeds, namely groundnut, rapeseed and mustard seed,soybean, sunflower, safflower, sesame, niger, castor, and linseed. In 2014–15, India produced32.8 MMT of oilseeds comprising groundnut (30 percent), soybean (36 percent), rapeseed andmustard seed (24 percent), and the remaining 10 percent, others. For the current study, the tradeand production patterns of groundnut, soybean, and rapeseed and mustard seed are studied.Even though India is not an important exporter of the seeds globally, it plays a significant rolein global oil meal exports especially of oilseeds like groundnut and soybean.India is the largest milk producer globally. Milk’s share in the country’s value of agricultural andlivestock output is also the highest. India is largely self-sufficient in milk, with only very smallquantities being exported or imported at times. The trade in milk is mainly in the form of milkpowder and dairy products. In the triennium ending 2014–15, 66 percent of the country’s dairyexports were in the form of skimmed milk powder (SMP). The current study focuses on SMP.India emerged as the largest bovine meat (buffalo) exporter globally as per trade numbers fortriennium ending 2014–15, qualifying buffalo meat’s inclusion in the current study. There is amajor transitional story behind this commodity and that is detailed in the commodity sectionon buffalo meat.Sugarcane and kapas (raw cotton or seed cotton) hold about equal share in the value of output ofIndia and are amongst the most important cash crops. As both crops are traded mostly in theirprocessed or transformed forms i.e. sugarcane as sugar (raw and refined) and kapas as cotton2
lint (cotton fiber separated from cottonseed), they are studied here in these transformed form.Additionally, as most of the traded sugar is in its refined form, the study focuses on refined sugar.As per the triennium ending 2014–15 trade numbers, India became the second largest cottonexporter in the world, second only to Unites States. In case of sugar, the largest exporter wasBrazil followed by Thailand, Australia, Mexico, and India (in that order).In the horticulture sector, covered commodities include banana, onion, potato, and mango. Anaverage Indian plate has a greater share of fruits and vegetables now than it did 10 years ago(NSSO 2013). Potato, onion, mango, and banana are the most important vegetables and fruitsfor the country today.The key question the authors seek to answer in this study is: How far do domestic prices of major Indian agri-commodities deviate from free trade reference prices (export parity or importparity)? In other words, what is the level of “distortion” between domestic and internationalreference prices? Further, the study investigates what policies—especially regarding trade andpricing, institutions, and infrastructure—cause these “distortions” in domestic prices. Answering the questions would also give an idea of whether Indian trade and price policies have a builtin bias toward consumers or producers. The study also looks at how Indian agricultural tradeflows have evolved with respect to global markets, as well as to the domestic agri-GDP, giving afeel of the degree of domestic market integration with global markets. Of special interest, is theinfluence of the global food price crisis of 2007–08: How did it affect India’s trade and domesticpolicies especially regarding its staples, rice, and wheat? And finally, what could explain thepattern of price distortions across commodities within India’s agriculture sector?The study answers these questions by estimating and analyzing nominal protection coefficients(NPCs) and nominal rates of protection (NRPs) for 15 agricultural commodities. NPC is a ratiobetween the average price received by the farmer (at wholesale market level) and the adjustedborder price (at wholesale market level). By subtracting one from the NPC ratio, we estimatethe NRP. The border prices are adjusted for quality, port-handling charges, marketing margins,and domestic transportation to be measured at the wholesale market level, for comparison withthe farmer prices at the wholesale level. Analysis and interpretation of these ratios across timereveals extent of market and price distortions prevalent in a commodity’s market. This reportstudies the extent and causes of such distortions.It may be noted that NPCs and NRPs in this study are estimated at the wholesale market levelrather than at the conventional farm-gate level, reasons for which are elaborated in upcoming sections. State-level data were calculated and analyzed. The analysis helps in identifyingpolicy-level interventions that could promote overall efficiency in the Indian agri-landscape,especially the efficiency on its marketing and trade fronts.The report is organized as follows: Section I provides the historical trade and policy landscapeof India. Section II shares the methodology used for estimating NPCs. Section III presents relevant details for each of the 15 commodities. Each commodity section begins by putting India’strade and production performance in international perspective and progresses by mapping itsdomestic scenario, eventually estimating and analyzing the NPCs/NRPs. Section IV analyzesthe entire set of NPCs, and synthesizes the work to identify conclusions from the study. It alsoencapsulates what was learned in the study and presents the way forward.3
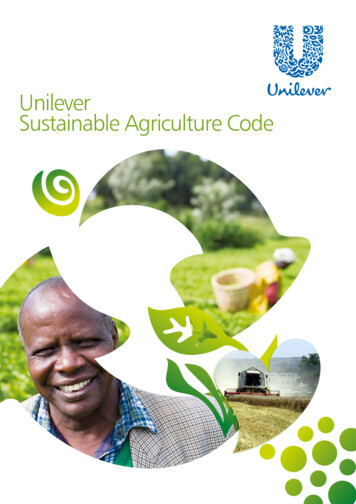
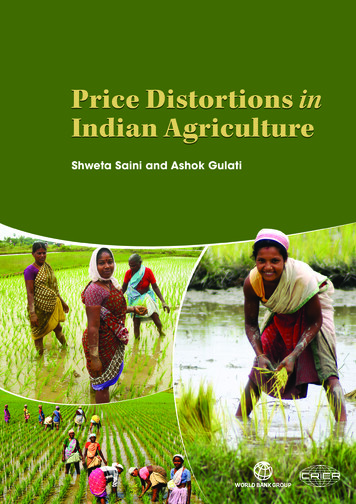
Section I:India’s Trade and Domestic PolicyLandscapeAgriculture is an important sector of the Indian economy, even though its contribution tooverall GDP has fallen from 52 percent in 1950–51 to about 30 percent in 1990–91 and17.4 percent in 2014–15. (Source: NAS) The two important reasons for agriculture’s centrality are: it still engages almost 55 percent of the country’s workforce, as per the 2011 census,and an average Indian household still spends (in 2011–12) almost 45.5 percent of its expenditureon food (Source: NSSO).The country’s economic standing and its policy landscape have come a long way since the 1950s.A country that was once food-scarce and food importing is today grain-surplus and net grainexporting. Its production base is reasonably strong and growing. Its agriculture showed resilience during the 2014–15 and 2015–16 consecutive drought years when the annual grainproduction remained around 252 million metric tonnes (MMT). Globally, India is the largestproducer of milk, cotton (in 2013–14), banana, and mango, and is among the largest exportersof rice, bovine/buffalo meat, onion, and cotton to the world. By ensuring enough supplies atthe macro-level, the country has attained food security at the national level; however, at themicro-level, food insecurity is widespread and deep-rooted.India has one-sixth of the world’s population and one-third of the world’s poor. One-third ofthe world’s malnourished children are Indians (Foundation N. 2011). India’s 2005–06 “NationalFamily Health Survey” (NFHS-3) stated that almost half of India’s children under the age of fiveyears were chronically malnourished.1Besides this, Indian agriculture is a small-holder agriculture. According to the Agriculture Census 2010–11, the total number of operational holdings in India was 138.35 million with an average holding size of 1.15 ha (MoAFW 2015). Of the total holdings, 85 per cent are in marginaland small farm categories of less than 2 ha. These small farms operate on 44 percent of thecountry’s land under cultivation. They have limited access to technology, agricultural inputs,credit, capital, and markets but still play an important role as providers of food and nutritionalsecurity to the nation.Despite improvements in per capita incomes, Indian consumption remains cereal-centric andfood continues to be a large component of monthly consumption expenditures of an average Indian. India’s consumption basket has, however, evolved overtime: the percent share of monthlyexpenditure spent on food has fallen from 60.6 percent in 1993–94 to 45.5 percent in 2011–12and similarly, share of food expenditure spent on cereals has reduced from 34.4 percent to 22.9percent (Source: NSSO 2011) (Figure 1).1Chronic malnutrition is an indicator of linear growth retardation in children that results from failure to receiveadequate nutrition over a long period and may be exacerbated by recurrent or chronic illness.5
Figure 1 Changing Indian Food Consumption PatternsData Source: NSSO 2011Even though cereals are increasingly substituted with high-value agriculture, which includesfruits, eggs, fish, meat, and milk, the relative nutrition dependence on cereals is still indisputablyhigh for an average Indian household.It is not surprising that in such an economy, which still centres on agriculture, where landholdings are shrinking and where large percent of poor and food insecure people live, the Government has had to regularly devise food-security policies and programs. Even the country’sagricultural trade policies are secondary to this goal of food-security. After meeting the domestic needs for consumption and stocking, the net position determines the broad direction ofinternational trade in a year. Especially for basic staples like rice and wheat, the deep-rootedquest for self-sufficiency in food has long guided the country’s agricultural domestic and tradepolicies for cereals. The next section provides a brief overview of Indian domestic and international agricultural policies.India’s Domestic Agricultural PoliciesAs mentioned, agriculture policy in India is heavily influenced by the overarching goal of foodsecurity at the national level. The Five-Year Plans (FYPs) prepared by Indian Planning Commission2 are subservient to that goal and accordingly outline the country’s policies. The currentlyimplemented Plan is the 12th FYP (2012–17) and aims, among other things, to improve agricultural investments, income, products, and productivity and to promote research and extensionand resource-use efficiency for ensuring profitable and sustainable agriculture. To these
Price Distortions in Indian Agriculture Shweta Saini and Ashok Gulati . Commodity-Wise Analysis 25 Cereal: Wheat 25 Cereal: Rice 30 Cereal: Maize 37 Gram-Chickpea 41 Oilseeds: Groundnut, Soybean, and Rapeseed and Mustard Seed 46 . Figure 7 Trends in Value and Volume of Wheat Exports, 2002-03 to 2014-15 28