Transcription
Some Animals Are More Equal thanOthers: Trophic Cascades and KeystoneSpeciesNAMEShort FilmStudent HandoutDATEThis handout supplements the short film Some Animals Are More Equal than Others: Trophic Cascades andKeystone Species.1. True/False. All members of a food web are equal in abundance and in their relative effects on one another.2. Explain the reasoning or evidence you used to answer Question 1.3. True/False. Every member of a food web is the prey of another member of the food web.4. Explain the reasoning or evidence you used to answer Question 3.5. Which statement below explains why the mussels in Mukkaw Bay were able to quickly cover the rockface inPaine’s experiment?a. The starfish took up most of the room on the rocks, and when the starfish were removed, the musselsoccupied the empty spaces.b. Paine added more mussels to the rocks, causing the starfish to move to other habitats.c. The starfish were competing directly with the mussels for food, and removing the starfish allowed themussels more access to the food.d. Starfish feed on mussels, so when the starfish were removed the mussels no longer had a predator andtheir populations grew unchecked.6. In the film, Paine recalls that a year after the starfish had been removed, the number of species decreasedfrom 15 to eight, after three years the number went down to seven, and after another seven years it wasalmost all only mussels. In the control plots the number and diversity of species was basically unchanged.Which statement(s) best explain(s) these results?I.Keystone species are critical to the diversity and stability of an ecosystem.II.When a predator is removed, the prey of that predator always increases and species noteaten by the predator always decrease.III.The disappearance of producers from an ecosystem can cause the number of predators toincrease.a. I onlyb. I and II onlyc. II and III onlyd. I, II, and IIEcologywww.BioInteractive.orgRevised January 2018Page 1 of 5
Some Animals Are More Equal than Others: Trophic Cascades and Keystone SpeciesShort FilmStudent Handout7. Before the 1960s, most ecologists thought that the number of producers in an ecosystem was the onlyvariable that limits the number of herbivores. The idea was that every level was regulated by the amount offood from the trophic level below it.a. How did the green world hypothesis differ from this “bottom-up” view?b. Imagine a simple food chain: Grass - Grasshoppers - Mice. If snakes that eat mice are added to theecosystem, how would you redraw the food chain to represent this change?c. After the snakes are added, would you expect the amount of grass to increase or decrease? Explain yourreasoning.Ecologywww.BioInteractive.orgRevised January 2018Page 2 of 5
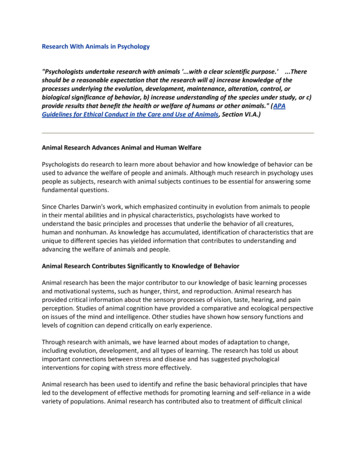
Some Animals Are More Equal than Others: Trophic Cascades and Keystone SpeciesShort FilmStudent HandoutFigure 1. Since 1972, Dr. JimEstes had been studying a foodchain of kelp - urchins - seaotters, and then in the early1990s orcas began eating thesea otters. The data collected byDr. Estes are shown. Panel Ashows sea otter abundancearound four different islandsfrom 1972 to 1997. Panel Bshows the amount of seaurchins (sea urchin biomass) in1987 and 1997. Panel C showsthe amount of kelp that seaurchins ate over a 24-hourperiod (grazing intensity) in1991 and 1997. Panel D showsthe number of kelp plants withina specific area (density of kelp)in 1987 and 1997. The thicknessof the arrows illustrates thestrength of the effect onespecies has on the speciesbelow it in the food web.Refer to Figure 1 for questions 8 through 11 below.8. In 1997, which species is the apex predator in the food chain?a. Killer whalesb. Sea ottersc. Sea urchinsd. Kelp9. Which of the following statements describes the data in Figure 1?a. An increase in sea urchin biomass is associated with more intense grazing.b. An increase in sea urchin biomass is associated with greater kelp density.c. Predation of sea otters by killer whales is associated with greater kelp density.d. Sea otter abundance was relatively stable from 1972 to 1997.Ecologywww.BioInteractive.orgRevised January 2018Page 3 of 5
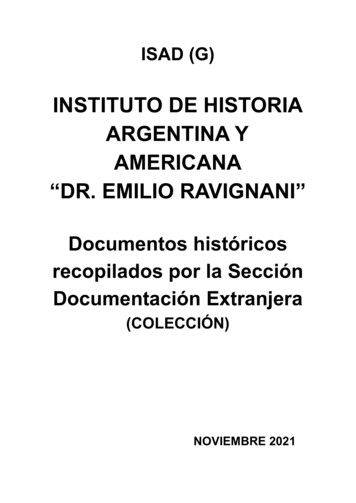
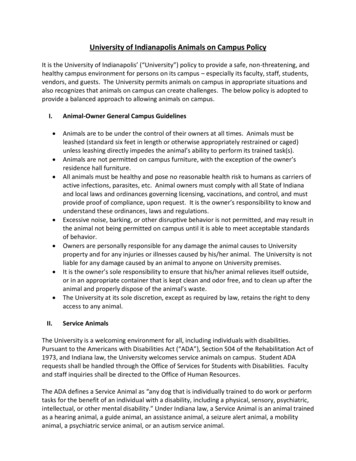
Some Animals Are More Equal than Others: Trophic Cascades and Keystone SpeciesShort FilmStudent Handout10. Complete the following sentence. Figure 1 illustrates that when orcas started eating sea otters, the sea otterpopulation , the urchin population , and the kelppopulation .a. decreased, decreased, decreasedb. decreased, increased, decreasedc. increased, decreased, increasedd. increased, increased, increased11. The arrows on the left and right sides of Figure 1 show the effects of one species on the species that are onlower trophic levels. Thicker arrows indicate a large effect and thin arrows a smaller effect. The arrows onthe left show a system in which there are a lot of sea otters. The arrows on the right show a system in whichthere are few otters. Explain why the down-pointing arrows on the left side of the figure look different fromthe arrows on the right side of the figure.In the 1990s, ecologists Deborah Letourneau and Lee Dyer studied a tropical forest shrub called the piper plantand the various species of insects that live on and near the shrub. A species of ant uses the piper plant as ahome by hollowing out some of its branches and building colonies inside the hollow branch cores. The ants donot eat the plant’s leaves. Instead, the leaves are consumed mostly by caterpillars. When the ants encountercaterpillars or caterpillar eggs on the plant’s leaves, they either eat them or kick them off. Letourneau and Dyeradded beetles that eat ants. Figure 2 shows the results of one of Letourneau and Dyer’s experiments in whichthey compared the leaf area of piper plants in control plots to that of experimental plots to which they hadadded beetles that eat ants.Leaf Area per Plant (cm2)Leaf Area per Plant (cm2)Mean Leaf Area per Plant Over 18 Monthswithout beetlewithout beetlewith beetlewith beetleMonthsAfterStart of ExperimentMonths AfterStartof ExperimentEcologywww.BioInteractive.orgFigure 2. Mean leaf area pertree. Initial measurementswere taken before (0 to 2months) and after (7 to 18months) beetles were addedto 40 of 80 plants. The lightgray round markers representmeasurements taken of thecontrol plots, to which beetleswere not added. The blacksquare markers representmeasurements taken of theexperimental plots, to whichbeetles were added.Measurements were made onall leaves to calculate themean leaf area per plant.Error bars represent standarderror of the mean.Revised January 2018Page 4 of 5
Some Animals Are More Equal than Others: Trophic Cascades and Keystone SpeciesShort FilmStudent HandoutRefer to the figure to answer questions 12 through 17.12. For both the plots with the beetles added and the control plots, state the mean tree leaf area per plot thatthe scientists recorded after running the experiment for 18 months.13. Compare the trends in mean tree leaf area per plot for both the plots with the beetles added and thecontrol plots over the 18 months of the experiment.14. Draw two diagrams that show the food chains for both the experimental and control plots. Includeinteractions among predatory beetles (if present), ants, caterpillars, and piper plants.ControlExperimental15. Describe the impact of adding the beetles on each species in the food chain above.16. Which statement do Letourneau and Dyer’s results support?a. Adding beetles reduced ant numbers and triggered a trophic cascade that increased the mean leaf arealeft on plants.b. Adding beetles had little effect on this ecosystem, showing that it is primarily regulated from the bottomup.c. Adding beetles reduced ant numbers and triggered a trophic cascade that decreased the mean leaf arealeft on plants.d. Adding beetles reduced ant numbers and increased the caterpillar population size, proving that thecaterpillars are a keystone species in this habitat.17. Do the results of the Letourneau and Dyer experiment support or refute the green world hypothesis?Explain your answer.Ecologywww.BioInteractive.orgRevised January 2018Page 5 of 5
a. The starfish took up most of the room on the rocks, and when the starfish were removed, the mussels occupied the empty spaces. b. Paine added more mussels to the rocks, causing the starfish to move to other habitats. c. The starfish were competing directly with the mussels for food, and removing the starfish allowed the