Transcription
Vital rates, limiting factors and monitoringmethods for moose in MontanaFederal Aid in Wildlife Restoration Grant W-157-R-7Annual report, September 1, 2021Nick DeCesareResearch biologist, FWPndecesare@mt.gov406-542-5558Collin PetersonResearch technician, FWPcollin.peterson@mt.gov406-751-4588Sawyer Johnson, FWPState: MontanaAgency: Fish, Wildlife & ParksGrant: Montana Shiras Moose StudyGrant number: W-157-R-7Time period: 1 July 2020 – 30 June 2021FUNDING PARTNERS:Safari Club International Foundation:Conservation Grants, 2016, 2018Note: All results should be considered preliminary and subject to change; please contact theauthors before citing or referencing these data.1 Page
Background and summaryIn 2013, Montana Fish, Wildlife, & Parks (MFWP) began a 10-year study designed to improveour understanding of: 1) cost-effective means to monitor statewide moose (Alces alces)populations, and 2) the current status and trends of moose populations and the relativeimportance of factors influencing moose vital rates and limiting population growth (includingpredators, disease, habitat, and weather). We are using a mechanistic approach to hierarchicallyassess which factors are drivers of moose vital rates (e.g., adult survival, pregnancy, calfsurvival), and ultimately influence annual growth of moose populations.This document is the 9th annual report produced as part of this work. This report containspreliminary results from a subset of our work, including results from the first 8 biological yearsof moose research and monitoring. All results should be considered preliminary as both datacollection and analyses are works in progress.In this report, we provide updates on: Estimating moose abundance using statewide hunter sightings dataCapture and vital rate monitoring of moose in 3 study areasForage quality and diet sampling during both summer and winterHunter-based monitoring of moose nutrition and rutting activityWeb site: We refer readers to our the FWP website for additional information, reports,publications, photos and videos. More information on this study specifically can be found underthe “Research” heading at this gement/mooseAdditionally, a recent presentation, hosted by Swan Valley Connections, regarding moose andthis study is available here:https://youtu.be/QfJ9rNWxp4U2 Page
LocationMoose vital rate research is focused primarily within Beaverhead, Lincoln, Lewis and Clark,Pondera, and Teton counties, Montana. Other portions of monitoring (e.g., genetic and parasitesampling) involve sampling moose from across their statewide distribution.Study Objectives (2020-2021)For the 2020-2021 field season of this moose study, the primary objectives were;1) Continue to evaluate moose monitoring data and techniques.2) Monitor vital rates and limiting factors of moose in three study areas.Objective #1: Moose monitoring methods1.1. Estimating moose abundance from hunter sightingsAn important goal of this study is to evaluate and apply techniques for monitoring moose at astatewide scale and over the long-term. One such approach that we’ve reported on previously isthe use of hunter phone surveys to collect sightings of moose. Hunter sightings have been usedto monitor moose in other jurisdictions, including to estimate moose occupancy in New York(Crum et al. 2017) and as an index of moose density (moose seen per unit effort) in Norway(Ueno et al. 2014). Additionally, in Montana, there is a precedent for using such data to estimatethe spatial distribution and abundance of wolves by applying occupancy models (Rich et al.2013) and subsequently translating occupancy estimates into abundance using additional territoryarea and pack size information.While the small number of 300–350 hunters targeting moose each year offer relatively few datawith limited scientific utility (DeCesare et al. 2016), the much larger population of 110,000 elkhunters and 150,000 deer hunters represent a great deal of time and effort spent looking for biggame each fall. Each year MFWP conducts phone surveys of a large sample of resident deerand elk hunters in Montana to estimate various hunter harvest and effort statistics. Following the2012–2016 hunting seasons, a subsample of these hunters were also asked to describe thelocation and group size of any moose sightings that occurred while hunting. These effortsresulted in 17,403 sightings of moose over the 5-year period, ranging from 2,334–4,675 sightingsper year. We initially conducted occupancy analyses of the presence-absence of moose acrossthe state with these data (see 2017 Annual Report). However, occupancy estimates alone maynot offer enough information to managers wishing to monitor trends in moose population size;thus, we subsequently began exploring n-mixture models (Kéry et al. 2018) as a means to countmoose at a statewide scale.Preliminary results from this work indicate potential to monitor abundance (or relativeabundance) at the hunting-district scale (Figure 1). We evaluated a suite of covariates likely tobe predictive of both the probability of detecting moose and underlying patterns of mooseabundance. Thus far, we have found that detection probability varied according to the number ofhunters sampled via phone calls each year, the number of hunter days of effort estimated perhunting district, and the specific week of the general hunting season. Covariates related tomoose abundance included forest canopy cover and the amount of shrub and forest habitat.3 Page
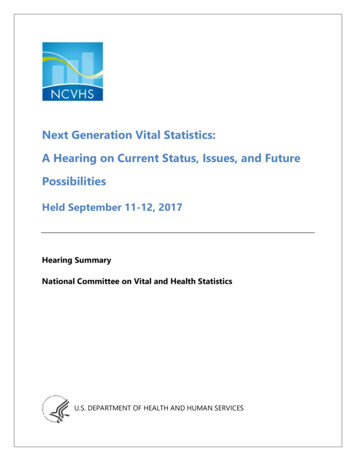
While we are encouraged by these preliminary results, we have identified some additionalanalysis steps to improve the utility of population estimates. First, review by a small group ofFWP area biologists identified some hunting districts where moose numbers were likely beingover-estimated and others under-estimated. We hypothesize that these differences likely relatevariation in detection probability that has gone unmeasured thus far. We will re-run statisticalanalyses including a few new covariates that may improve the resolution of detection probabilityestimates.Second, while sightings and hunter effort information are collected in reference to the spatiallayout of deer and elk hunting districts, moose are managed according to moose hunting districts.To more directly link results to management, we will also re-run these statistical modelschanging the spatial sampling to align with moose hunting districts.Lastly, while moose populations do occur outside of moose hunting districts, we will alsoexplore the effects of including all statewide data vs. a focused analysis on just open moose HDswhere harvest management is actively occurring. We expect these analyses to be finalized inFY22, and we also we will resume collection of moose sighting data again following the 2021general hunting season.Figure 1. Preliminary moose population estimates (bold numbers) for each deer-elk huntingdistrict, estimated using n-mixture modeling of hunter sightings data (red dots) for one year ofdata (2012) from the general hunting season. Results are preliminary and will change pendingre-analysis of data with additional covariates to improve detection probability estimates.4 Page
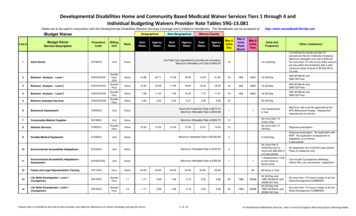
Objective #2: Monitor moose vital rates and potential limiting factors2.1. Animal capture and handlingIn February of 2021 we worked with a contracted helicopter capture company (Quicksilver Air)and local landowners to capture moose. A total of 24 adult females were captured in 3 studyareas in 2021 including both new animals and recaptured study animals for collar replacement.Moose were fit with GPS radio-collars (Lotek GPS-Globalstar). During 2013–21, we haveconducted a total of 229 captures of 193 individual adult female moose, and as of September 1,2021, 82 are currently being monitored (Table 1, Figure 2). A target sample size of 30individuals/study area is sought to achieve moderate precision in annual survival estimates, whileminimizing capture and monitoring costs.Table 1. Captures of adult female moose by study area and year, excluding 6 capture-relatedmortalities, and the number of adult females being monitored as of September 1, 2021.Study AreaCabinet-SalishBig Hole Valley Rocky Mtn FrontTotal2013 captures111211342014 captures7208352015 captures1367262016 captures046102017 captures1079262018 captures7811262019 captures8610242020 captures864182021 captures671124Total captures627073229Moose currently on–air30252782Figure 2. FWPResearchtechnicianCollin Petersonloadingsyringes withreversal drugsafter handlingmoose F422 inthe RockyMountain Frontstudy area,2021.5 Page
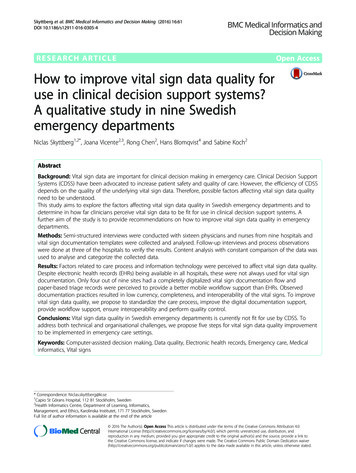
Figure 3. Moose winter capture locations during 2013–2021 across 3 study areas in Montana.6 Page
2.2. Monitoring vital rates2.2.1. Adult female survival.–– Our study of adult female survival to date includes 186 radiocollared adult female moose and 630 animal-years of monitoring, with a staggered-entry designof individuals entering into the study across 9 winter capture seasons (see 2.1 Animal captureand handling). Animals have been deployed with both VHF (N 73) and GPS (N 150) collars.We estimated Kaplan-Meier annual survival rates for each study area during each biological yearas well as across the 8 biological years pooled together in a recurrent-time format.Pooled annual survival estimates across the entire monitoring period for each study area were0.900 (SE 0.020, 95% CI [0.86,0.94]) in the Cabinet-Salish, 0.860 (SE 0.023, 95%CI [0.82,0.91]) in the Big Hole Valley, and 0.889 (SE 0.021, 95% CI [0.84,0.93]) on theRocky Mountain Front (Figure 3). In comparison to these 7-year averages, survival during the2019-20 biological year was higher than average in the Cabinet-Salish (0.93), but lower in boththe Big Hole Valley (0.82) and Rocky Mountain Front (0.77). While differences among studyareas appeared more pronounced during the early years of this study, the mean estimates in eacharea have gradually grown closer to one another as we continue to accumulate data. Theseestimates do not account for differences in age distribution of our collared sample, which we willaddress in more detail upon completion of the study (Prichard et al. 2012).Adult female survival0.900.890.87Figure 4. Kaplan-Meier estimates and 95% confidence limits of annual adult femalesurvival within each study, across 8 biological years for each study area, Montana,2013–2021.7 Page
During 8 biological years of monitoring, we have documented 79 mortalities of collared adultmoose across all study areas: 23 in the Cabinet-Fisher, 31 in the Big Hole Valley and 25 in theRocky Mountain Front (Figure 4). While determining the causes of adult female moosemortality was not initially a key objective of this study, the relatively high proportion of healthrelated (non-predation) mortalities has prompted greater emphasis on prioritizing collartechnology and staff time to document cause of death when logistics permit.Figure 5. Counts of radio-collared adult female moose by cause-of-mortality across all 3 focalstudy areas. Note, this summary does not account for variations in sample size and timing thatcan affect the perceived relative risk to each cause. Such concerns will be accounted for usingformal cumulative incidence analyses upon completion of this study.8 Page
2.2.2 Calf survival.–– We decompose calf survival into 2 components: 1) observed parturitionrate – the proportion of pregnancies that result in a neonate calf-at-heel during spring; and 2) calfsurvival – the proportion of documented calves that survive through their first year of life.Observed parturition rates: Following winter pregnancy testing, we use aerial telemetryduring 15 May – 15 July to estimate an “observed parturition” rate, representing the proportionof pregnant cows with neonate calves each spring. A limitation of this approach is the unknownproportion of calves born that die before we visually confirm them. Thus, our sample forsubsequent study of calf survival is left truncated (Gilbert et al. 2014), and calf survival estimatesare optimistic in that they don’t account for mortality of calves prior to initial detection. Thesedata have yet to be updated with 2020–2021 litters, pending final pregnancy analyses. Through2019, observed parturition rates have been higher in the Rocky Mountain Front (91%) and BigHole Valley (87%), and lower in the Cabinet-Fisher (77%; Figure 5). These results are similarto those of other studies (e.g,, Becker 2008) where parturition rates are lower than pregnancyrates due to presumed fetal losses and/or death of neonatal calves prior to detection.Calf survival: As a result of spring monitoring of neonate calves, we have documented440 calves from 401 litters born during 2013–2020. We then monitored the fates of these calvesby visually locating them with their dams throughout their first year of life. Over the first 8biological years (May 2013 – May 2021), pooled Kaplan-Meier survival estimates of calves-atheel were 0.419 (SE 0.045, 95% CI [0.34,0.52]) in the Cabinet-Fisher, 0.461 (SE 0.043, 95%CI [0.39,0.55]) in the Big Hole Valley, and 0.476 (SE 0.040, 95% CI [0.40, 0.56]) on theRocky Mountain Front (Figure 5). Calf survival results mirror those of observed parturition,suggesting observed parturition rates are likely influenced by mortality of neonates prior todetection, more so than fetal losses.Figure 6. Observed parturition (proportion of pregnant cows with calves-at-heel during spring)and Kaplan-Meier estimates of annual calf survival for the first year of life within each studyarea, where bold lines are pooled estimates across 8 biological years and thin lines are annualestimates per year, Montana, 2013–2021.9 Page
2.2.3 Adult female fecundity.––Fecundity for moose is the product of age-specific pregnancyrates and litter size. We monitor pregnancy of animals during winter with laboratory analyses ofboth blood (serum PSPB levels; Huang et al. 2000) and scat (fecal progestagens; Berger et al.1999, Murray et al. 2012). To estimate pregnancy in absence of handling animals each winter,we use fecal progestagens from samples collected via telemetry guided snow-tracking.Pregnancy rates: Final pregnancy data from the springs of 2020 and 2021 are not yetavailable, pending fecal progestogen lab results. Pooled across study areas, 7 years (2013-2019),and 501 animal-years of monitoring, the average adult (ages 2.5) pregnancy rate was 82%,varying from 80–85% across study areas (Figure 6). Yearling (age 1.5) pregnancy rates appearto vary by region, with 0% pregnancy in both the Cabinet-Fisher and Big Hole Valley studyareas compared to 36% yearling pregnancy on the Rocky Mountain Front; however, sample sizesfor yearling pregnancy are small (N 3, 8, and 14 in the 3 areas, respectively).Observed twinning rates: Moose are capable of giving birth to 1–3 calves, though littersare most commonly composed of either 1 or 2 calves (Van Ballenberghe and Ballard 2007).Twinning rates in North American populations can vary from 0 to 90% of births (Gasaway et al.1992), with variation linked to nutritional condition (Franzmann and Schwartz 1985) and animalage (Ericsson et al. 2001). Twinning rates for Shiras moose are typically low (e.g., 15%; Peek1962, Schladweiler and Stevens 1973, Becker 2008). Thus far our observed twinning rates are7% in the Cabinet-Fisher (N 118 litters), 1% in the Big Hole Valley (N 141 litters), and 21% inthe Rocky Mountain Front study areas (N 138 litters; Figure 6).Figure 7. Estimated adult (age 2.5) pregnancy rates, yearling (aged 1.5) pregnancy rates,observed twinning rates, and net observed fecundity of calves per adult female in 3 study areasof Montana to date, 2013–2021.10 P a g e
2.2.4. Population growth rates. The overall status of a population may be best characterized bythe annual growth rate. This parameter can be estimated by inserting key vital rates intomathematical models, most importantly the annual survival of adult females and the per capitanumber of calves born and surviving their first year. We estimated recruitment per cow as theintegrated product of pregnancy rates, parturition rates, litter size, and calf survival rates. Wethen estimated annual population growth rates, following DeCesare et al. (2012), for each studypopulation across the first 7 biological years, 2013–2019 (Figure 7). Growth rate analyses for2020 are still awaiting final pregnancy lab results, and thus are not included here.Given the high elasticity of adult female survival in long-lived, iteroparous species(Eberhardt 2002), adult female survival is the most important vital rate for determiningpopulation growth rates. High adult survival, on average, in the Cabinet-Fisher translated to amean population growth rate of 1.01, or an 1% increase per year, despite consistently seeing thelowest calf survival of all 3 areas. The Rocky Mountain Front moose have seen very highsurvival rates of both adults and calves as well as high fecundity of adults, resulting in anestimated annual growth rate of 1.12. While vital rates in the Big Hole Valley population wereindicative of a declining population for several years, higher adult survival in recent years hasincreased the overall average to show a stable to increasing population growth rate (1.02) for thefirst time of the study.Figure 8. Contour plot showing the estimated mean annual population growth rates (λ,represented as contour lines) resulting from two-dimensional combinations of adult femalesurvival and spring recruitment of calves (integrating rates of pregnancy, parturition, litter size,and calf survival through the first year). Smaller dots show annual rates for each of 7 biologicalyears, and larger dots and error bars show the pooled averages and standard errors, 2013–2020. Growth rates above the bold line (where λ 1) indicate a growing population, growthrates below λ 1 indicate declining populations. Results are preliminary and subject to change.11 P a g e
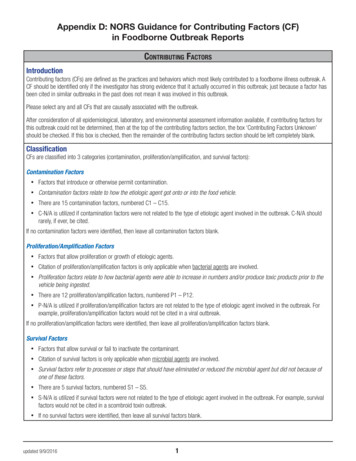
2.3 Composition and nutritional quality of moose dietsThe nutritional quality of the diets of moose ultimately affects adult survival, pregnancy,and parturition rates (McArt et al. 2009, Milner et al. 2013). To better understand the effects offorage nutrition on vital rates of moose, we are assessing the composition and quality of the dietsof moose during 2 important life-history stages: post-parturition during summer and late winter.We will be determining the digestible energy content (kilocalories/gram), digestible proteincontent, and concentration of tannins (which influences forage digestibility) of plants in moosediets during these time periods as well as assessing diet composition at the individual level.2.3.1 Summer forage surveys. ––Between 15 June and 15 July 2021, wesurveyed the locations of GPS-collaredmoose for evidence of recent browsingactivity by moose on trees, shrubs, and forbswithin the vicinity of each location (Figure9). For each species with evidence ofbrowse, we located 3-5 individual plantswith browse evidence and clipped the newgrowth of 5-10 stems and their leaves fromeach individual plant. We stored sampleswithin paper bags in a freezer. We willcompile samples by browse species, studyarea, elevational zone, and time ofcollection, and submit them for qualityanalyses within the coming year. In total, we Figure 9. Collin Peterson samples willow leavesand twigs at a moose feeding site in the Big Holesurveyed 117 locations from 48 GPSstudy area, 2021.collared moose (47 locations among 18moose in Cabinet-Salish, 30 locationsamong 14 moose in the Big Hole, and 40 locations among 16 moose on the Rocky MountainFront). We collected 150 plant samples among 29 unique species browsed in Cabinet-Salish, 59samples among 11 species in the Big Hole, and 77 samples among 19 species on the RockyMountain Front (Table 2). We also collected fresh fecal samples (N 81, to date) to determinethe composition of individual diets during summer through DNA metabarcoding techniques.Table 2. Summer plant species with evidence of browsing by moose and clipped for forage qualityanalyses at locations of GPS-collared moose between 15 June and 15 July 2021.Study areaCommon nameGenusSpeciesFamilyLifeformBig HoleBig HoleBig HoleBig HoleBig HoleBig HoleBig HoleBig HoleBig HoleBig Hole12 P a g eCow parsnipTwinberry honeysuckleFalse azaleaBlack swamp gooseberryBarclay's willowBooth's willowDrummond's willowGeyer's willowLemmon's willowPlane-leaf hrubshrub
Table 2 (cont).Study areaCommon t-SalishCabinet-SalishCabinet-SalishRocky Mountain FrontRocky Mountain FrontRocky Mountain FrontRocky Mountain FrontRocky Mountain FrontRocky Mountain FrontRocky Mountain FrontRocky Mountain FrontRocky Mountain FrontRocky Mountain FrontRocky Mountain FrontRocky Mountain FrontRocky Mountain FrontRocky Mountain FrontRocky Mountain FrontRocky Mountain FrontRocky Mountain FrontRocky Mountain FrontRocky Mountain FrontBlack cottonwoodQuaking aspenAsterHooker's fairybellsRocky Mountain mapleGrey alderServiceberrySnowbrush ceanothusRed osier dogwoodHawthorneOceansprayUtah honeysuckleFalse azaleaMock orangeChokecherryWhite-stem gooseberryBlack swamp gooseberryPrickly wild roseDwarf roseWoods' roseThimbleberryPussy willowDrummond's willowScouler's willowBuffaloberryMountain ashBirchlead spireaDouglas' spireaSnowberryQuaking aspenFirweedBirchRed osier dogwoodChokecherryBlack swamp gooseberryBebb's willowBooth's willowUndergreen willowPussy willowDrummond's willowCoyote willowGeyer's willowLemmon's willowDusky willowPlane-leaf willowFalse mountain willowScouler's willowAutumn aceaeSalicaceaedeciduous treedeciduous ubshrubshrubshrubshrubshrubshrubshrubdeciduous rubshrubshrubshrubshrubshrubshrubshrubshrub13 P a g e
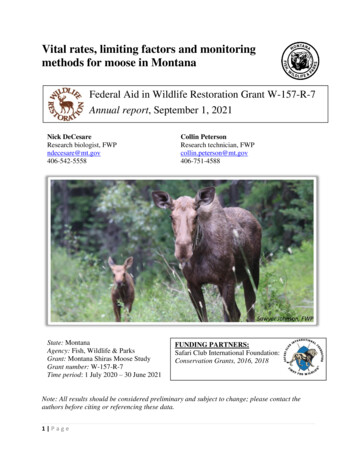
2.3.2 Winter forage surveys and diet composition. ––Winter forage quality also influences important moose vital rates like calf recruitmentand adult survival (Testa 2004, Milner et al. 2013). During winters of 2021-22 and 2022-23, wewill replicate our summer forage monitoring methods by visiting the locations of GPS-collaredfemales and sampling plants with browse evidence. Because many of these plants are deciduousand unidentifiable during winter, we will return to each plant sampled during summer andidentify to species. Clipped samples will be analyzed for nutritional quality and combined withdiet composition data to estimate the quality of individual winter diets.During the winters of 2013-2020, we collected fecal samples from captured moose. Weused DNA barcoding to estimate diet composition of 197 individual samples, and the collectivediet composition of moose throughout our 3 study areas (Figure 10). In Cabinet-Salish, mooseprimarily consumed evergreen and deciduous shrubs and coniferous trees. Snowbrush ceanothus(C. velutinus) was the most heavily consumed species during winter (42% of diet), followed bywillow (Salix spp., 16%) and Douglas fir (Pseudotsuga menziesii, 13%, Figure 10). In the BigHole, moose primarily foraged on willows but were also subsidized by haystack vegetation(grasses, rushes, and sedges) during the winter. Willows were the most consumed forage item(71%) followed by grasses (Poaceae, 14%), black swamp gooseberry (Ribes lacustre, 4%),rushes (Juncus spp., 2%) and sedges (Carex spp.; 2%). On the Rocky Mountain Front, winterbrowse primarily occurred on deciduous shrubs and trees. Willows were the most consumedforage item (38%) followed by red osier dogwood (Cornus sericea, 24%), birch (Betula spp.,15%), members of the rose family (Rosaceae, 8%, most likely comprising wild rose [Rosa spp.]and serviceberry [Amelanchier alnifolia]), and cottonwood and aspen trees (Populus spp., 5%).Figure 10. Winter diet composition (plants exceeding 2% of total) across 197 individualsin the Big Hole, Cabinet-Salish, and Rocky Mountain Front study areas, 2013-2020.14 P a g e
2.3. Monitoring nutritional condition, antler spreads, and rutting behavior with thevoluntary help of moose hunters2.3.1. Hunter-based sampling of nutritional condition.Nutritional condition of ungulates can impact both survival (Roffe et al. 2001, Bender et al.2008) and fecundity (Testa and Adams 1998, Keech et al. 2000, Testa 2004), and generallyprovides an indication of the extent to which habitat condition and density dependent effectsdrive ungulate dynamics (Franzmann and Schwartz 1985, Bertram and Vivion 2002). Rump fatthickness has a strong linear relationship with total body fat in moose (Stephenson et al. 1998).Moose hunters have measured rump fat by marking a toothpick within provided sampling kits for887 bull and 103 cow moose. Before comparing fat measurements across regions of Montana,we first assessed the relationship between the date each moose was harvested and its respectivefat levels, as bull moose are known to lose fat with high energy expenditure during the ruttingseason (Cederlund et al. 1989). While there was much variation, we found a significant andconsistent loss in rump fat depth among bull moose during each of the 8 years (P 0.001),whereas fat among cows did not change with day of season (P 0.72; Figure 11).Figure 11. Depth of rump fat declined consistently (due to rutting activity) among harvestedbull moose according to the date of harvest during the past 8 hunting seasons (see black trendline), whereas average fat depths among cow moose did not significantly change (red trend-line)during the hunting season, Montana, 2013–2020.15 P a g e
After assessing how average fat levels changed during the season, we compared observedmeasurements of fat for each moose to the average expected amount of fat following the trendlines in Figure 8, though using a linear trendline for this exercise. We then estimated theresiduals between observed and predicted values, where a positive value suggested an animalwith more fat than expected given the date of harvest, and a negative value an animal with lessfat than expected. Lastly, we summarized the average residual scores and compiled apreliminary index to map relative fat measurement by moose hunting district (Figure 12). Somepatterns emerge from this exercise, though these results are exploratory and subject to changebased on inclusion of non-linear relationships between date and fat, as well as interacting effectsof moose size (Figure 13). Regarding such interactions, we also found evidence of a differencein the rate at which bulls deplete their fat stores, according to their size (Figure 13), which is notaccounted for in the mapped index thus far. Lastly, with regards to angler spread itself, we foundevidence that moose increase in antler spread size up until about the age of 6 years old, at whichpoint antler spreads generally are not affected by age (Figure 14).Figure 12. A preliminary index of bull moose fat measurements after accounting for date ofharvest, summarized by moose hunting district, with sample sizes labeled for each district.These data were collected by hunters by marking a toothpick (inset photo) included in samplingkits mailed to all license-holders, Montana, 2013–2020.Note: these results are preliminary and will be further refined after accounting for additionaleffects of date and moose size that are not currently included.16 P a g e
Figure 13. We also continueto find evidence from huntercollected measurements ofboth rump fat and antlerspread that larger bullsgenerally start the ruttingseason with more fat, butdeplete their fat stores at afaster rate than smaller bulls,ending the rut in poorernutritional condition,Montana, 2013–2020.Figure 14. Hunter self-reported, unofficial, antler spreads (inches) show a gradual increase inthe average spread across all moose statewide until about the age of 6, at which point averageantler spread holds steady with age, 2013–2019.17 P a g e
2.3.2. Hunter-based monitoring of the rutFor the lucky few (1.1% of applicants for the 2020 season) who draw a moose license each year,o
FY22, and we also we will resume collection of moose sighting data again following the 2021 general hunting season. Figure 1. Preliminary moose population estimates (bold numbers) for each deer-elk hunting district, estimated using n-mixture modeling of hunter sightings data (red dots) for one year of data (2012) from the general hunting season.