Transcription
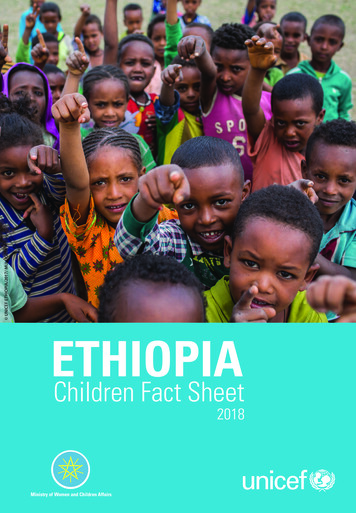
UNICEF ETHIOPIA/2017/ MULUGETA AYENEETHIOPIAChildren Fact Sheet2018Ministry of Women and Children Affairs
DemographicsUNCRC Article 1:’’ For the purposes of the present Convention, a child means every humanbeing below the age of eighteen years unless under the law applicable to the child, majority isattained earlier’’IndicatorTotalMale (%)CSA 2018 calculated projection (2007-2037)49.820,057,000Male (%)49.7Female (%)50.3Rural76,447,000Male (%)50.3Total49.7EDHS 20112.6EDHS 20164.6Urban2.3Rural5.2Life expectancy at birth(years)Male (%)% of population under age0-19TotalFemale (%)Male (%)CSA 2018 calculated projection (2007-2037)62.4CSA 2018 calculated projection (2007-2037)47,837,055Female (%)TotalMale (%)TotalMale (%)Female (%)66.625.725CSA 2018 calculated projection (2007-2037)Female (%)Total population under age0-450.2UrbanFemale (%)% of population under age0-1596,504,000Female (%)Population annual growthrate (%)Total fertility rate (age 15-49)Value37,336,35020.119.5CSA 2018 calculated projection (2007-2037)13,528,5907.37.1 UNICEF ETHIOPIA/2017/ MARTHA TADESSETotal populationSource1
UNICEF ETHIOPIA/2016/ MULUGETA AYENESustainable Development Goals (SDGs)End poverty inall its formseverywhereUNCRCArticle 22Reduce inequalitywithin and amongcountriesNon-discrimination respect and ensure the rights to each child within their jurisdictionwithout discrimination of any kind, irrespective of the child’s or his or her parent’s orlegal guardian’s race, colour, sex, language, religion, political or other opinion, national,ethnic or social origin, property, disability, birth or other status. States Parties shalltake all appropriate measures to ensure that the child is protected against all forms ofdiscrimination or punishment on the basis of the status, activities, expressed opinions, orbeliefs of the child’s parents, legal guardians, or family members.
Economic IndicatorsIndicatorSourceValueGDP per capita (USD) (Nominal 2006 EFY)MoFEC 2015/16794GNI per Capita* (2015 USD)World Bank Group 2016660Annual growth rate of real GDP (%)World Bank Group 20188Proportion of population under 18 living below the national poverty line(%)CSA-UNICEF 2015 (ChildPoverty Report)32.42People living below the total poverty line (%)HCES 2015/201623.5People living below the food poverty line (%)HCES 2015/201624.8Population in severe Multi-dimensional Poverty (%)UNDP HumanDevelopment Report 201667Inflation rate (January 2018) (%)CSA 201813.4Proportion of Tax revenue out of GDP (%)National Bank of Ethiopia2016/1711.6Percent distribution of rural households by whether they are inProductive Safety Net Programme (PSNP)See Graphs 1 & 2Graph 2: Percent distribution of ruralhousehold heads by sex under theProductive Safety Net Programme (PSNP)AfarDire 514.8124.12.31.110.80 10 20 30 40 50 6075.30%MaleFemaleNot PSNPSource: Ethiopia Mini DHS 2014 UNICEF ETHIOPIA/2016/ NAHOM TESFAYEGraph 1: Percent distribution of ruralhouseholds by whether they areProductive Safety Net Programme(PSNP)3
UNICEF ETHIOPIA/2016/ NAHOM TESFAYESustainable Development Goals (SDGs)End hunger, achieve foodsecurity and improvednutrition and promotesustainable agricultureUNCRCArticle 64Healthy lives andwell-being for all atall agesRecognize that every child has the inherent right to life and ensure to the maximum extentpossible the survival and development of the child. Article 24 Right of the child to theenjoyment of the highest attainable standard of health, ensure that no child is deprived ofhis or her right of access to health care services.
Nutrition UNICEF ETHIOPIA/2016/ MULUGETA AYENENutritional Status of ChildrenTrends in Nutritional Status of ChildrenSee Graph 3Percent of Children under age 5 Stunted, Underweight, Wasted Rural/UrbanSee Graph 4Percent of children under age 5 Stunted, Underweight, Wasted by RegionSee Graphs 5,6&7Graph 4: Percent of children under age 5Stunted, Underweight, Wasted Rural/UrbanGraph 3: Trends in nutritional status nderweightRuralWastedWastedUnderweightSource: EDHS 2016 based on 2006 WHO ChildSource: EDHS 2000 (converted into 2006 WHO standard), 2005Growth Standards(converted into 2006 WHO standard), 2011, 2016Graph 6: UnderweightGraph 5: yOromiya38.6SNNPR2322.521.12019.4Gambella32Addis e l-GumuzDire DawaSomali36.2AfarAmhara5023.514.6Addis 10.6Amhara9.8Dire DawaSource: EDHS 201640Graph 7: Wasting9.7SNNPR6Addis Ababa3.5010205
BreastfeedingIndicatorSourceTrends in early initiation of BreastFeeding: Who started breastfeedingwithin 1 hour of birth (%)TotalEDHS 2016Value73.3Male (%)71.3Female (%)75.2Rural73.4Urban72.6TotalEDHS 201151.5Male (%)49Female (%)54.3Rural50.6Urban57.1TotalEDHS 200569.1Male (%)68.4Female (%)69.8Rural69.5Urban64.8TotalEDHS 200051.8Male (%)51.9Female (%)51.7Rural52.3Urban47.1Trends in Exclusive breastfeeding ( 6 months, %) and Prelacteal FeedSee Graph 8Graph 8: Trends in exclusive breastfeeding ( 6months, %) and prelacteal feed402004952292 7.157.57.9200520112016Exclusive breastfeeding ( 6 months, %)Percentage who received a prelacteal feedSource: EDHS 2005, 2011, 20166 UNICEF ETHIOPIA/2014/ MICHAEL TSEGAYE60
Child MortalityIndicatorSourceNeonatal mortality (death per 1,000 live births) (0/00) Probabilityof dying in the first month of lifeInfant mortality rate (death per 1,000 live births) (0/00)Probability of dying before the first birthdayUnder five mortality rate (death per 1,000 live births) (0/00)(Deaths per 1,000 live births in the 5-year period before thesurvey)ValueEDHS 201629EDHS 201137EDHS 200539EDHS 200049EDHS 201648EDHS 201159EDHS 200577EDHS 200097EDHS 201667EDHS 201188EDHS 2005123EDHS 2000166Early childhood mortality rates by RegionSee Graph 9Early childhood mortality rates according to place of ResidenceSee Graph 1012512080408159433438Graph 9: Early childhood mortality rates by 67392818360Neonatal mortalityInfant mortalityUnder-5 mortalityGraph 10: Early childhood mortality rates by residenceUnder-5 mortalityInfant mortalityNeonatal mortality01020304050607080RuralNeonatal mortality38Infant mortality62Under-5 mortality83Urban415466Source: EDHS 20167
Childhood Illness and TreatmentIndicatorSourceTrends in percentage of children age12-23 months who have received all basicvaccinations, Total, Urban, RuralTotalValueEDHS 201638.5Male (%)36.5Female (%)40.3Rural35.1Urban64.6TotalEDHS 2011Male (%)23.1Female (%)25.7Rural20.4Urban48.1TotalEDHS 200520.4Male (%)22.5Female (%)18.2Rural17.9Urban49.3TotalEDHS 200014.3Male (%)14.7Female (%)13.8Rural11Urban42Percentage of children age 12-23 months who received all basic vaccinations at any timebefore the survey by Region, Mother’s education and HH Wealth quintile in 2016See Graphs 11&12Proportion of women who had a live birth inthe 5 years preceding the survey whose lastlive birth was protected against neonataltetanus (%)49TotalEDHS 2016Urban72.4Rural45.6Percentage of children under age 5 who reported a fever in the twoweeks preceding the survey sought treatment from a facilityGraph 11: Percentage of children age12-23 months who received all ce: EDHS 201669.67667EDHS 201635EDHS 201124.2EDHS 200517.5Graph 12 b: Vaccinationcoverage by HH wealthquintileGraph 12 a: Vaccinationcoverage by mother'seducation89Addis AbabaDire 637038.1 36.722.244.6
Maternal MortalityIndicatorSourceTrends in maternal mortality ratio (per 100,000 live birth)ValueSee Graph 13Women aged 15-49 attended at least once by a skilled health provider during pregnancy (%) See Graph 14Percentage delivered in a health facility by mother’s education and household wealthquintileSee Graph 15Trend in women with a postnatal check during the first 2 days after birthSee Graph 16Unmet need for family planning for currently married women age15-49 (%)Trends in use of contraception among all women aged 15-19 Anymodern methodTrends in use of contraception among all women aged 15-49 Anymodern methodTrends in use of contraception among all women aged 15-49 AnymethodMothers age 15-49 with a live birth in the five years preceding thesurvey receiving two or more tetanus toxoid injections during lastpregnancy (%)EDHS 201622EDHS 201125EDHS 200533.8EDHS 200035.8EDHS 20167.4EDHS 20115.2EDHS 20052.5EDHS 20001.3EDHS 201624.9EDHS 201118.7EDHS 20059.7EDHS 20004.7EDHS 201625.3EDHS 201119.6EDHS 200510.3EDHS 20005.9EDHS 201641.1EDHS 201133.8EDHS 200528EDHS 200017.2Trends in Maternal Health Care, 2016See Graph 17Graph 13: Maternal Mortality Ratio (MMR) withconfidence intervals for the seven years precedingthe 2000, 2005, 2011, and 2016 32000 EDHS2005 EDHS2011 EDHS2016 EDHS(1993-2000) (1998-2005) (2004-2011) (2009-2016)Source: EDHS 2000, 2005, 2011, 20169
Graph 14: ANC - Women aged 15-49attended at least once by a skilled healthprovider during pregnancy (%)10068.966.690.176026.7 21.627.6 23.72000200533.979.28062.4 58.350Graph 15 a: Percentage delivered ina health facility by ationalUrbanUrbanRuralSource: EDHS 2000, 2005, 2011, 2016Graph 15 c: Percentage delivered in ahealth facility by HH wealth quintileGraph 15 b: Percentage delivered in ahealth facility by mothers education15010050091.577.4More than Graph 16: Trends in women with apostnatal check during the first 2 daysafter stGraph 17: Trends in Maternal Health Care3 1.83530282519.12010.4506Birth attended byskilled provider12.21065520002005Four plus ANC visits2610102011Birth occurred in ahealth facility2016Source: EDHS 2000, 2005, 2011, 2016 UNICEF ETHIOPIA/2017/ MULUGETA AYENESource: EDHS 2016015Rural201168.610
HIV/AIDSIndicatorSourceValue% of pregnant women aged 15-49 who received HIV tests, results and posttest counsellingEDHS 201621.9EDHS 201111.3% of young people aged 15-19 with correct,comprehensive knowledge of HIV/AIDSEDHS 201637.6Male (%)Female (%)Male (%)24EDHS 2011Female (%)% of young people aged 15-19 who were tested for HIVin the past 12 months and received the resultsMale (%)24EDHS 2016Female (%)Male (%)TotalEDHS 2016 HIVPrevalence Report1.2EDHS 2011Male (%)1.9EDHS 2005Male (%)2EDHS 2016 HIVPrevalence ReportMale (%)0.2 0.1Female (%)Total1.41Female (%)Total1.51Female (%)0.4EDHS 20110.1Male (%)0Female (%)0.2 UNICEF ETHIOPIA/2013/ ZERIHUN SEWUNETHIV Prevalence among adolecnet age 15-19 (%)0.90.6Female (%)Total16.518Male (%)Total8.912.4EDHS 2011Female (%)Trends in HIV Prevalence among people age 15-49 (%)31.811
Health ExpenditureIndicatorSourceChild health expenditure as a percentage of nationalhealth expenditure (%)ValueEthiopia’s Fifth National Health Account2010/11, FMoH, 2010b 2007/810Ethiopia’s Fifth National Health Account2010/11, FMoH, 2010b 2010/1111Per Capita Health Expenditure, 1995/96–2013/14Ethiopia’ Health Accounts, 2013/2014 See GraphFMOH, HA 1-5 reports, and current HA data 18Proportion of People covered by Health Insurance residence and wealth quintilesEthiopia’s Fifth National Health Account2010/11, FMoH, 2010b 2010/11Graph 18: Per Capita Health Expenditure, 1995/96–2013/14 28.65 30.00 25.00 20.77 16.10 20.00 15.00 10.00 4.50 5.601995/961999/00 5.00 0.00 7.102003/042007/082010/112013/14Source: Ethiopia Health Accounts, 2013/2014Graph 19: Proportion of people covered by health insurance (2011/12),residence and HH wealth quintilesRural1.13Urban2.47National1.25Wealth QuintilesQ52Q40.6Q31.77Q21.04Q11.0400.5Source: Ethiopia’s Fifth National Health Account 2010/111211.522.5See Graph19
UNICEF ETHIOPIA/2017/ NAHOM TESFAYESustainable Development Goals (SDGs)Ensure inclusive and equitablequality education and lifelonglearning for allUNCRCArticle 28The right of the child to education - make primary education compulsory and availablefree to all; ensure that school discipline confirm to child’s human dignity and promote andencourage international cooperation in matters relating to education, Article 29 Goals ofeducation directed towards the development of the child’s talents and mental and physicalabilities, Article 30 Children of minorities/indigenous groups to enjoy his or her own religion, or to use his or her own language, Article 31 Leisure, play and culture13
Education UNICEF ETHIOPIA/2016/ MARTHA TADESSEPre- Primay, Primary and Secondary NER and NARPre-primary net enrollment ratio (NER) (%) by regionIndicatorNet attendance ratio PrimarySchoolSee Graph 20SourceTotalEDHS 2016Male (%)71Female (%)Total646542.342.2Female (%)42.4TotalEDHS 201618.1Male (%)17.6Female (%)18.4EDHS 201113.7Male (%)14Female (%)13.4EDHS 200515.6Male (%)17.7Female (%)13.3UrbanRuralUrbanRural14EDHS 2005Male (%)TotalNet attendance ratio SecondarySchool Urban/ Rural64.5Female (%)TotalNet attendance ratio PrimarySchool Urban/ Rural71.6EDHS 2011Male (%)TotalNet attendance ratio SecondarySchoolValue71.3EDHS 201683.1EDHS 201183.6EDHS 200578.8EDHS 201669.8EDHS 201161.1EDHS 200538.8EDHS 201641.5EDHS 201139.1EDHS 200548.2EDHS 201611.7EDHS 20116.2EDHS 20059.7Trends in dropout rate, grade 1-8 (%)See Graph 21Trends in national pupil teacher ratioSee Graph 22
Graph 20: Preprimary NER 2008E.C. (2015/16)Graph 21: Trends in dropout rate, grade 1-8 (%)2048.1NationalTigrayAddis uzDire .316.27.89.910.7MaleMaleFemaleNational100Source: MoE Education Statistics 2015/16Source: MoE Education Statistics 2015/16Graph 22: Trends in national pupil teacher ratioPrimary and 16PrimarySecondarySource: MoE Education Statistics 2015/1615
EnrollmentIndicatorSourceNational gross enrollment of students with disabilityPre-primaryValueSource: MoEEducationStatistics2015/16Male (%)Female (%)Primary 1-80.70.80.68Male (%)9Female (%)7Secondary1.5Male (%)1.7Female (%)1.3Proportion of teachers trained in Special NeedsEducation (SNE) 2015/16 (%)See Graph 23Graph 23: Proportion of teachers trained in SNE by region2015/16 4121731 234Secondary UNICEF ETHIOPIA/2017/ NAHOM TESFAYESource: MoE Education Statistics 2015/1616
Gender ParityIndicatorSourceGender Parity Index -attendance ratio Primary SchoolGender Parity Index attendance ratio Secondary SchoolValueEDHS 20161.01(NAR)EDHS 20111.02 (NAR)EDHS 20050.91 (GAR)EDHS 20161.05 (NAR)EDHS 20110.95 (NAR)EDHS 20050.65 (GAR)School FacilitiesProportion of Facilities available in Primary Schools by RegionSee Graph 24Proportion of Facilities available in Secondary Schools by RegionSee Graph 25Proportion of Facilities accessible for Children with special needs-Primary and Secondary Schools by RegionSee Graph 26Graph 24: Proportion of facilities available in primary schoolsby region100Electricity (%)8060100Electricity (%)806040Water (%)20Water (%)40Toilet (%)0HarariTigrayAddis AbabaDire DawaOromiaAmharaSNNPRBenishanguel- haraAfarSNNPRBenishanguel- TigrayOromiaHarariDire Dawa20Addis Ababa0Graph 25: Proportion of facilities available in secondarySchools by regionToilet (%)Source: MoE Education Statistics 2015/16Graph 26: Proportion of facilities accessible for children with special needs -primaryand secondary schools by region100806040200Water (%) PrimaryWater (%) SecondaryToilet (%) PrimaryToilet (%) SecondarySource: MoE Education Statistics 2015/1617
LiteracyIndicatorSourcePercentage of literacy for person age 15-49MaleValueEDHS 201667.4Female42MaleEDHS 201165Female38.4MaleEDHS 200558.9Female29.2Percentage literate by Residence , Region and WealthquintileSee Graphs 27, 28&29Graph 29: Percentage literate by regionGraph 27: Percentage literate NationalAddis AbabaDire 54.68151Female79.938.769.7Male37.368.544.9 65.735.364.6012.423.756.750.820604080100Graph 28: Percentage literate by residence HH wealthquintile100500Source: EDHS 2016184615.654.125.666.133.37 3.991.27 4.743.9Lowest Second Middle Fourth HighestMaleFemale
UNICEF ETHIOPIA/2014/ ENDRIAS GETACHEWSustainable Development Goals (SDGs)Achieve genderequality andempower allwomen andgirlsUNCRCArticle 2Promotesustained,inclusive andeconomicgrowth, fulland productiveemployment anddecent workPromote peaceful andinclusive societiesfor sustainabledevelopment, provideaccess to justice forall and build effective,accountable andinclusive institutions atall levelsNon-discrimination, Article 7 Birth Registration, Right from birth to a name, nationality and the rightto know and be cared for by parents Article 8 Preservation of identity Article 19 Protection from allforms of violence Article 21 Adoption to ensure best interests of the child Article 22 Rights of refugeechildren Article 23 Rights of children with disabilities Article 32 Child to be protected from economicexploitation and from performing any work that is likely to be hazardous or to interfere with thechild’s education, or to be harmful to the child’s health or physical, mental, spiritual, moral or socialdevelopment. Article 34 Right to be protected from sexual exploitation and abuse Article 35 Preventionof abduction, sale and trafficking of children Article 36 Protection from all other forms of exploitationArticle 37 Protection from torture, cruel, inhuman or degrading treatment or punishment Article 38 Warand Armed conflicts, Article 39 Rehabilitation of child victims Article 40 Juvenile justice.19
Child WellbeingIndicatorSourceBirth registration of children under age five (%)TotalEDHS 20162.7Male (%)2.7Female (%)2.6Rural1.6Urban11.5Percentage of children under 18 years old with bothparents dead (%)Proportion of children age 5-17 engaged in childlabour in the last one week of the survey (%)ValueTotalEDHS 20160.4EDHS 20110.8CSA and ILO201651Male (%)60.4Female (%)40.7Rural57.9Male (%)67.8Female (%)46.5Urban19.4Male (%)21.7Female (%)17.4Female Genital Mutilation/Cutting - FGM/CIndicatorSourceValueFemale Genital Mutilation/Cutting in age 0-14 women(%)EDHS 201616Female Genital Mutilation/Cutting among women age15-49 women (%)EDHS 201665EDHS 200574EDHS 200080Percent of women age 15-49 who are circumcised byRegionSee Graph 30Graph 30: Prevalence of FGM/C by region - percent of women age 15-49 who are circumcised99Somali91Affar82Harari76Oromiya75Dire Dawa200062SNNPR54Addis Ababa33Gambela24Tigray020200562AmharaSource: EDHS 2016201663Benishangul-Gumuz102030405060708090100
Child MarriageIndicatorSourceThe proportion of women married by age 15 among womencurrently age 15-19 (%)Proportion of women age 20-24 years who were married by the age18 (%)ValueEDHS 20165.7EDHS 20118EDHS 201640.3EDHS 201141Median age at first marriage for women age 20-49 -by RegionSee Graph 31Percentage of women age 15-19 who have begun childbearingSee Graph 32Graph 31: Median age at first marriage for women age 20-49 by regionGraph 32: Percentage of women age 15-19 whohave begun ang SNNPRGambelaHarariAddis Dire DawaNationalDire Dawa2005200020 UNICEF ETHIOPIA/2018/ MARTHA TADESSESource: EDHS 201621
Violence Against Women and ChildrenIndicatorPercent of women age 15-49 who have everexperienced physical violence since age 15Percent of women age 15-49 who have everexperienced sexual violenceAttitude toward wife beating: (% of women/Men 15-59 who agree that a husband isjustified in hitting or beating his wife for atleast one specific reason)SourceTotalEDHS 2016Value23.3Rural23.9Urban20.9TotalEDHS 201610.1Rural10.8Urban7.3TotalEDHS 2016Male (%)27.6Female (%)63RuralMale (%)30.8Female (%)69.8UrbanMale (%)39.2Female (%)15.1TotalEDHS 2011Male (%)44.7Female (%)68.4RuralMale (%)50.7Female (%)75.5UrbanMale (%)24.8Female (%)Total45.8EDHS 2005Male (%)51.5Female (%)81RuralMale (%)55.7Female (%)85.8Urban27.8Female (%)59 UNICEF ETHIOPIA/2016/ MEKLIT MERSHA22Male (%)
UNICEF ETHIOPIA/2016/ MULUGETA AYENESustainable Development Goals (SDGs)Ensure availabilityand sustainablemanagement of waterand sanitation for allMake cities and humansettlements inclusive, safe,resilient and sustainableEnsure sustainableconsumption andproduction patternsCombat climate changeand its impactsUNCRCArticle 24States parties recognize the right of the child to the enjoyment of the highestattainable standard of health and ensure the provision through, inter alia,the application of readily available technology and through the provision ofadequate nutritious foods and clean drinking water, taking into considerationthe dangers and risks of environmental pollution.23
IndicatorSource(%) household using improved drinking waterTotalEDHS 201664.8Rural56.5Urban97.3TotalEDHS 201153.7Rural41.7Urban94.5Total(%) household using improved, not sharedsanitation facilitiesValueEDHS 200561.4Rural56Urban93.7TotalEDHS 20166.3Rural3.9Urban15.9TotalEDHS 20118.3Rural6.6Urban14.1TotalEDHS 20056.8Rural4.9Urban(%) of population using open defecation (no facility/bush/field)18TotalEDHS 201632.9Rural37.7Urban6.8Person who usually collects drinking waterSee Graph 33Time taken to obtain drinking water (round trip)See Graph 34Percentage of households where place for handwashing was observed with soap and water byResidence and Region (%)See Graph 35Graph 34: Time to obtain drinking water (round trip)Graph 33: Person who usually collects drinking water at HHTotalAdult womanAdult manUrban1 .92.8Male child under age 150.9Other1 .211 2.57.276.802452 .641.72 0.120Total3.54.11 .344.535.310.25.6Water on premises8.30.212 .6Less than 30 minutes1 0.4Rural76.8406080UrbanGraph 35: Percentage of households where place for hand washing was observed with soapand water by residence and region (%)NationalRuralUrbanAddis AbabaHarariSNNPRBenishangul-GumuzTigrayAffarDire DawaGambelaOromiyaSomaliAmharaSource EDHS 20160.430 minutes or longer68.220.15.60.2Don’t know/missing57.71 6.6Water on premisesFemale child under age 6.85.2010203040
UNICEF ETHIOPIA/2016/ NAHOM TESFAYESustainable Development Goals (SDGs)Global partnershipfor sustainabledevelopmentStates Parties shall undertake all appropriate legislative, administrative, andother measures for the implementation of the rights recognized in the presentConvention. With regard to economic, social and cultural rights, States Partiesshall undertake such measures to the maximum extent of their availableresources and, where needed, within the framework of international co-operation.UNCRCArticle 4ACTUAL ODA DISBURSEMENT TO ETHIOPIA BY DONOR JULY 2013-JUNE 2014 (in USD L Group (394)1270.7234.725European Union (51)115.500International Financial Institutions (147)131.91036.30UN Group (92)403.9500TOTAL (684)1921.9127125Source DAG Annual Report 2013-201425
Ministry of Women and Children AffairsTel 251 11 518 4000Tel 251 11 552 8394Email: ethcommunication@unicef.orgEmail: gov.et
Mothers age 15-49 with a live birth in the five years preceding the survey receiving two or more tetanus toxoid injections during last pregnancy (%) EDHS 2016 41.1 EDHS 2011 33.8 EDHS 2005 28 EDHS 2000 17.2 Trends in Maternal Health Ca