Transcription
ResearchFallen Angels in the US creditmarketCharacteristics, historical performance and differencesbetween the current credit cycle and earlier regimesMay 2019 ftserussell.com
Table of contentsWhat is a Fallen Angel?3Characteristics of fallen angels versus other highyield issues3Why have Fallen Angels shown higher risk-adjustedreturns than other High Yield issues4Fallen Angel Bond Indexes, timing and empirical evidence5Return and performance characteristics7Size of Fallen Angel sector in Corporate Bond market8Caveats and concerns about the FA asset class9Covenant protection10Sector-specific nature of FA spikes11Risks for investors when do FAs become value traps?12Summary and conclusions14FTSE Time-Weighted US Fallen Angel Bond Index15ftserussell.com2
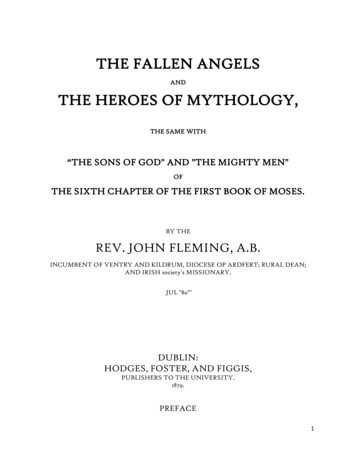
What is a Fallen Angel?A Fallen Angel (FA) is a corporate, or sovereign, bond downgraded fromInvestment Grade (IG) (minimum rating of BBB- with S&P, Moody’s or Fitch) toa High Yield credit rating (of BB , or below with S&P, Moody’s or Fitch). Thus,the downgrade from Investment Grade (IG) to High Yield (HY) is far moresignificant than a downgrade for a bond staying within the same asset class.FAs tend to have higher credit-beta than other HY issues as a result. Given thedistinct nature of the two asset classes, even the risk of an issue leaving the IGuniverse can cause advance selling of the bond, because an active IG portfoliomanager wishes to avoid being caught with a sub-IG holding. An indexed IGfund has no choice but to sell the FA. These factors may be compounded byinstitutional investors over-reacting to the bad news of the downgrade.Characteristics of fallen angels versus otherhigh yield issuesBecause FAs were issued as IG credits, they tend to have differentcharacteristics than other HY issues. Most notably they have (a) longer duration;(b) concentration in sectors subject to a recent specific shock (e.g., TMT after2000/01, financials after the Global Financial Crisis (GFC), and energy after theoil price collapse in 2014/15), when investors underweight the sector; (c) lowercoupons (since the bonds were issued at lower yields, increasing price volatility,versus HY issuers); (d) higher credit ratings; (e) weaker covenants (since theywere issued as IG credits); and (f) lower default rates relative to HY issuers, notleast because most FAs are B, or BB rated (see table). Chart 1 shows US BroadInvestment Grade issues have increased duration significantly since the GFC,while FAs have simply returned to about the same duration as before the GFCbut have greater duration than other high yield issues.FAs tend to have longer durationthan other HY issues, beconcentrated in sectors subjectto specific shocks, lowercoupons, higher credit ratings,weaker covenants (since theywere issued as IG credits), andlower default rates.Chart 1. Duration of US Fallen Angels versus US High Yield and InvestmentGrade issuesEffective Duration (yrs)8.07.06.05.04.03.0Investment GradeHigh 0082007200620052004200320022.0Fallen AngelSource: FTSE Russell as of April 30, 2019, using effective duration.ftserussell.com3
Why have Fallen Angels shown higher risk-adjustedreturns than other High Yield issuesFallen Angel bond indexes, like the FTSE Time-Weighted US Fallen Angel BondIndex (FABI)1 measure the performance of FAs after they enter the sub-IG assetclass. The FABI measures the performance of bonds issued by companiesdomiciled in the US and Canada. Index weights for FAs are highest for the first12 months, and then fall from months 13 to 61, using the formula 61 minus(number of months). It outperformed market-cap weighted HY issues in theperiod 2002 - 2016 (see Chart 2). It also has more duration than the broader HYindex, which would have helped relative performance during the 2011-16 period,given very low interest rates, and a benign credit environment. As noted earlier,FAs tend to have more duration than the rest of the HY asset class, since HYissuers may struggle to issue longer maturity bonds.Apart from the migration rate from IG to HY, historically FAs have outperformedother HY bonds after credit downgrades to HY. FAs’ outperformance in thecorporate bond market is based on FAs becoming oversold due to forced selling,after the downgrade to sub-investment grade, by funds which cannot hold sub-IGissues, so the bond suffers a “cliff-edge” effect on departure from the IG assetclass.Since the formal downgrade to sub-IG by ratings agencies is also generally wellflagged to markets (with the issuer going on “negative watch”, etc.) and IGrestricted funds are forced sellers, FA bonds tend to be oversold when enteringHY indexes and driven to artificially low prices relative to equivalent credits in theHY asset class. More generally, there is some evidence regulated investors canexploit sluggish adjustment in credit ratings to conduct regulatory arbitrage,taking advantage of the difference between actual credit risk, and the risk impliedby imperfect credit ratings.2 FAs also benefit from a higher proportion ofsubsequent credit upgrades than equivalent HY issues. This may be becauseprevious spikes in the proportion of FAs have reflected temporary financialpressure on long-standing businesses.12Fallen Angel bond indexes, like theFTSE Time-Weighted US Fallen AngelBond Index (FABI) measure theperformance of Fallen Angels afterthey enter the sub-IG asset class.Historically, FAs have outperformedother HY bonds after creditsdowngrades to HY. FA bonds tend tobe oversold when entering HY indexesand driven to artificially low pricesrelative to equivalent credits in the HYasset class.FTSE Time-Weighted US Fallen Angel Bond Index, please see Appendix.Does the bond market want informative credit ratings? J. Cornaggia and K. Cornaggia, May 2011.ftserussell.com4
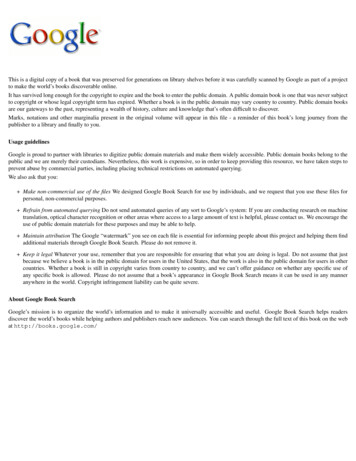
Chart 2. US Fallen Angels have outperformed US High Yield and InvestmentGrade issues (USD)Cumulative ment GradeHigh YieldFallen AngelSource: FTSE Russell as of April 30, 2019. Investment Grade data represents FTSE US BroadInvestment Grade Corporate Index, High Yield by The FTSE High-Yield Market Index, Fallen Angelby the FTSE Time-Weighted US Fallen Angel Bond Index, total returns in USD. Past performance isno guarantee of future results. Please see the end for important legal disclosures.Fallen Angel Bond Indexes, timing andempirical evidenceFrom an investor point of view, if FA join HY indexes at undervalued levelsrelative to equivalent HY credits, they should outperform the HY asset class, allbeing equal, over the credit cycle, and FA bond indexes should outperform HYindexes. Given the short-term negative impact of FAs leaving IG indexes, due toenforced selling, empirical evidence suggests FAs will see the sharpest drop inperformance shortly after a downgrade from IG is announced, provided FAs donot subsequently continue to fall through credit-rating zones. This is the logicbehind time-weighting a fallen angels bond index, like the FTSE FABI. There issome evidence that this phenomenon is not unique to credit markets and hasbeen also observed in equity markets. The timing effect of stocks leaving orjoining market indexes has been identified, but often short-lived3, reflecting theprecise reasons for stocks leaving or joining the specific index (e.g., whether onperformance enhancement grounds alone).Given the short-term negative impactof FAs leaving IG indexes, due toenforced selling, empirical evidencesuggests FAs will see the sharpestdrop in performance shortly after thedowngrade from IG is announced,provided FAs do not subsequentlycontinue to fall through credit-ratingzones.Most FAs will be downgraded to BB status in the initial move, and the backtesting on the impact of migration to HY has focused on the performance of theBB-rated FA, before and after the downgrade. The Cass Business School study4found FAs fell by 1.4% - 4.1%, depending on maturity, from 24 days before thedowngrade to seven days after, before recovering most of those losses in thesubsequent 23 days.3Changes in the Constituents of the S&P 500 Index and the Performance of the Index; E. Asem and S. Alam, University of Lethbridge, 2011.4Fallen Angels: the Investment Opportunity. September 2016, Cass Business School using Yield Book data.ftserussell.com5
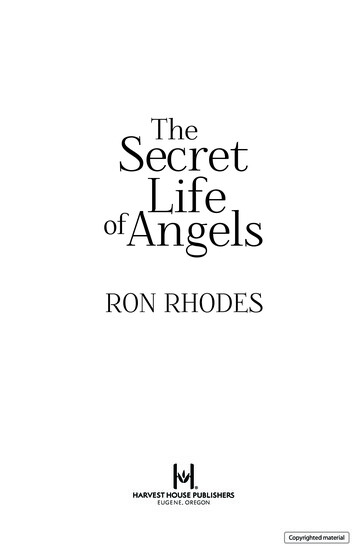
Using Yield Book data, the short-run performance of the FTSE FABI is shown inChart 3 for the sub-periods around the global financial crisis, when there was asudden surge in the number of Fallen Angels. It is interesting to note that FAsquickly recovered their underperformance during the downgrade process relativeto other corporate bonds, and subsequently showed steady outperformance.Chart 3. US Fallen Angels performance during (top) and after the global financial crisis (bottom)Cumulative Performance: Jan 2008 - Feb 200920%10%0%-10%-20%-30%-40%-50%-60%Fallen AngelHigh YieldInvestment GradeUS TreasuryUS EquityCumulative Performance: Mar 2009 - Dec 2013250%200%150%100%50%0%Fallen AngelHigh YieldInvestment GradeUS TreasuryUS EquitySource: FTSE Russell. Investment Grade data represented by FTSE US Broad Investment Grade Corporate Index, High Yield, by The FTSE HighYield Market Index, Fallen Angel, by the FTSE Time-Weighted US Fallen Angel Bond Index, US Treasury, by FTSE US Broad Investment GradeTreasury Index, US equity, by FTSE USA Index, total returns in USD. Past performance is no guarantee of future results. Please see the end forimportant disclosures.ftserussell.com6
Return and performance characteristicsLooking at the full time series since 2002, Table 1 shows higher annualreturns from FAs versus other fixed-income asset classes, with more volatility.Reflecting on the impact of the downgrade from IG to HY, FAs display higherstandard deviation of returns than HYs, though risk-adjusted returns were stillhigher. This is demonstrated in Chart 4, on option-adjusted spreads (OAS),which shows the spike in spreads after the three major sector-specific shockssince 2000 caused the sharp increase in the size of the FA population relativeto other HY issues. The correlation of returns with US equities (FTSE USAindex) is also lower for FAs than HYs more generally, illustrating the slightlyhigher credit quality.Since 2002, FAs have shown higherrisk-adjusted returns than HYs, USTreasuries, and US equities.Correlation with US equities is alsolower for FAs than HYs.Table 1. US FA performance and correlation characteristics relative to other US asset classes(January 2002 to end-April 2019)Monthly ReturnsFallen AngelHigh YieldInvestmentGradeUS Treasury(10 Years)US EquityMean0.980.660.460.330.72Standard deviation3.352.691.561.254.06Risk adjusted0.290.250.290.260.18Fallen AngelHigh YieldInvestmentGradeUS Treasury(10 Years)US EquityMean12.448.255.673.988.93Standard 4Fallen AngelHigh YieldInvestmentGradeUS TreasuryUS EquityAnnual ReturnsRisk adjustedCorrelation ofReturnsFallen Angel1.00High Yield0.931.00Investment Grade0.490.531.00US Equity0.610.690.21-0.18-0.200.60US Treasury (10 Yrs)(10 Years)1.001.00-0.33Source: FTSE Russell as of April 30, 2019. Investment Grade data represented by FTSE US Broad Investment Grade Corporate Index, High Yield, byFTSE High-Yield Market Index, Fallen Angel, by FTSE Time-Weighted US Fallen Angel Bond Index, US Treasury, by FTSE US Broad InvestmentGrade Treasury Index, US equity, by FTSE USA Index. Past performance is no guarantee of future results. Please see the end for importantdisclosures.There are also different elements to FA performance. Most performancemeasurement is relative to the HY asset class, but FAs also appear to benegatively correlated to US Treasuries and have shown favorable historical riskadjusted returns (see Table 1).ftserussell.com7
However, FAs and other HYs have typically underperformed IG credits and USTreasuries during a cyclical downturn. This has occurred when liquidity effectsbecome severe and the credit carry in HYs has become strongly negative. ButFAs have outperformed during cyclical upturns when credit quality improved, aswas the case from 2011-16 (see Chart 4).Therefore, the presumption that the FA migration impact from IG to HY onindividual credits can be reliably captured by the current spread differencebetween IG and HY indexes may prove unhelpful and is likely to be moreregime-specific.The share of FAs in the HY markethas generally increased in adownturn, but credit ratings arealready more defensive, and thebuild-up of BBB debt is partly M&Adriven. Companies also have astrong incentive to avoid migrationinto the HY market, given theincrease in the cost of capital thatfollows.Chart 4. Option-adjusted spreads of FA, IG and HY, each relative to USTreasuries30002500200015001000500Investment GradeHigh 20Fallen AngelSource: FTSE Russell as of April 30, 2019. Investment Grade data represented by FTSE US BroadInvestment Grade Corporate Index, High Yield, by FTSE High-Yield Market Index, Fallen Angel, bythe FTSE Time-Weighted US Fallen Angel Bond Index, US Treasury, by FTSE US Broad InvestmentGrade Treasury Index. Past performance is no guarantee of future results. Please see the end forimportant legal disclosures.Size of Fallen Angel sector in Corporate BondmarketBoth default rates (DRs) and the share of FAs in the HY market remain low byhistorical standards, despite weakening global growth and the general decline inthe credit quality of market indexes. This may be due to a long period of stable UScorporate earnings growth, a decrease in the use of key covenants for non-IGbonds, and the absence of a recent sector-specific shock. The share of FAs in theoverall HY market was much higher after the sector-specific shocks in 2014/15(energy sector), 2008/09 (financials), 2001/02 (TMT), as Chart 5 shows below.Of course it is quite possible that the share of FAs in the HY market nowincreases as generally happens in a downturn, but credit ratings are already moredefensive, and the build-up of BBB debt may be partly M&A driven. Companiesalso have a strong incentive to avoid migration into the HY market, given theincrease in the cost of capital that follows when credits lose their IG status.ftserussell.com8
Chart 5. US Fallen Angels as a share of the US High Yield 00520042003200220020%% Fallen Angel as share of Fallen Angel and High YieldSource: FTSE Russell as of April 30, 2019. High Yield data represented by FTSE High-Yield MarketIndex, Fallen Angel, by FTSE Time-Weighted US Fallen Angel Bond Index. Past performance is noguarantee of future results. Please see the end for important legal disclosures.Caveats and concerns about the FA asset classMuch of the recent coverage of FA credits focuses on the aggregate build-up inthe size of the (non-financial) corporate bond market, since the GFC, and thedecline in aggregate credit quality. The recent OECD paper5, points out that the(non-financial) corporate bond market has almost doubled in size in real termssince 2008 (growing to US 13 trillion in 2019). The surge in issuance hasoccurred in both developed and emerging markets, with the US and China thebiggest net issuers. The Bank of International Settlements reinforced theOECD warnings about the risks in the corporate debt market in its latestQuarterly Report.6Recent OECD paper points outthat non-financial corporate bondmarket has almost doubled in sizein real terms since 2008. Surge inissuance has occurred in bothdeveloped and EM.Global issuance by non-financial companies has averaged US 1.7 trillion perannum versus US 864 billion per annum with the peak years of issuance atUS 2 trillion in 2016 and 2017. The fastest growth has been in EM, growing fromUS 70 billion p.a. pre-crisis to a peak of US 711 billion in 2016, before falling by28.6% in 2017. The OECD also points out that within IG issues, declining creditquality is reflected in the increased share of BBB-rated bonds (54% vs only 30%in 2008), alongside a decline in AAA- and AA-rated issues. Thus, the OECD’sglobal corporate bond rating index has been in a downtrend since 1980 and hasremained below BBB for 9 years.5Corporate Bond Markets in a Time of Unconventional Monetary Policy”, 2019, OECD, February 2019.6BIS Sounds Alarm on Risk of Corporate Debt Fire Sale, Financial Times, March 6, 2019.ftserussell.com9
But different theories can fit the same set of facts and corporates gain financialflexibility from being in the BBB bucket, as opposed to A-rated, so a higher shareof BBB-rated issuers may partly be voluntary in this cycle for companies issuingdebt with very low coupons to finance M&As. It has also been suggested thatafter rating agencies, and financial markets, failed to spot the contagion risks insub-prime credit ratings before the GFC, they have overstated risks in ratingcorporate bonds since then. A related issue is how the independence problemfaced by information intermediaries, like rating agencies, may reduce theinformation content of their ratings.7At the aggregate level, given the quantity of corporate issuance now sitting in theBBB-rating bucket (US 3.6trn, or over 25% of the total market size), or just in theIG space, the OECD highlights the risk of an increase in downgrades to sub-IG,or potential FAs, should a sharp cyclical downturn materialize. This is becausethe proportion of bonds with the lowest IG rating is high historically (even if theshare of FA is low) and large-scale rating migrations have been linked historicallyto major macro-economic distress in downturns or recessions.On FA migration rates, the OECD notes that in 2009, 7.5% of BBB-rated issuerswere downgraded to sub-IG by the end of the year, compared to only 2.8% in2017. Therefore, if downgrades matched the 2009 levels (7.5%) that wouldequate to US 274bn migrating to the sub-IG sector, or a Fallen Angel sector sizeclose to US 500bn. But this appears to be a worst-case scenario, given that2008/09 was an extreme financial sector and systemic shock in a sector withhigh leverage and correlation risk to other sectors.Large-scale rating migrations havebeen linked historically to majormacro-economic distress in downturnor recessions.This appears to be a worst-casescenario, given that 2008/09 was anextreme financial sector and systemicshock, in a sector with high leverage,and correlation risk.Covenant protectionLess covenant protection has also been part of the decline in credit quality in HYissues, as the OECD points out. The search for yield has weakened covenantson North American non-IG corporate bonds, although the covenants on IG bondshave been more stable.The types of covenants on non-IG bonds may explain this, since specificcovenants, (1) restricting payouts to shareholders and (2) restricting the issuanceof additional debt, have become much less common – this being consistent withbond investors trading off higher yields for less protection in a low interest rateregime.The search for yield has allowedcovenants to weaken on NorthAmerican non-IG bonds, though IGcovenants have been more stable.Weaker covenants on HY is apositive for potential FAs, sinceother HY issues are less wellprotected compared to FAs.Weaker covenants on HY issues during this cycle is a positive for potential FAs,since other HY issues are less well protected than during previous credit cycles,compared to FAs.Low default rates (DR) may mask the risk that DRs tend to be clustered duringcrises, so a 2.4% DR in 2017 among non-IG issuers may be artificially low,though it may also reflect lower corporate borrowing costs. The decline incovenant protection may also be artificially restricting default rates among HYissuers but note that FAs are generally B- or BB-rated and have higher creditratings than HY issues.Low default rates (DR) may maskrisk that DRs tend to be clusteredduring crises, though it may alsoreflect lower corporate borrowingcosts.7The Informational Effects of Firm-Funded Certification: Evidence from the Bond Rating Agencies, S. Bonsall IV, Pennsylvania StateUniversity, January 2012.ftserussell.com10
Sector-specific nature of FA spikesEmpirical data also confirms the sector-specific nature of previous spikes in FAs.Apart from 2008/09, increases in FAs have been confined to one sector and tosectors closely linked to the epicenter of the shock, as in energy in 2014/15.Charts 6 and 7 show the weight composition by sectors and the greater volatilityin sector weightings among FAs relative to HYs.Chart 6. US Fallen Angel sector weights endentSource: FTSE Russell as of April 30, 2019. FTSE High Yield data represented by FTSE High-YieldMarket Index, Fallen Angel, by FTSE Time-Weighted US Fallen Angel Bond Index. Past performanceis no guarantee of future results. Please see the end for important legal disclosures.Chart 7. US High Yield sector weights 05200520060%Ind-ConsumerInd-OtherBankSource: FTSE Russell as of April 30, 2019. FTSE High Yield data represented by FTSE High-YieldMarket Index. Past performance is no guarantee of future results. Please see the end for importantlegal disclosures.ftserussell.com11
Fitch8 points out the build-up in low IG US corporate sector debt is also due toM&A activity, accompanied by EBITDA growth, and that credit ratings shouldwithstand normal cyclicality. Similarly, Fitch expects de-leveraging after the surgein M&A activity, which is expected to drive leverage lower in 2019/20 in REITs,food, beverage and tobacco, building materials and construction companies.Corporates have also taken advantage of the historically low cost of debt, both inspread and absolute terms, to issue more debt.Furthermore, Moody’s9 notes that although potential FAs in the US rose to 49 inQ4, 2018, potential rising stars (bonds upgraded to IG from HY status) alsoincreased to 31 from 28 the highest since the time series began in 2012.During 2018, potential rising stars rose to 44, from only 16 in 2017, reflectingstable growth, positive credit fundamentals and low DRs.Risks for investors when do FAs becomevalue traps?Most of the work to date on the performance in FAs has focused on either (1)ratings downgrade/timing issues (e.g., the FTSE FABI), (2) sector-specificshocks (e.g., oil price collapse in 2014/15, telecoms and technology bust in2001/02) or (3) aggregate credit indicators, like credit spreads, the ratio of creditupgrades to downgrades, and historical migration rates from Investment grade toHigh Yield (see the recent OECD study and also Venizelos10). This may reflectprevious historical experience when FA rose, like the telecoms bubble in2001/02, or the crash in financials in 2008/09.This raises the question of FA performance over a full credit cycle, and relativeto other asset classes, apart from HY. There is some evidence, for an earlierperiod between 2001 and 2005, from Ellul et al (2011)11, when interest rateswere rising. This suggests that after a downgrade from IG, FAs were subject to‘fire’ sales, resulting in -9% abnormal returns, while other downgraded bondssuffered -3% returns (the difference disappearing after only 30 weeks).However, the main cause of the short-term underperformance by FAs wasregulatory-induced selling by insurance companies after a downgrade from IGto HY, and not rising interest rates.The OECD also points out that because regulations since the GFC have leddealer banks to reduce their inventories and market making, the effect of suchfire sales may be stronger in a future downturn. 12 But the FTSE FABI showsoutperformance since 2001 versus other HY issues (see Chart 2 on cumulativereturns), which captures a full credit cycle, and the shift to a lower inflation andnominal GDP growth regime in 2008/09.8Fitch Ratings; Surge in BBB US corporate debt may not yield more fallen angels, January 28, 2019.9Moody’s on Fallen Angels.Most of the work to date on FAs hasfocused on either ratingsdowngrades/timing issues, sectorspecific shocks, or aggregate creditindicators.Previous credit cycles in 1990, 2000and 2008 did show strongrelationship between a decrease incredit quality and default rates, butFAs rarely move from IG to outrightdefault.10Bond Investors Beware Fallen Angels “, Greg Venizelos, Axa Research and Strategy, January 31, 2018.11Andrew Ellul et al, Regulatory Pressure and Fire Sales in the Corporate bond Market, Journal of Financial Economics, vol 101, No 3, 2011.12Celik, Demirtas and Isaksson; Corporate Bonds, Bondholders and Corporate Governance, OECD Corporate. Governance Working Papers,No 16, 2015.ftserussell.com12
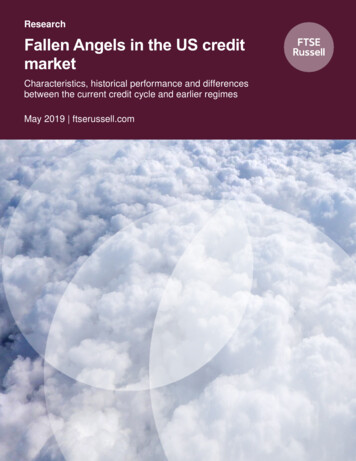
Previous credit cycles in 1990, 2000 and 2008, did show a strong relationshipbetween a decrease in credit quality and an increase in default rates, but FAsrarely moved from IG to outright default, apart from cases of outright fraud(Parmelat and Enron), or systemic failure (Lehman’s etc., in 2008/09). FAs havealso benefited from a higher proportion of subsequent credit upgrades thanequivalent HY issues. This may be because previous spikes in the proportion ofFAs have reflected temporary financial pressure on long-standing businesses.A series of FA rating downgrades, across sectors, following the initial downgradeto sub-IG, and strong default contagion, would be the most adverse scenario forFA valuations, and pose a value trap for investors. But previous sector-specificshocks have not developed in this way (even if the 2008/09 financial shockshowed higher default contagion) and corporates have been able to borrow atmuch lower interest rates in this cycle, than in 2007/08. Concentration ofcorporate debt in cyclically or structurally exposed sectors (like retailing) with lowrevenue growth, would increase the risk of a value trap. But in the US, much ofthe corporate debt build-up in recent years has been in more defensive sectors(like telecoms and utilities) with the debt issued at much lower yields than in2007/08, or 2002/03. Chart 8 shows this concentration of debt, and the spike inthe energy sector’s net debt after the sector-specific shock of 2014/15.A series of FA rating downgrades,across sectors, following initialdowngrade to sub-IG, and strongcontagion, would be most adversescenario for FA valuations, butprevious sector shocks have notdeveloped in this way.Chart 8. US Equity Sector Net Debt/EBITDA1086420-219992001 20032005 20072009 20112013 20152017 2019Oil & GasIndustrialsConsumer GdsHealthcareTelecomUtilitiesSource: FTSE Russell and Refinitiv as of April 30, 2019. Past performance is no guarantee of futureresults. Please see the end for important legal disclosures.This reinforces the case for the OECD projection being a worst-case scenario.S&P (December 2018) scenario analysis projects the size of the sector atUS 200-250bn in the next recession, in line with previous cycles as a share ofthe HY market, suggesting BBB-downgrade risks may be overstated. This isbased on the view that 84% of BBB-debt leveraged above 5x EBITDA is in thereal estate, regulated utilities and transmission/transport sectors. Nor do financialconditions suggest the same type of deep recession and default contagion thatoccurred in 2008/09 is likely. Chart 9 shows financial conditions remainsignificantly less restrictive. This does not mean a sector-specific shock andspike in FAs can be ruled out, but macro-economic and financial stress indicatorsfor the US do not suggest risks are high relative to the 2008/09 highs.ftserussell.comOECD projection for growth in FAmarket may prove a worst-casescenario, given that 84% of BBBleveraged debt is in real, estate,utilities and transport sectors.13
Chart 9. US Financial Conditions5Financial conditionstightenHistorical FA migration rates from IGmay then be adjusted for the creditand economic cycle.43212004Financial conditionsloosen2006200820102012201420162018US Financial Conditions Indicator ScoreSource: FTSE Russell as of April 30, 2019. US FCI scores calculated using Z-Score methodologybased on 5 greater than -1.5 standard deviation (SD) from average, 4 greater -0.5 less than -1.5;3 between-0.5 and -0.5; 2 greater than 0.5 less than 1.5; and 1 greater than 1.5.Summary and conclusionsA comprehensive and systematic approach for FA risks and performancemeasurement includes (1) macro-economic indicators, like the creditcycle/corporate earnings growth, corporate indebtedness, and monetary policysettings, as well as (2) aggregate credit indicators (ratio of upgrades todowngrades, migration rates, spreads), and (3) the risk of sector-specific shocks(e.g., retailing at present, as the business migrates to the internet).Empirical evidence from 2001 - 2016shows outperformance by FAsrelative to HY particularly, but alsoversus IG.Looking at these indicators can help investors assess the potential changes in thenumber of FAs, and how they may perform over longer time periods compared toother asset classes, as opposed to other HY issues only. Previous FA migrationrates from IG may then be adjusted for the credit and economic cycle.High migration rates/probabilities from IG to HY, and higher default rates havecharacterized previous periods of economic stress, like 2001/2002, andparticularly 2008/2009. But the share of FAs in the HY market was notably higherbefore t
Why have Fallen Angels shown higher risk-adjusted returns than other High Yield issues Fallen Angel bond indexes, like the FTSE Time-Weighted US Fallen Angel Bond Index (FABI)1 measure the performance of FAs after they enter the sub-IG asset class. The FABI measures the performance of