Transcription
Business OverviewMay 2021
Safe Harbor Disclosure and DefinitionsCautionary Statement Regarding Forward-Looking InformationThis presentation may contain “forward looking statements” within the meaning of the Private Securities Litigation Reform Act of 1995. All statements thatare not historical facts are “forward looking statements.” The use of words such as “anticipates,” “estimates,” “expects,” “plans” and “believes,” among others,generally identify forward looking statements. These forward-looking statements include, among others, statements relating to: Match Group’s futurefinancial performance, Match Group’s business prospects and strategy, anticipated trends, the completion of the acquisition of Hyperconnect, and othersimilar matters. These forward looking statements are based on management’s current expectations and assumptions about future events, which areinherently subject to uncertainties, risks and changes in circumstances that are difficult to predict. Actual results could differ materially from thosecontained in these forward-looking statements for a variety of reasons, including, among others: competition, our ability to maintain user rates on ourhigher monetizing dating services, our ability to attract users to our dating services through cost-effective marketing and related efforts, foreign currencyexchange rate fluctuations, our ability to distribute our dating services through third parties and offset related fees, the integrity and scalability of oursystems and infrastructure (and those of third parties) and our ability to adapt ours to changes in a timely and cost-effective manner, our ability to protectour systems from cyberattacks and to protect personal and confidential user information, risks relating to certain of our international operations andacquisitions, certain risks relating to our relationship with IAC post-separation, the impact of the outbreak of COVID-19 coronavirus, the risks inherent inseparating Match Group from IAC, including uncertainties related to, among other things, the expected benefits of the separation, any litigation arising outof or relating to the transaction, the tax treatment of the transaction, and the impact of the separation on the businesses of Match Group, anduncertainties related to the pending acquisition of Hyperconnect, including, among other things, the costs and expected benefits of the transaction, theexpected timing of the transaction or whether it will be completed, any litigation arising out of or relating to the transaction, and the impact of thetransaction on the businesses of Match Group. Certain of these and other risks and uncertainties are discussed in Match Group’s filings with the Securitiesand Exchange Commission. Other unknown or unpredictable factors that could also adversely affect Match Group’s business, financial condition andresults of operations may arise from time to time. In light of these risks and uncertainties, these forward-looking statements may not prove to be accurate.Accordingly, you should not place undue reliance on these forward-looking statements, which only reflect the views of Match Group management as ofthe date of this presentation. Match Group does not undertake to update these forward-looking statements.Non-GAAP Financial MeasuresThis presentation includes certain non-GAAP financial measures in addition to financial measures presented in accordance with U.S. GAAP. These nonGAAP financial measures are in addition to, and not a substitute for or superior to, measures of financial performance prepared in accordance with U.S.GAAP. See page 13 & 14 for a reconciliation of the non-GAAP financial measures to their most comparable GAAP measure.Definitions“Average Subscribers” is the number of Subscribers at the end of each day in the relevant measurement period divided by the number of calendar days inthat period. Subscribers as of any given time represent the number of users who purchased a subscription to one of our services at that time. Users whopurchase only à la carte features are not included in Subscribers. Unless otherwise noted, Subscribers refers to Average Subscribers in this presentation.‘‘ARPU’’ or Average Revenue per Subscriber, is Direct Revenue from Subscribers in the relevant measurement period (whether in the form of subscriptionor à la carte) divided by the Average Subscribers in such period and further divided by the number of calendar days in such period. Direct Revenue fromusers who are not Subscribers and have purchased only à la carte features is not included in ARPU. Direct Revenue is revenue that is received directly fromend users of our services and includes both subscription and à la carte revenue. "North America" or "NA" as used in this presentation refers to the UnitedStates and Canada. Our portfolio of brands includes Tinder , Match , PlentyOfFish , Meetic , OkCupid , OurTime , Pairs , and Hinge , as well as anumber of other brands, each designed to increase our users’ likelihood of finding a meaningful connection.2
Who We AreA global leader in dating products with a portfolio of recognized brandsWe offer services in over 40 languages to our users all over the world11.1 million Average Subscribers1 2.5 billion Revenue and 952 million Adjusted EBITDA2 60% of relationships in the U.S. that started on a dating site / app began on a Match Group product 3is the #1 downloaded and top-grossing dating app worldwide4is the highest-grossing app overall worldwide5Average Subscribers as of Q1 2021For last twelve months through March 31, 2021the last twelve months ending November 2020 in the U.S., per Match Group internal survey (November 2020)4 Per AppAnnie for the last twelve months through March 31, 20215 Per AppAnnie for the last twelve months through March 31, 2021 across all apps, excluding games123 For3
Our Largest Brands Mobile app launched in 2012 Launched in 1995 Available worldwide #1 in unaided brand awareness Grew virally to become thelargest dating app in the world Launched in 2011 and acquired in2018in the U.S. for singles over 301on relationship-mindedMillennialsonline dating brands throughoutEurope Higher relationship intent Higher relationship intent, Launched in 2003 and acquired Launched in 2004 and acquired Broad appeal in the central U.S., User base that valuesin 2015 Differentiated product focused Operates a portfolio of leadingCanada, and the U.K.similar to Matchin 2011individuality Focuses on provocative Q&A andmathematical insights intopotential matches Launched in 2012 and acquired in2015 #1 dating app in Japan Higher relationship intent1 50 focused dating app withlarge presence in US andgrowing presence in Europe Mobile-first brands within MatchAffinity Focused on Latino, Black andChristian communitiesRanked #1 in unaided brand awareness for online and offline singles in the U.S. per Match Group internal survey (November 2020)4
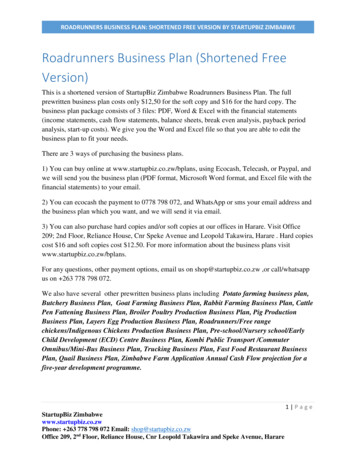
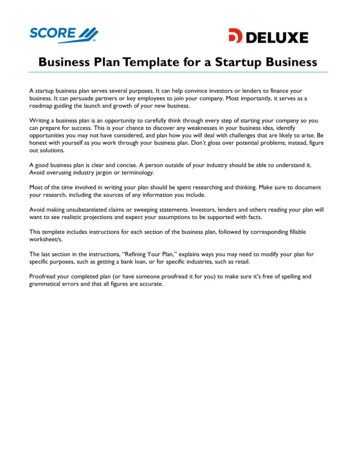
Exceptional Revenue Growth with Expanding MarginsTotal RevenueOperating Income(As reported, in millions)Adjusted EBITDA(As reported, in millions)(As reported, in millions) 897 746 2,391 778 645 2,051 652 549 1,730 467 1,3312016 402 357 1,118 2020Operating IncomeNote: All results are as reported for continuing 0Adjusted EBITDAMargin5
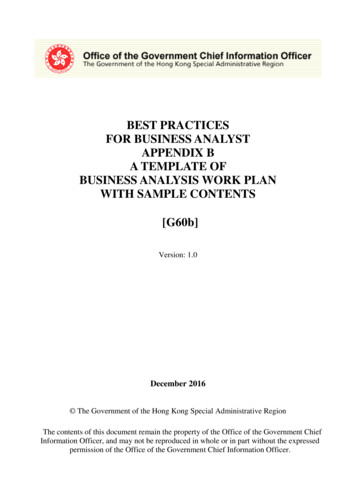
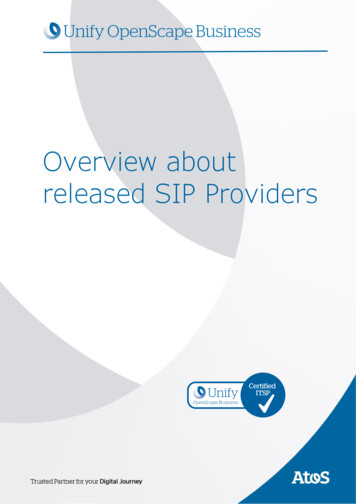
Revenue Driven by Global Growth in Subscribers and ARPUAverage Subscribers (in millions)11.19.98.66.17.45.34.35.93.52.53.4Q1 '174.04.44.65.0Q1 '18Q1 '19Q1 '20Q1 '21 0.59 0.64North AmericaARPU 0.53 0.58 0.58InternationalGrew Average Subscribers nearly 2x since Q1’176
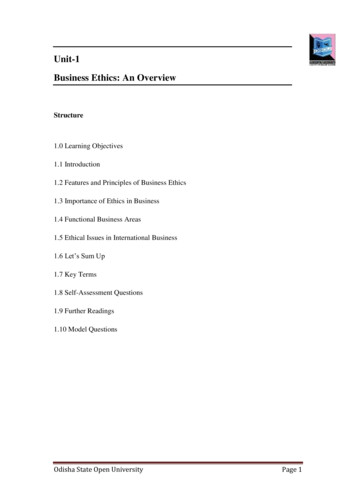
Tinder: Global Success Story Incubated internally and launched in 2012 Revolutionary dating product with unparalleled global organic adoption Launched as mobile-only product with patented user interface and Swipe feature Monetization began in Q1 2015 and grew to 1.4 billion annual revenue in 2020Massive Revenue GrowthDriven by Subscribers and ARPUDirect Revenue (in millions)Tinder Average Subscribers (in millions)6.9 1,3556.0 1,1524.73.5 8051.9 403 PU increased 49% since Q1’177
Tinder: MonetizationSubscriptionTinder Plus Tinder Gold Tinder Platinum First subscription product Global rollout in Q3 2017 Launched in Q4 2020 Launched in Q1 2015 Includes all Tinder Plus features inaddition to new ‘Likes You’ feature Offers two additional features: Added features include‒ Unlimited Likes & Rewinds‒ Passport to any location‒ Additional Boosts / Super Likes Priced at premium to Tinder Plus Drove meaningful increase in bothARPU and conversion‒ Priority Likes‒ Message Before Match Priced at premium to Tinder Gold‒ No adsÀ la carte Super Like, Boost, Super Boost,Top Picks and Read ReceiptfeaturesAdvertising Direct premium sales Third party programmatic Super Boost and Top Picksavailable for purchase tosubscribers only Non-subscribers a relativelysmall portion of à la cartepurchasers8
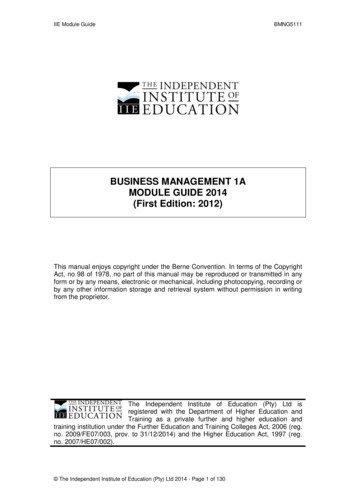
Exceptional Competitive PositionMatch Group owns 4 of the top 6 brands in the U.S.Tinder: Unparalleled viral growthBased on respondents who used dating products over the past90 days (U.S.)1Global cumulative downloads (benchmarked to launch date)2Downloads ('000s)Founded in 2012Founded in 2003Founded in 2011Founded in 1995Months since launchFragmented competitive landscape globally, but no brands approach the scale of Match Group12Percent of respondents aged 18 – 29 who used dating products over the past 3 months in the U.S. per Match Group internal survey (November 2020)Source: App Annie as of April 20219
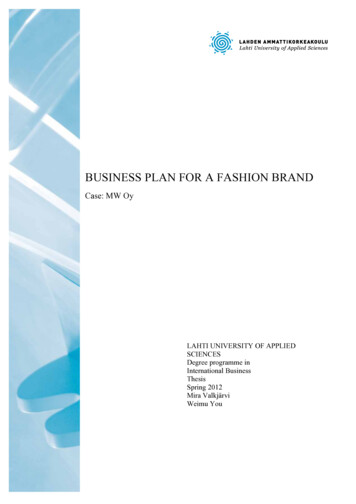
Underpenetrated Category Provides Secular TailwindsNorth America and Europe Significant runway remains – more than halfof singles have never tried dating products Category usage continues to grow‒More singles using dating products‒Increasing multiple-app usage Massive opportunity, 75% of global singles 2/3 of singles have never tried datingproducts‒Comparable to U.S. and Europe usageprior to 2012 Young and very mobile-savvy populationDating Product Usage129%APAC / Africa / Middle East / LatAm47%39%Dating Product Usage116%All U.S. Singles42%18-24 U.S. Singles2012201844%29%# of Apps Used – U.S.22.22.0All Ages17%4.23.32015122018Under 3511%IndiaJapanS. KoreaMatch 2018 survey. Percent of respondents that have ever used a dating app or site (single, and not in a relationship)Match 2018 survey.TaiwanBrazil10
Match Group HighlightsA leading provider of dating services with global footprint of marquee assetsSignificant global opportunity with strong growth driversUnique portfolio approach caters to a broad spectrum of usersProven, highly sophisticated monetization strategyStrong top and bottom-line growth with expanding marginsRobust free cash flow generation and natural deleveragingProven management team with strong focus on shared learning11
Appendix12
GAAP to Non-GAAP ReconciliationsYear Ended December 31,Net (loss) earnings attributable to Match Group, Inc. shareholdersAdd back:Net earnings attributable to noncontrolling interestsLoss (earnings) from discontinued operations, net of taxIncome tax provision (benefit)Other (income) expense, netInterest expenseOperating IncomeStock-based compensation expenseDepreciationAmortization of intangiblesAcquisition-related contingent consideration fair value adjustmentsAdjusted EBITDADirect RevenueIndirect RevenueRevenueOperating income marginAdjusted EBITDA marginLTM as ofQ1'212016( 41.3)2017 304.92018 627.02019 431.12020 128.625.1192.461.7(7.9)82.2312.352.429.816.9(9.2) 402.253.1(9.0)(105.2)30.382.8356.969.134.71.55.3 467.4130.8(306.6)11.3(7.5)94.6549.566.034.81.30.3 652.0112.7(49.2)8.22.0140.6645.589.734.48.7 778.359.3366.132.9(15.9)174.8745.7102.341.37.5 896.830.534.165.9(10.7)164.0797.6111.242.31.3 952.5 1,067.4 1,281.3 1,677.2 2,007.2 2,344.750.749.452.744.146.5 1,118.1 1,330.7 1,729.9 2,051.3 2,391.3 2,465.149.2 2,514.228%36%27%35%32%38%31%38%31%38% 513.932%38%13
GAAP to Non-GAAP Reconciliations2019Net earnings (loss) attributable to Match Group, Inc. shareholdersAdd back:Net earnings attributable to noncontrolling interestsLoss (earnings) from discontinued operations, net of taxIncome tax (benefit) provisionOther expense (income), netInterest expenseOperating IncomeStock-based compensation expenseDepreciationAmortization of intangiblesAdjusted EBITDAQ1Q2Q3Q4 88.7 113.5 128.5 100.42020Q1Q2Q3Q4( 202.8) 66.4 132.6 140.62021Q1 174.324.333.331.223.84.7 (27.6) (22.0)(4.3)(29.1) 21.11.215.01.5(2.5)(2.8)5.927.533.539.040.6117.6 171.3 175.2 181.328.022.020.818.98.38.88.58.80.40.40.67.3 154.3 202.5 205.2 216.328.431.9(0.6)(0.4)332.034.6(0.5)(48.2) 34.423.625.6(3.9) (17.4)1.93.531.945.643.243.3137.4 195.6 200.2 212.621.222.137.321.69.49.711.211.06.40.40.50.3 174.3 227.8 249.2 245.5(0.4)(17.7)1.331.8189.330.110.50.2 230.0Direct RevenueIndirect RevenueRevenueOperating income marginAdjusted EBITDA margin 454.0 487.3 530.9 535.010.710.710.512.2 464.6 498.0 541.5 547.225%34%32%33%33%41%38%40% 534.8 546.7 628.3 634.99.88.711.516.5 544.6 555.5 639.8 651.425%35%31%33%32%41%39%38% 655.212.4 667.628%34%14
Trended Key Metrics2020Q1Q2Q3Revenue (in millions, rounding differences may occur)Direct RevenueNorth America 263.3 284.3 321.8International271.5262.4306.5Total Direct Revenue534.8546.7628.3Indirect Revenue9.88.711.5Total Revenue 544.6 555.5 639.8Q42021Q1 315.8319.1634.916.5 651.4 326.8328.4655.212.4 667.6 673.9393.41,067.450.7 1,118.1 741.3539.91,281.349.4 1,330.7 902.5774.71,677.252.7 1,729.9 1,024.2983.02,007.244.1 2,051.3 1,185.31,159.42,344.746.5 2,391.3Average Subscribers (in thousands)North America4,570International5,344Total Average 10,430ARPUNorth AmericaInternationalTotal ARPU 0.65 0.53 0.58 0.66 0.58 0.62 0.66 0.58 0.62 0.70 0.59 0.64 0.63 0.55 0.59 20160.560.500.54Year Ended December 31,201720182019 0.560.510.54 0.590.560.57 0.610.560.582020 0.650.560.6015
‒ More singles using dating products ‒ Increasing multiple-app usage Massive opportunity, 75% of global singles 2/3 of singles have never tried dating products ‒ Comparable to U.S. and Europe usage prior to 2012 Young and very mobile-savvy population Dating Product Usage1 2.