Transcription
g and p teacher guide year 3 supplement summer3grammar andpunctuationyear3supplement toteacher guidesummer
nfer tests – grammar and punctuation – year 3Copyright detailsFirst published 2018by the National Foundation for Educational Research,The Mere, Upton Park, Slough, Berkshire SL1 2DQwww.nfer.ac.uk National Foundation for Educational Research 2018Registered Charity No. 313392All rights reserved. No part of this document may be reproduced or transmitted in any form or byany means, electronic, mechanical, photocopying, or otherwise, without prior written permission ofNFER, unless within the terms of licences issued by the Copyright Licensing Agency.To access the age standardised score converter and question grid spreadsheets,you will need to go to our secure School Portal on the NFER’s website:www.nfer.ac.uk/portaland then enter yourNFER Number:Project Number:Unique Password:You may like to record them above for quick reference in the future.The letter and despatch notes that accompanied the test materials are pre-populatedwith the details of the numbers and password.If you have lost the letter and despatch notes, the portal website has links where you canrequest your details again. NFER
NFERnfer tests – grammar and punctuation – year 3Using the outcomes of the testThis section provides teachers with information to convert pupils’ test scores into more usefulmeasures of their attainment.If the year 3 grammar and punctuation test is undertaken and marked in line with the guidance inthis booklet, then both a standardised score and an age standardised score can be derived from apupil’s test score.Standardised scores enable a comparison to be made between the performance of a pupil and thatof other pupils who have taken the test. Age standardised scores mean that the comparison is withpupils who, in the case of the NFER tests, are the same age in years and completed months.The starting point for this outcome is to total a pupil’s marks from the grammar and punctuationtest. A box is provided on the front of the test to assist in this. This gives each pupil’s total score or‘raw’ score.In order to obtain reliable standardised scores and age standardised scores, you should administerthe test according to the guidance given in this booklet. It is particularly important that you markthe questions strictly according to the mark scheme and observe time limits. If not, the informationderived from this section cannot be used reliably.If you wish to record and explore patterns of performance across the test as a whole, or across thewhole class, you may find it helpful to complete a question grid. For each question, the questiongrid shows the average mark of pupils in the standardisation sample. Completing pupils’ scores inthe question grid will enable you to compare areas of performance with a nationally representativesample of year 3 pupils. The grids are available from the following website, which will require onlineregistration for access: www.nfer.ac.uk/portal3
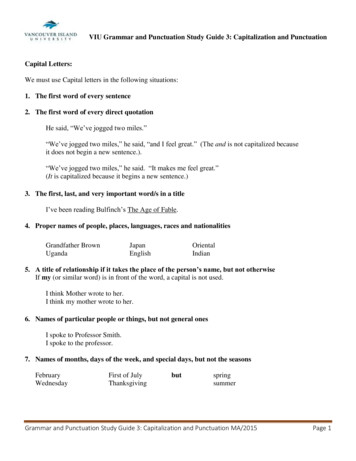
nfer tests – grammar and punctuation – year 3 NFERStandardised scoresStandardised scores enable a comparison to be made between the performance of a pupil and thatof other pupils who have taken the same test. The average nationally standardised score is 100.About two-thirds of pupils will have standardised scores between 85 and 115 and scores within thisrange can be broadly described as ‘average’.For example, a teacher administered the test to her class in June. One pupil, Lucy, achieved a rawscore of 19 on the test, giving her a standardised score of 101. The teacher could then say that Lucyachieved an average score on the test.Almost all pupils fall within the range 70 to 140, so scores outside this range can be regarded asexceptional. These exceptional scores are marked with *** on the charts below as standardisedscores cannot be calculated with the necessary statistical reliability. If an exact score is needed, forexample to calculate an average score for the class, 69 or 141 should be used as appropriate forthese pupils.It is worth noting here that the scaled score of 100 defined by the Department for Educationas the national expectation at the end of Key Stage 2 is not the same as, nor equivalent to, astandardised score of 100 on these tests. On NFER tests, a standardised score of 100 representsthe average performance, based on a normal distribution, of the sample of pupils on which thetests were standardised. At the end of Key Stage 2, the DfE’s scaled score of 100 represents the‘expected standard’ and is not the average.In order to save time and ensure accuracy, you can download a spreadsheet which will calculateeach pupil’s standardised score and age standardised score if you enter their total score, date ofbirth and date of test. The spreadsheet can be found at www.nfer.ac.uk/portal4Raw scoreStandardisedscoreRaw 92
NFERnfer tests – grammar and punctuation – year 3Confidence bands for standardised scoresConfidence bands are used to show the extent of the margin of error in the standardised scores.In other words, they show how accurately the test measures pupils’ ability in grammar andpunctuation.The margin of error accounts for the fact that the score is a statistical estimate, based on the factthat tests can only sample the particular area of learning which they assess and that therefore thescore a pupil achieves may vary within a few points of their ‘true score’. To indicate how wide thismargin of error is likely to be, a ’90 per cent confidence band’ has been calculated. This means thatyou can have 90 per cent certainty that the true score lies within the confidence band.The table below gives the numbers that should be added to and subtracted from pupils’standardised scores at different score points to form the 90 per cent confidence bands.Standardised scoreTo form 90% confidence band:subtractadd72, 74, 7671178, 80, 8281184, 86, 87, 8981091, 92, 9491097, 99, 101, 10399105, 108109110, 113, 116108120, 123118128117136127Here is an example of calculating the confidence bands. Three pupils, Agata, Nathan and Preeti,have standardised scores of 103, 99 and 128 respectively. For Agata, with a standardised score of103 in this test, the 90 per cent confidence band is minus 9 and plus 9. Therefore, you can be 90 percent certain that Agata’s true score is between 94 and 112.Both Nathan, who has a standardised score of 99, and Agata are working at about the average fortheir age. There is no statistical difference between their scores: Nathan’s true score is between 90and 108.However, Preeti, with a standardised score of 128, has a 90 per cent likelihood of having a true scorebetween 117 and 135, and has scored higher, in statistical terms, than Agata or Nathan.For high and low scores, the confidence bands are asymmetrical (they tend to be pulled towards theaverage test score).5
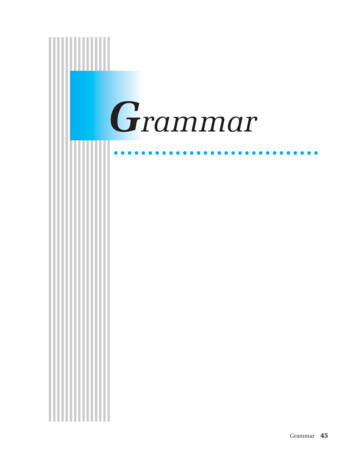
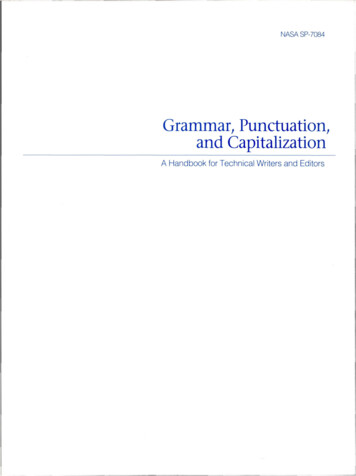
nfer tests – grammar and punctuation – year 3Age standardised scoresAge standardised scores take into account a pupil’s age in years and months, in order that his or herperformance can be compared with the performance of other pupils of the same age in a nationallyrepresentative sample. The age standardisation that has been undertaken means that these testscan be administered at different points in the school year and comparative information still beobtained. The standardised scores in this booklet cover the age range 7 years 0 months to 8 years11 months. If you have decided to give a test to pupils outside this range, you will not be able to usethe table. You will still, however, be able to calculate standardised scores.In order to save time and ensure accuracy, you can download a spreadsheet which will calculateeach pupil’s standardised score and age standardised score if you enter their total score, date ofbirth and date of test. The spreadsheet can be found at www.nfer.ac.uk/portalIf you have not downloaded the spreadsheet, you should convert the total score into an agestandardised score as follows: list the ages of all pupils in your class in years and completed months at the time of testing for each pupil, locate his or her age in years and months along the top of the table on pages 8-9 locate the pupil’s total score (raw score) down the left side of the table read off the age standardised score from where the row and column meet.The average age standardised score is 100, based on the performance of a nationally representativesample. About two-thirds of pupils will have age standardised scores between 85 and 115 andscores within this range can be broadly described as ‘average’. Almost all pupils fall within the range70 to 140, so scores outside this range can be regarded as exceptional. These exceptional scores aremarked with *** on the table on pages 8–9 as age standardised scores cannot be calculated withthe necessary statistical reliability. If an exact score is needed, for example to calculate an averagefor the class, 69 or 141 should be used as appropriate for these pupils. As age standardised scorestake the ages of pupils into account, it is possible that a younger pupil may have a lower raw scorethan an older pupil but a higher age standardised score. This is because the younger pupil may havea higher performance relative to his or her own age group than the older pupil.Age standardised scores from the reading, mathematics, grammar and punctuation, and spellingtests cover generally the same range, so for most pupils, performance on the grammar andpunctuation tests can be compared directly to performance on the other NFER tests.As mentioned for standardised scores, the scaled score of 100 defined by the Department forEducation as the national expectation at the end of Key Stage 2 is not the same as, nor equivalentto, an age standardised score of 100 on these tests. On NFER tests, an age standardised score of100 represents the average performance, based on a normal distribution, of the sample of pupils ofa specific age on which the tests were standardised. At the end of Key Stage 2, the DfE’s scaled scoreof 100 represents the ‘expected standard’ and is not the average.6 NFER
NFERnfer tests – grammar and punctuation – year 3Confidence bands for age standardised scoresConfidence bands are used to show the extent of the margin of error in the age standardised scores.In other words, how accurately the test measures the pupil’s ability in grammar and punctuation.The margin of error accounts for the fact that the score is a statistical estimate, based on the factthat tests can only sample the particular area of learning which they assess and that therefore thescore a pupil achieves may vary within a few points of their ‘true score’. To indicate how wide thismargin of error is likely to be, a ’90 per cent confidence band’ has been calculated. This means thatyou can have 90 per cent certainty that the true score lies within the confidence band.The table below gives the numbers that should be added to and subtracted from pupils’ agestandardised scores in different score ranges to form the 90 per cent confidence bands.Standardised scoreTo form 90% confidence band:subtractadd70 - 7671177 - 8281183 - 9081091 - 9691097 - 10399104 - 109109110 - 117108118 - 123118124 - 131117133 - 137127138 - 139126Here is an example of calculating the confidence bands. Three pupils, Agata, Nathan and Preeti,have age standardised scores of 101,106 and 131 respectively. For Agata, with an age standardisedscore of 101 in this test, the 90 per cent confidence band is minus 9 and plus 9. Therefore, you canbe 90 per cent certain that Agata’s true score is between 92 and 110.Both Nathan, who has an age standardised score of 106, and Agata are working at about theaverage for their age. There is no statistical difference between their scores: Nathan’s true score isbetween 96 and 115.However, Preeti, with an age standardised score of 131, has a 90 per cent likelihood of having a truescore between 120 and 138, and has scored higher, in statistical terms, than Agata or Nathan.For high and low scores, the confidence bands are asymmetrical (they tend to be pulled towards theaverage test score).7
nfer tests – grammar and punctuation – year 3 NFERAge standardised score tableAge in years and (completed) months8Raw .11Raw *30
NFERnfer tests – grammar and punctuation – year 3Age in years and (completed) monthsRaw .11Raw *******************************309
nfer tests – grammar and punctuation – year 3 NFERblank page10
NFERnfer tests – grammar and punctuation – year 3blank page11
National Foundation for Educational Research 2018Pg and p teacher guide year 3 supplement summer
If the year 3 grammar and punctuation test is undertaken and marked in line with the guidance in this booklet, then both a standardised score and an age standardised score can be derived from a pupil’s test score. Standardised scores enable a comparis