Transcription
About GAINThe Global Alliance for Improved Nutrition (GAIN) is a Swiss-based foundation launched at the UN in 2002 totackle the human suffering caused by malnutrition. GAIN is driven by a vision of a world without malnutrition, inwhich all people, especially the most vulnerable, have access to and consume nutritious and safe food. Workingwith governments, businesses, and civil society, we aim to transform food systems so that they deliver morenutritious food for all people, especially the most vulnerable.About SBNSince 2010, the SUN Movement has inspired a new way of working collaboratively to end malnutrition, in all itsforms. With the governments of 63 SUN Countries in the lead, it unites people – from civil society, the UnitedNations, donors, businesses, and researchers – in a collective effort to improve nutrition. Established in 2012, theSUN Business Network (SBN) is the private sector branch of the SUN Movement and aims to support businesses ingrowing the role they play in improving nutrition and to support SUN countries in developing national businessengagement strategies. SBN is co-convened by the Global Alliance for Improved Nutrition (GAIN) and the UnitedNations World Food Programme (WFP).Recommended CitationGlobal Alliance for Improved Nutrition, Scaling up Nutrition Business Network. Enabling Business to AdvanceNutrition Index (EBANI). 2021. Geneva, Switzerland: GAIN and SBN; 2021. The Global Alliance for Improved Nutrition (GAIN) The Scaling Up Nutrition Business Network (SBN)This work is available under the Creative Commons Attribution-Non-Commercial-Share Alike 4.0 IGO licence (CCBY-NC-SA 4.0 IGO; ). Under the terms of this licence, youmay copy, redistribute and adapt the work for non-commercial purposes, provided the work is appropriatelycited, as indicated below. In any use of this work, there should be no suggestion that GAIN endorses any specificorganisation, products or services. The use of the GAIN logo is not permitted. If you adapt the work, then youmust license your work under the same or equivalent Creative Commons license. The contribution of third partiesdo not necessarily represent the view or opinion of GAIN.
AcknowledgementsThis work was commissioned by GAIN as part of the Making Markets Work to Improve the Consumption of Safeand Nutritious Foods programme, which is generously supported by Bill & Melinda Gates Foundation, FederalMinistry for Economic Cooperation and Development (Germany), International Development Research Centre(Canada), Irish Aid, Ministry of Foreign Affairs of the Netherlands and the Swiss Agency for Development andCooperation. All photographs included in this document have been taken with consent for use in publications.EBANIThe Enabling Business to Advance Nutrition Index (EBANI) is a tool developed by GAIN and SBN that providesinsights into the nutrition and food policy landscapes in 30 countries.Global Alliance for Improved NutritionRue de Varembè 71202 Geneva, SwitzerlandPhone: 41 22 749 18 50info@gainhealth.orgwww.gainhealth.org
CONTENTS1. Background52. What is EBANI for?62.1. What indicators comprise EBANI?72.2. EBANI methodology and scoring overview102.3. EBANI national reports102.4. Why these EBANI indicators and scoring?112.5. How might EBANI country reports be used?133. EBANI 2021 global overview of findings143.1. Country scores143.2. Global trends by indicator164. Reflections and conclusion195. References206. Annex: National EBANI scorecards21
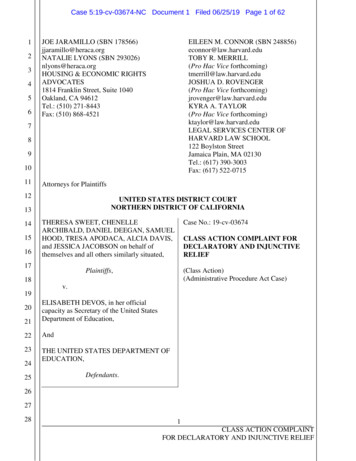
1 BACKGROUNDPoor diets and the food systems that support them are major drivers of malnutrition in all its forms, includingavoidable ill health in every country (Figure 1). But this also means that food and food systems are critical leversfor improving people’s nutrition and lives.Food systems have a key role to play in advancing universal goals like the United Nations Sustainable DevelopmentGoals (SDGs), particularly those around zero hunger and good health and wellbeing.Figure 1: Malnutrition takes many forms and is present in one in three people worldwideOne of the most important – if often overlooked – categories of actors or shapers in food systems, particularly inthe food systems of low- and middle-income countries, are small and medium-sized enterprises (SMEs). In lowincome country contexts in particular, SMEs provide the bulk of the food that people eat, especially people whoare resource-constrained. Unfortunately, not enough of the food that is available, affordable and desirable, fromSMEs and other sources, is nutritious, safe and contributing to sustainable food systems.Though SMEs are engaged in and contribute to nourishing people around the world, they face many barriers,including operating in environments that do not always encourage or reward good practices. In many cases, SMEsneed more support and appropriate incentives if they are to produce food that is nourishing and safe.Often, SME voices are unheard. The Enabling Business to Advance Nutrition Index (EBANI) helps aggregate thesevoices, articulating needs. It can catalyse action from many small businesses together. Though EBANI has beenconceptualised with SMEs as a focus, it also takes the wider private-sector into consideration, including largerenterprises in food systems.Overall, EBANI has been designed to help identify whether government policies that are expected to enable betternutrition are in place, or not – pointing to areas in need of attention.
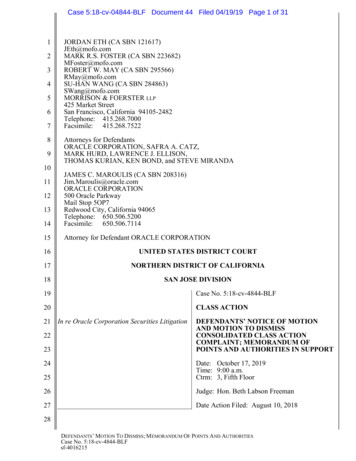
2 WHAT IS EBANI FOR?EBANI is a tool to stimulate dialogue between government, business, and other actors to improve the enablingenvironment for nutrition.EBANI provides a starting point for conversations among stakeholders, identifying gaps between what is stated,and what results from existing policies. It is important to emphasise that EBANI is a heuristic tool to support startingpolicy discussions – rather than a scientifically comparative assessment for ranking and comparing diverse nationalpolicy environments.EBANI can help stakeholders to identify priority areas in the enabling environment around which they cancollaborate to encourage governments to make and implement policies that are more conducive to food systemsthat deliver for the nutritional wellbeing of national populations. EBANI is not designed to produce a set of final ordefinitive recommendations – it is a starting point.This first round of EBANI has been developed by the Global Alliance for Improved Nutrition (GAIN) and the ScalingUp Nutrition (SUN) Business Network (SBN)1, to provide insights into the nutrition and food policy landscapes inselected countries where SBNs are present or emerging (Figure 2 shows the 30 countries covered by EBANI atpresent). EBANI reports for each of these countries can be accessed on the SBN and the GAIN websites.Figure 2: Countries in EBANIEBANI measures the policy andlegislative enablers for increasingprivate sector investment in safe,nutritious diets across the 30countries. It has been envisaged asboth a global and a nationaladvocacy tool that can help to startconversations and spark ideasaround key recommendations tomake policy and legislativeenvironments more enabling forbusinesses, SMEs in particular, tocontribute to advancing positivenutrition outcomes.1ThirdWay Africa provided consultancy services in the development of this round of EBANI.
EBANI occupies a space betweenindices and reports that focusprimarily on nutrition (for instance, theGlobal Nutrition Report, GlobalAccess to Nutrition Index, Hunger andNutrition Commitment Index) andthose that focus primarily on theprivate sector (especially DoingBusiness Index, Enabling Business ofAgriculture Index World EconomicFreedom Index).Given this positioning, EBANI can beused as a starting point in theconversation with stakeholders, identifying gaps between what is stated, and what results from existing policies.Each national EBANI report includesgood practice examples related tospecific nutrition and business policyinitiatives.2.1 What indicators compriseEBANI?EBANI is a collection of 22 indicatorscovering seven groups, each aimed atclassifying the country-based policiesthat promote key aspects of anenabling business environment fornutrition. Table 1 summaries the indicators and groups, and provides a brief rationale for the inclusion of eachindicator.2.1.1A: Promoting National Planning and ProcurementThe first group, Promoting National Planning and Procurement, includes the following indicators:1.2.3.Specified role for private sector in National Nutrition Plan (NNP, or equivalent if no NNP),National non-communicable disease (NCD) policy with a focus on nutrition that has a specified role forprivate sector, andPublic food procurement policies (social protection, hospitals) go beyond staple foods.The rationale for including 1 is to highlight whether the government is actively thinking about how the privatesector contributes and supports the advancement of nutrition. The rationale behind 2 is to determine if thegovernment is actively thinking about how private-sector activities relate to NCDs. Indicator 3 is included to showthat whether the government is being proactive in sending signals to the private sector aboutpromoting/adapting food baskets to ensure dietary diversity.2.1.2B: Promoting Fortification and ReformulationThe second cluster, Promoting Fortification and Reformulation, includes the following indicators:4.5.6.Mandatory food fortification policies for more than one staple food,Reformulation policies to encourage a reduction of salt or sugar in processed foods, andReformulation policy to encourage removal of trans fats in processed foodsThe rationale for including 4, 5, and 6 is to show whether the government is being proactive about sendingsignals to the private sector about the importance of nutritious foods – those that are fortified, those that contain
lower levels of ingredients deemed unhealthy in large quantities like salt and sugar, and those that contain fewertrans fats (which are associated with heart disease).2.1.3C: Promoting Food Safety and Food LabellingThe third cluster, Promoting Food Safety and Food Labelling, includes the following indicators:7.8.9.10.Food safety certificates are required for sale of food in the formal sector,Food safety certificates are required for sale of food in the informal sector,Policies to regulate mycotoxins in food exist, andRegulations that all pre-packaged food products must list nutritional value of ingredients existThe rationale for including 7, 8, and 9 is to indicate whether the government is being proactive about sending theprivate sector signals about the safety of foods. The rationale for including 10 is to show government againbeing proactive about sending the private sector signals about the importance of nutritious foods.2.1.4D: Promoting Special Provisions for ChildrenThe fourth cluster, Promoting Special Provisions for Children, includes the following indicators:11. National laws substantially aligned with the International Code of Marketing of Breast-milk Substitutes(BMS)2,12. School meals provision is explicitly guided by food-based dietary guidelines, and13. Some regulation of marketing of junk food to children existsThe rationale for including 11 is to indicate whether the government is being proactive about sending the privatesector signals about the promoting exclusive breastfeeding for the first 6 months of a child’s life and otherprovisions in CODEX3. Indicator 12 shows again if the government is being proactive about sending the privatesector signals about the importance of nutritious foods, particularly for school children. Indicator 13 shows ifgovernment is being proactive about sending the private sector signals about the importance of protectingchildren from unhealthy food handle/10665/40382/9241541601.pdf;jsessionid B5A533AE9ECEA4E962AC4B6E883089C6?sequence 13 http://www.fao.org/fao-who-codexalimentarius/en/
2.1.5E: Promoting Technical and Financial SupportThe fifth cluster, Promoting Technical and Financial Support (including provisions for women and agriculturalbusinesses), includes the following indicators:14.15.16.17.Support to SMEs to comply with any food regulations,Dedicated access to finance for SMEs (Ease of Doing Business ‘Getting Credit’ score above 50),Policies to support women in food businesses, andEnabling climate for agricultural businesses (Enabling the Business of Agriculture index score above 50)The rationale for including 14 is to show the government is serious about SMEs as a source of nutritious food –given that most regulations relate to food safety or nutrition. Indicator 15 is included to show whether thegovernment is proactive in supporting SMEs as a major source of nutritious food. The rationale for including 16 isto determine whether government is being proactive about supporting female food entrepreneurs, who facemore barriers than their male counterparts in similar businesses. Indicator 17 shows whether government issupportive of agriculture in general, which is necessary but not sufficient for promoting access to nutritious foods.2.1.6F: Promoting Subsidies, Taxes and Duties for Improved NutritionThe sixth cluster, Promoting Subsidies, Taxes and Duties for Improved Nutrition, includes the following indicators:18. Subsidies or lower or no taxes on production or sale of nutritious foods,19. Taxes on sugar-sweetened beverages, and20. Lower or no import duties on nutritious foodsThe rationale for including 18 and 19 is to show whether the government is willing to adjust fiscal policy toincentivise nutritious foods. Indicator 20 shows whether the government is willing to adjust trade policy toincentivise nutritious foods.2.1.7G: Promoting Zoning and Planning Policies to Reduce Food Loss and Improve NutritionThe seventh and final cluster, Promoting Zoning and Planning Policies to Reduce Food Loss and Improve Nutrition,includes the remaining two indicators:21. Zoning or planning laws regulating location of fast-food outlets exist, and22. Policies to reduce food loss existThe rationale for including 21 is to determine whether the government is willing to adjust zoning policy todisincentivise unhealthy foods. Indicator 22 suggests whether the government is proactive about ways to promotereduction in loss.
2.2 EBANI methodology and scoring overviewAll EBANI indicators are scored very simply as either zero or 1. While a more complex scoring mechanism woulddeliver more nuanced information about the policies covered, EBANI was deliberately designed to be simple forease of initial user engagement. Most EBANI indicators thus capture whether policies exist or not somewhere inthe country, with a score of 1 being positive and of 0 being negative4. Where appropriate, existing policieswere also examined in terms of how comprehensive they were in providing coverage or support for eachindicator, with this information shared in the text of individual national reports. A score of 0 was also applied if apolicy or strategy was out of date.Most of the policies examined were sourced via the Nutrition Landscape Information System (NLiS) of the WorldHealth Organisation. Sources used by NLiS include the Global database on the Implementation of NutritionAction (GINA), GAIN’s Access to Nutrition Index, SUN country strategies, and the Global Nutrition Report (GNR).In the event of missing data from the NLiS, further desk research was conducted to provide access and insight intokey policies.A few of the indicators are scored using existing databases, indices, or analyses. This is the case for Indicators 15and 17 which draw on the World Bank’s Ease of Doing Business and Enabling the Business of Agriculture reports,as well as Indicator 11, which draws on an analysis of how aligned nations are with the International Code ofMarketing of Breast-milk Substitutes (BMS).A detailed report on methodology captures EBANI national reports available (see section 2.3.) includes adetailed methodology section.2.3 EBANI national reportsThe EBANI national reports available for the 30 countries indicated in Figure 2 each cover three main sections:i.ii.iii.4The EBANI Overview section: This sets out the 22 EBANI indicators with a simple explanation behindtheir inclusion in this index, and what they mean in terms of enabling businesses to advance nutrition. Asummary of the methodology is also provided.The EBANI National Scorecard: This includes a one-page overview of the country’s existing policies,measures, and scores relating to the 22 EBANI indicators, with sub-scores under each of the 7categories. It also includes a detailed table with more information under each of the 22 indicators, all ofwhich are scored as either 1 or 0. A full methodology is available to highlight the specific languagewithin policies that drives the EBANI score.Thirdly, conclusions and implications for policy and advocacy are presented, on the basis of theoverall EBANI score, and guidance on how to use the content of EBANI for the setting of in-countrypriorities and convening dialogues for advocacy initiatives, alongside high-level observations andrecommendations.A score of 1 reflects adequate, fully or partially, implemented policies, or achieving a certain threshold on existing indices.
EBANI national reports also include a description of global and regional good practice, with examples linked toeach of the 22 indicator groups drawn from good global practice. These examples may provide inspiration toadvocates and policymakers, showing how places have already tackled some of the areas EBANI highlights, andpointing to cases from which lessons might be drawn. Table 2 catalogues four examples.Table 2: Global good practice examplesTaxes on Sugar-SweetenedBeverages (SSBs)Ethiopia’s Sales Tax and Excise Taxes 2019 establishes a sales tax of 5%for food products with exceptions. As sugar is considered a luxury item, ithas an excise tax of 33% (according to Reuters, this may be lowered to20% following privatization of industry), and soft drinks have an excisetax of 30%.Zoning and planning laws forHealthy and Non-healthy foodsSouth Korea’s ‘Green Food Zones’ around schools (200 metre radius)prohibit the sales of ‘unhealthy’ foods.National NCD policy with afocus on nutrition that has aspecified role for privatesectorMexico The National Strategy for Prevention and Control of Overweight,Obesity and Diabetes outlines quality seal and advertising standards forchildren under 12, placing explicit responsibility on private sectorstakeholders.Food Safety certificatesrequired for sale of food –informal sectorIndia: The Food Safety and Standards Authority of India (FSSAI) pilotedthe Clean Street Food Hub Initiative (CSFHI), seeking to promote foodsafety and hygiene at popular street food locations across IndiaSources: Sales Tax and Excise Taxes, 2019 (Ethiopia); INFORMAS, 2019; Pan American Health Organisation,2011; Nemer et al., 20202.4 Why these EBANI indicators and scoring?In creating EBANI, efforts have been made to balance different objectives, including: a) providing a relativelysimple, ‘big picture’ overview of the policy landscape in a given country to identify broad entry-points for advocacyand action; and b) being able to represent national and subnational situations with enough detail to accuratelyreflect the landscapes in question.EBANI is a non-exhaustive collection of the type of actions a country could take to improve the enabling environmentfor nutrition – and can point to areas that are worth the consideration of policymakers, with precedents in regionaland global contexts. Some of the indicators will capture very familiar actions in many places – for instance indicator7 (Food safety certificates required for sale in the formal sector), while others will be areas that not enoughpolicymakers have tackled, such as indicator 8 (Food safety certificates required for sale of food in the informalsector).Policy landscapes are often complex – characterised by measures that are qualitative rather than highlyquantitative. There are also different ways policies with the same aim might be designed, implemented, andenforced. Just because a policy exists, that doesn’t mean it is necessarily implemented or effective. Moreover,policies may have (often unseen, good or bad) implications or effects beyond those for which they were designed.It is not the intention of EBANI to assess policy implementation, quality, coverage, gaps, and so forth in a systematicway across diverse national systems. The depth of analysis required would be an exercise beyond the scope ofthis heuristic tool. For EBANI users it is worth emphasising that it remains a starting point for conversations arounddifferent policy action areas. See Box 1 for two examples.Box 1: Interpreting and having conversations around EBANI scores
A country may score ‘1’ on indicator 4 around the existence of mandatory food fortification for greaterthan one staple food. Despite such a score, conversations around for instance coverage, additional relevantfortifiable staple foods, or monitoring and enforcement may still be relevant and necessary.A country may score ‘1’ on indicator 7 around food safety certificates being required for sale of food inthe formal sector, but it may score ‘0’ on indicator 8 around food safety certificates being required forsale of food in the informal sector. This type of result emphasises the need for a key area of work whereSBN is engaged, for example in Bangladesh, working on food safety compliance, especially for SMEs.A country may score ‘0’ on an indicator, not because it has not created policies in that area, but becausepolicies have become outdated. This may be a good opportunity to raise a discussion around how torefocus attention to these areas.
2.5 How might EBANI country reports be used?At the national level, EBANI is a starting point, providing a birds-eye view of how policies are supporting orhindering healthy diets. It is a helpful if blunt tool, serving as a guide to where current priorities lie, and exposingsome scope for a new direction to support and incentivise the private sector to make healthy diets a priority.EBANI, as a heuristic tool, doesn’t delve in every case into subnational policy – limitations of the scope of thepolicy scanning that was possible through the desk-based, remote methodology, mean that inevitably some thingswill be missed, but EBANI may still be used as a starting point to identify priorities around which stakeholders canhave discussions at the national level to identify areas to work on.The EBANI country reports are thus primarily envisaged as a conversation-starter for discussions around theenabling environment for better nutrition. They are a way to begin more focussed assessments on the currentsituation across different indicators or indictor clusters. Following such discussions, they could potentially also beused to help multistakeholder groups interested in better nutrition to define three to five priority areas for action,advocacy, or strategizing.
3 EBANI 2021 GLOBAL OVERVIEW OF FINDINGS3.1 Country scoresEBANI overall scores for the 30 countries for which they were undertaken, clustered by region, appear in Table3. The highest score, from a possible score of 22, was 15, while the lowest score was 3.Table 3: EBANI overall scores for 30 countriesNote: For the purposes of simplification, the Democratic Republic of Congo (DRC) as the only country in Central Africa has beenclustered with West Africa, while Yemen, the only country from West Asia has been clustered with South Asia to allow for theinclusion of these two cases in these regional comparisons.One-page scorecards that breakdown these scores by indicator for each country are available in the Annex.These scores point to significant room for improvement, even among countries at the top of the distribution.How are scores distributed? Figure 3 shows that most countries scored in the low or moderate ranges, with fewercountries scoring in the very low, high, and very high ranges. Indeed, no country scored higher than 15. While 19of the 30 countries scored less than half, 11 of the 30 countries scored greater than or equal to half.
Figure 3: Distribution of EBANI scores by country (number of countries scoring)
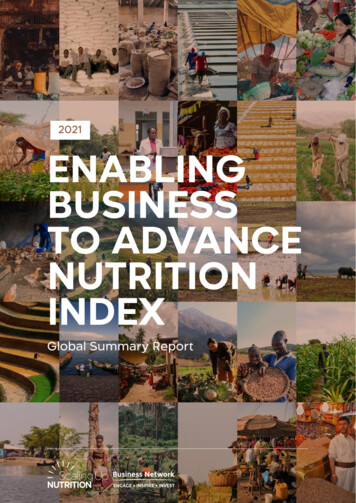
3.2 Global trends by indicatorLooking across EBANI’s 22 indicators, which ones scored 1 in many countries, and which ones were less likely toscore? Figure 4 shows how many countries (out of 30) score 1 on each of the 22 indicators – clustered by region.Eight indicators achieve a score of 1 in at least half of the countries, with the highest-scoring indicator beingnumber 7 (Food safety certificates required for sale of food in the formal sector). This achieved a score of 1 in 28of the 30 countries. No indicator scored a zero across the board, however in the case of indicator 21 (Zoning orplanning laws regulating locations of fast food outlets), only one of the thirty countries (Kenya) scored a 1.The regional distribution illustrated by the different coloured segments of the bars in Figure 4 also indicateswhere regional gaps have appeared – in each case where indicators are generally scoring 1 in fewer countriesto begin with. In the cases of 15 of the 22 indicators, at least one country in each of the five broad regionalgroups (as set out in Table 3) scored a 1.Figure 4: Scores by indicator – and regional pattern (number of countries scoring 1)
Figure 5 provides a closer look at selected indicators in selected clusters. It is evident that even within each of theseven clusters of indicators, considerable variation appears in terms of the number of countries scoring 1.Figure 5: A closer look at selected indicators in selected clusters
4 REFLECTIONS AND CONCLUSIONFood systems are vast and complex and can be difficult to navigate. For years, policy-makers have had to replyon limited data and often siloed decision-making. Decisions about nutrition have often been made by those in thehealth sector, without wider consideration of the agricultural, social and environmental context. Policy tools suchas the NOURISHING framework, INFORMAS, and GINA have all contributed to better understanding of thepolicy levers available to decision-makers and can serve as inspiration with specific country case studies. Therecently published Food Systems Dashboard aims to go one further by bringing together extant data from publicand private sources to help decision makers understand their food systems, identify their levers of change anddecide which ones need to be pulled. However, there remains a gap to incorporate how businesses can beincentivised to prioritise nutrition at the policy-level and our hope is that EBANI helps narrow the gap supportingdecision-makers to make better decisions for nutrition.EBANI provides a glimpse of the policy landscape for better nutrition through business, at national level, as wellas showing regional and global comparisons. As such, EBANI has been designed as a resource for a range ofstakeholders, including SUN Business Network members, government officials, NGOs and other civil society.Government officials and decision makers can use it to assess some of the gaps in their national strategies andtake inspiration from the examples of good practice globally. EBANI can also be a starting point for civil societyand other stakeholders to come together and assess the state of play and use the index in a policy prioritisationprocess to call for change in the food system, aligning EBANI scores for countries with government priorities andresource allocation. This first EBANI survey could be expanded in the future to determine where policies havechanged across the 30 countries, or to add more countries to the analysis, or more indicators.At a global level, EBANI confirms the general understanding that much work remains to be done to incentivisebusinesses to provide healthy diets. Most countries score 0 on several indicators. Even where scores of 1 areassigned, work remains to be done to assess whether policies are being implemented comprehensively or whetherthey are yielding the desired outcomes and impacts.While gaps in policy may appear stark, particularly for some indicators, EBANI also demonstrates that there arecountries taking action across each of the areas highlighted. Where there is appetite and political will, significantchanges can be made to help transform food systems into those that better support businesses to deliver onmaking healthy diets a reality for more people.
5 REFERENCESThis report draws from the EBANI Country Reports, available on the SUN Business Network and the GAINwebsites.INFORMAS, Deakin University, The Australian Prevention Partnership Centre (2019). Policies for tackling obesityand creating healthier food environments - Australian Progress Update. Online Report, available from:https://www.foodpolicyindex.org.auPan American Health Organization (2011). Recommendations from a Pan American Health Organization ExpertConsultation on the Marketing of Food and Non-Alcoholic Beverages to Children in the Americas. Reportavailable rts-Food-Marketing-to-Children-(ENG).pdfNemer, LE, Gorla I, Demmler KM, and Polak S. India's Clean Street Food Hubs: Working with vendors to improvefood safety and strengthen urban food systems. Global Alliance for Improved Nutrition (GAIN). Working Paper#3. Geneva, Switzerland, 2020. DOI: https://doi.org/10.36072/wp.3
6 ANNEX: NATIONAL EBANI SCORECARDS6.1 Afghanistan6.2 Bangladesh
6.3 Burundi6.4 Cambodia
6.5 DRC6.6 Ethiopia
6.7 Gambia6.8 Guinea
6.9 Indonesia6.10 Ivory Coast
6.11 Kenya6.12 Lao PDR
6.13 Lesotho6.14 Madagascar
6.15 Malawi6.16 Mali
6.17 Mozambique6.18 Myanmar
6.19 Nepal6.20 Niger
6.21 Nigeria6.22 Pakistan pag
Often, SME voices are unheard. The Enabling Business to Advance Nutrition Index (EBANI) helps aggregate these voices, articulating needs. It can catalyse action from many small businesses together. Though EBANI has been conceptualised with SMEs as a focus, it also takes the wider private-sector into consideration, including larger