Transcription
DAILY MARKET BRIEFING:Mortgage Trends & Rate Activity
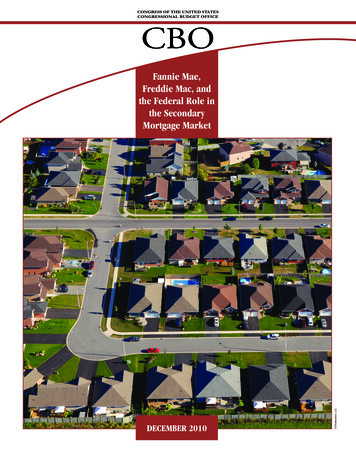
Daily Market Briefing: Mortgage Trends & Rate ActivityMARKET RATE INDICES4.0%3.8%3.6%All products saw little to no3.4%change yesterday.3.2%3.0%2.8%Market Index2Current Rate30-YR Conforming3.34%30-YR Jumbo3.55%30-YR FHA3.34%30-YR VA3.01%1-Day DeltaSource: Optimal Blue Mortgage Market Indices (OBMMI) – optimalblue.com/obmmi7-Day Delta4-Week Delta
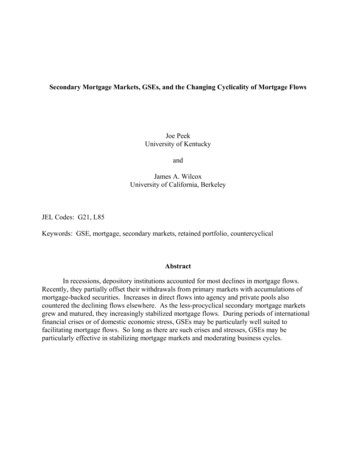
Daily Market Briefing: Mortgage Trends & Rate Activity30-YR CONFORMING TO 10-YR TREASURY RATE SPREAD4.0%3.5%3.0%2.5%The 30-year conforming to 10year treasury spread widened2.0%by just 2 bps on Tuesday.1.5%1.0%0.5%0.0%Market Index3Current Value10-YR Treasury0.62%30-YR Conforming3.34%10-YR to 30-YR Spread2.72%1-Day DeltaSource: Optimal Blue Mortgage Market Indices (OBMMI) – optimalblue.com/obmmiU.S. Department of the Treasury – treasury.gov7-Day Delta4-Week Delta
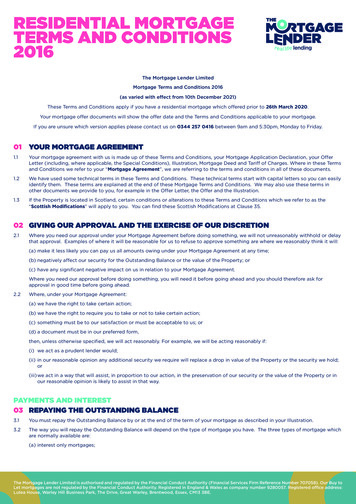
Daily Market Briefing: Mortgage Trends & Rate ActivityRATE LOCK VOLUME BY LOAN PURPOSE3503.7%OBMMI 30-YR Conf.3003.6%2503.5%2003.4%Rate lock volumes grew about7% from Monday to Tuesday.1503.3%1003.2%503.1%03.0%Market Volume IndexCurrent Value1-Day % Change(Total Volume indexed to 100 on 1/2/2020)Purchase70Cash-out Refinance33Rate-Term Refinance99TotalRefinance Share*20365.4%*Refinance Share changes reflect inter-period delta4The refi share increased to 65%.Source: Optimal Blue Mortgage Market Indices (OBMMI) – optimalblue.com/obmmiOptimal Blue Market Analytics – optimalblue.com/market-analytics7-Day % Change4-Week % Change
Daily Market Briefing: Mortgage Trends & Rate ActivityMIX OF BUSINESS BY LOAN PRODUCT100%90%80%70%60%Conforming loans gained50%modest share on Tuesday, while40%the other products fell slightly.30%20%10%0%Loan Product MixCurrent 8%USDA51-Day Delta1.0%Source: Optimal Blue Market Analytics – optimalblue.com/market-analytics7-Day Delta4-Week Delta
Daily Market Briefing: Mortgage Trends & Rate ActivityPURCHASE AND REFINANCE PULL-THROUGH RATES85.0%80.0%75.0%Pull-through rates were up70.0%slightly on Tuesday and arenearing 80%.65.0%60.0%55.0%Pull-through RateCurrent Rate1-Day Delta(5-Day Moving Average)6Purchase Pull-through78.1%Refi Pull-through78.9%Source: Optimal Blue Hedge Analytics – optimalblue.com/hedge-analytics7-Day Delta4-Week Delta
Daily Market Briefing: Mortgage Trends & Rate ActivityBEST EFFORTS TO MANDATORY DELIVERY SPREADS180 bps160 bps140 bps120 bps100 bpsBest efforts to mandatoryspreads were flat on Tuesday.80 bps60 bps40 bps20 bpsbpsBest Efforts vs. MandatoryCurrent Spread1-Day Delta(5-Day Moving Average)730-YR Conforming93 bps15-YR Conforming94 bps30-YR Government163 bpsSource: Optimal Blue Hedge Analytics – optimalblue.com/hedge-analytics7-Day Delta4-Week Delta
Daily Market Briefing: Mortgage Trends & Rate ActivityWHOLE LOAN DELIVERY TO 30-YR TBA SPREADSBest Ex prices gained 12 bps vs. UMBS 3.0 and100 bpsgained 84 bps vs. GNMA 3.0 on Tuesday. TheGNMA spreads have been whipsawing a bit duebpsto large groups of loans being sold atdiscounted pricing, but the trend continues to(100 bps)improve. Cash Window spread vs. the UMBS 3.0narrowed 8 bps.(200 bps)Investor pricing seems to be steadily(300 bps)improving, which is an excellent sign that thesecondary market is improving. In terms ofprice, it seems far safer to hedge loans now(400 bps)compared to a few weeks ago, but the prospectof investors releasing new overlays is still(500 bps)something to keep in mind. This week, watchfor changes to guidelines, adjustments, and/or(600 bps)fees associated with C/O loans.(700 bps)Whole Loan vs. 30-YR TBACurrent Spread(All Spreads indexed to 0 on 2/3/2020)8Best Ex vs. UMBS 3.0(340 bps)Best Ex vs. GNMA 3.0(463 bps)Cash Window vs. UMBS 3.0(205 bps)Source: Optimal Blue Hedge Analytics – optimalblue.com/hedge-analytics1-Day Delta7-Day Delta4-Week Delta
Daily Market Briefing: Mortgage Trends & Rate ActivityOPTIMAL BLUE DATA SOLUTIONSENTERPRISE ANALYTICSCOMPETITIVE ANALYTICSMARKET ANALYTICSOPTIMAL BLUE MORTGAGE MARKET INDICES (OBMMI)9Optimal Blue, LLC optimalblue.com
Daily Market Briefing: Mortgage Trends & Rate ActivityLEGAL DISCLAIMERDISCLAIMERCONTENT USE PERMISSIONUTILIZING OUR CONTENTTRADEMARKSCOPYRIGHTREVISIONS10 Optimal Blue and/or certain of its affiliates.All rights reserved.
Cash-out Refinance 33 Rate-Term Refinance 99 Total 203 Refinance Share* 65.4% 4 (Total Volume indexed to 100 on 1/2/2020) OBMMI 30-YR Conf. Daily Market Briefing: Mortgage Trends & Rate Activity *Refinance Share changes reflect inter-period delta Rate lock volumes grew about 7% from Monday to Tuesday. The refi share increased to 65%.