Transcription
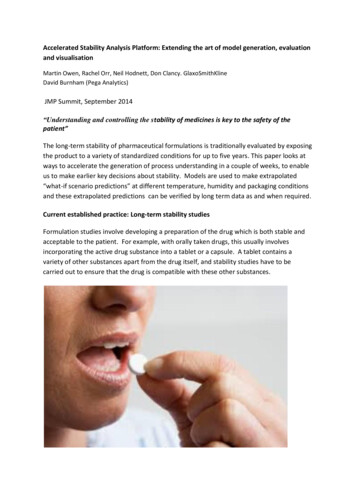
Accelerated Stability Analysis Platform: Extending the art of model generation, evaluationand visualisationMartin Owen, Rachel Orr, Neil Hodnett, Don Clancy. GlaxoSmithKlineDavid Burnham (Pega Analytics)JMP Summit, September 2014“Understanding and controlling the stability of medicines is key to the safety of thepatient”The long-term stability of pharmaceutical formulations is traditionally evaluated by exposingthe product to a variety of standardized conditions for up to five years. This paper looks atways to accelerate the generation of process understanding in a couple of weeks, to enableus to make earlier key decisions about stability. Models are used to make extrapolated“what-if scenario predictions” at different temperature, humidity and packaging conditionsand these extrapolated predictions can be verified by long term data as and when required.Current established practice: Long-term stability studiesFormulation studies involve developing a preparation of the drug which is both stable andacceptable to the patient. For example, with orally taken drugs, this usually involvesincorporating the active drug substance into a tablet or a capsule. A tablet contains avariety of other substances apart from the drug itself, and stability studies have to becarried out to ensure that the drug is compatible with these other substances.
We need to provide evidence on how the quality of the drug substance or product varieswith time under the influence of a variety of factors such as temperature, humidity andlight.These studies enable the link between storage conditions and shelf-lives to be established.The extended storage conditions are designed to represent different climates across theworld.TemperateSub-tropicalHot and dryHot and wetTo control the impact of humidity, medicines are commonly packaged in a bottle or blisterpack, and sometimes with desiccant. Over time moisture permeates the packaging whichcan cause instability in the active drug substance resulting in increased impurity levels anddecreased efficacy. The container systems can be made from a variety of materialsincluding glass, plastic, and metallic foil.The need for accelerated Stability studiesIn practice we need early evidence of stability when developing drugs rather than having towait for years before the long term study reads out.For example if the drug proves unstable, it will invalidate the results from clinical trials sinceit would be impossible to know what the administered dose actually was.
Accelerated stability studies enable us obtain an earlier read out, by exposing a drugproduct to more extreme storage conditions (temperature and humidity) for short periods,typically 14 days, simulating what would happen over longer periods of shelf lifeThis early detection of potential instability (weeks instead of years) allows us to take actionto mitigate or control riskWe can make early science and risk-based data-derived decisions on route selections,formulation choices, assess changes to starting material manufacturers and trouble shootstability issues. We do this by using extrapolated models to predict the shelf life of drugsubstances, drug products, intermediates and starting materials.We can assess options for mitigating risk e.g. by modeling different packaging and desiccantchoices to control stability. We can also reduce packaging and carbon footprint costs byminimising packaging where appropriate.
Regulatory impact of the Accelerated Stability Assessment Protocol (ASAP)The accelerated study concept has had significant exposure to regulatory agencies acrossthe globe. The concept is considered to be an improvement on current working practices forassigning retest periods. At this stage we do not suggest ASAP studies are a replacement forlong term studies, rather that they provide an early indicator as to the likely risk of druginstability, allowing a way of evaluating control strategy options and prioritising the mostappropriate long term stability studies to perform.We do have examples where extrapolated accelerated study predictions are in very closeagreement with long term models.
The Accelerated Stability (ASAP) workflowDesign Set-up Define the Problem:Design experimental protocolPerform the experimentsGather and collate the dataModel Fit kinetic modelsDevelop a long term humidity modelExtrapolate kinetic modelsTake action Communicate impactMake data-derived decisionsReview Verify the models with long term dataReview updated modelsOrganisationallearning Build a portfolio of examplesReview portfolioAdapt and improveWho is involved?At GSK there are three types of users involved the ASAP process. The expert modellers support an ASAP lead user groupThe ASAP user group provide the stability study service for project teams and seniordecision makers in Development and Manufacture.The project teams and senior decision makers in Development and Manufacture areresponsible for ensuring drug product meets quality objectivesThe approximate size of the groups is as follows:Expert kineticModellersASAPLead UsersProject Teammembers andsenior managers
The key to increasing the uptake of ASAP is recognising that complex mathematics underpinthe ASAP workflow. We need to combine kinetic models and humidity models to create acombined model with which we can make predictions. We then need a dashboard orinterface that is easy to use by non –expertsStability protocol: practical experimentationBefore we focus on the dashboard, we will first take a look how we actually perform thestudy in the laboratory as this helps to explain the protocol and how and when the data iscollectedThe temperature is controlled by using ovens set at different temperaturesThe humidity is controlled using salts.The humidity is controlled using salts
Samples are stored in chambers. Typically we use up to six chambersEach chamber contains a data logger to record the actual temperature and relative humidityevery twenty minutes.During different time intervals samples are withdrawn and analysed by HPLC for impuritycontent. Different impurities have different retention times and the amounts of eachimpurity can be determined by the area of each peak.
The ASAP Dashboard ApplicationThe application handles the associated data-handling workflows, the complexity of themodeling and delivers a capability for engaging multi-disciplinary problems solvers. Allinformation is presented visually and interactively in a dashboard format. This enablesdecision-makers, who may not themselves build the models, to access advanced analyticaland statistical methods, explore what-if scenarios in real-time and evaluate that the qualityof the model is fit for purpose.Expert modeller requirements Automated model building to remove the burden of repetitive key strokes and freeup experts to work on challenging problemsThe ability to override automated models and insert manually produced modelsClear and transparent line of sight between data and model production so that ifrequired, data can be checked and modeling assumptions can be testedThe flexibility to refine and extend the modeling capability, visualisation ofuncertainty, and packaging/desiccant optionsRapid access to previously constructed modelsAccess to the source code and look up tablesASAP Lead User Requirements Connectivity to data storage systems (currently excel)Easy to use interface and intuitive workflowStandardised procedures in design set-up and data collection to maximise efficiencyand enable automation of data transferCapability to explore data to visualise overall risk (overview) and assess importanceof specific impurities (zoom and filter)Access to the data extract table to (details on demand) to prioritise responses andexclude data that is inappropriate for modelingEasy model retrievalProject team members and senior managers Easy to assimilate informationEasy to interrogate “what if scenarios”Quick visualisation updates in “real time” enabling live use in project meetingsEasy to operate interface to enable communication of control strategy optionsUncluttered display with technical detail available on need to know basisHelps consensus building in scientific and risk-based data-derived decision makingRequirements for choice of software package to build a dashboardHistorically excel was used to manually produce ASAP models. Alternative data analyticpackages were evaluated and one with the following required capabilities was selected
Data handling capability (e.g. split and stack functionality)Interface with data storage solutionsFlexible and rapid data visualisationLinear and non-linear modelingDynamic, interactive model/visualisationCapability to enable knowledge capture, retention and retrievalScripting to provide workflow type platformOpen source codeData Analytics Workflow from the perspective of the modellerThe Data Analytics Workflow is as follows: Build Storage ModelBuild Kinetic Models for ImpuritiesEstimate Shelf Life for each impurityThe Storage ModelWe need to generate mechanistic model that models the moisture permeation. The modelneeds to account for these effects: Permeation of moisture into a storage bottleMoisture equilibrium between headspace, desiccant, and tabletDesiccant and Tablet moisture absorptionRate equations for formation of impurities in presence of waterTypical Equilibrium Moisture Content of TabletsA tablet “isotherm” is constructed relating the percent moisture to the Relative Humidity ofthe chamber using Gravimetric Vapour Sorption (GVS) data. The tablet isotherm model isused to calculate percent moisture content at a given relative humidity. A similar isotherm
is developed for the desiccant. The equilibrium relative humidity is calculated for eachmoisture content in the storage bottle by solving a mass balance relating 4 equations and 4unknowns (relative humidity, moisture in headspace, moisture in tablet, moisture indesiccant). The model calculates moisture permeation into the storage bottle over timecorresponding with the plastic’s permeability, bottle surface area, and bottle wall thickness.Build Storage ModelThe storage model locates an equilibrium condition for the environment based ontemperature, moisture and physical dimensions of the container. An iterative method isused to continually re-evaluate multiple equations that describe the physical environment,and in particular the moisture within the tablet and within the surrounding headspace.Iteration continues until an equilibrium condition is identified.This yields the day-zero steady state conditions.Taking account of water vapour pressure and the permeability of the barrier materials, theabove iterative procedure can be repeated for each day over a two year period to takecalculate the uptake of moisture into the tablet.If a desiccant is included, the moisture fraction for the desiccant is also calculated.
The dashboard is used to visualise this information and to investigate different packagingoptions:The kinetic modelBuild Kinetic Models for ImpuritiesFor each impurity a kinetic model is built based on the results of accelerated lifetimestudies. These studies use extreme levels of temperature and humidity.The generic form for these models is:Kinetic modelling termsN1Humidity sensitivity termThe Humidity term in the model could be relative humidity, or alternatively could beproportional to the vapor pressure of water: Relative humidity would indicate the kinetics are driven by liquid water, asmaterial moisture content is proportional to relative humidity. Absolute humidity: Vapor pressure of water would indicate the kinetics aredriven by moisture in the vapor phase.K1Arrhenius pre-exponential termK1 is the frequency factor and relates to the activation energy for the degradation processK2Activation energy; temperature sensitivity
K3Asymptote - For a decelerating model, the asymptote defines the maximumlevel of impurity that can be formed in the batch and may relate to the level of a precursorimpurity present in the batch.Estimates for the parameters are made using the JMP nonlinear platform.There is no a priori way to know whether the impurity levels are driven by relative humidity(RH) or absolute humidity (AH). So two sets of models are built:A set of heuristic rules are applied to the models to evaluate whether the parameterestimates are “scientifically reasonable”:At this point the models are being used primary to assess whether relative humidity (RH) orabsolute humidity (AH) is the driving mechanism. Once this has been established the goal isto find the simplest model consistent with the data. A model linear in time is constructed:
Further heuristics are applied to establish the suitability of the linear model. If the fit isacceptable a green traffic light is displayed. If not, an amber traffic light and a warningmessage are displayed.The decision to choose a particular model is based on: (a) whether the impurity formation islinear with time, (b) is speeding up, or (c) slowing down with respect to time.Impurity (% area)Impurity (% area)0.3500.3K30K30.40.45Decelerating Model1214102244668time8 (days) 10101212141410Accelerating Modelk0.4 0.350.45time (days)2468101200.050.1Impurity (% area)C00.05time (days)Linear Modelk0.20.3 0.25time (days)10C0.450.2 0.150.2514C0.150.2k0.250.30.350.40.4514Impurity (% area)0.10.1 0.050.40.10.1580.35C6k141200.1 0.054k0.30.150.212102k0.20.2 0.150.25800.30.3 0.250.25000.15time8 (days) 106C00.0514CK312K30.1time (days)641048time (days)262402000Presentatio 00n title inMonthfooter000014141212C10time (days)100.058entatio 00inMonthr000080.1time (days)060.20.156C40.10.05k20.15k0.30.25K30.40.4 0.350.3500.20.350.450.45Impurity (% area)kImpurity (% area)0.30.25K3Impurity (% area)0.350.4cImpurity (% area)0.4k0.4500.45Decelerating ntatio 00n title inMonthfooter0000Linear ModelModelAcceleratingear Model
We now have a functional form that describes the level of impurity at a given time point forspecified levels of temperature and humidity. It is important to realise that the humidity willbe a function of the environment (storage conditions) and the packaging materials.Combining the moisture flux results from the storage model with the kinetic model yields aset of data that describes the time-evolution of impurity level within the tablet:The dashboard is used to visualise the development of impurities over time:
Confidence intervals are computed for the models, and the cross-over with specificationlimits results in an estimate for shelf life:
The Dashboard conceptThis picture illustrates the main features of the ASAP Dashboard Application. The purpose ofa dashboard is to bring together, in close proximity, the information required in order tomake decisions.HowHowgoodis ourgoodis ourmodel?model?Automated data handlingPackagingThe ASAP“App”control strategyHow good is our model?optionsAutomated data handlingPackagingcontrolstrategy control optionsPackagingoptionsRisk evaluationsAutomatedUncertaintyAutomated data handlingmodel generationAutomatedUncertaintyAutomatedmodel generationmodel e controlRisk evaluationBatch to batch stability comparisonsRisk evaluationBatch to batch stabilitycomparisonsBatchto batch comparisonsDashboard Workflow from the perspective of the end-userDesign set-upAccelerated stability studies are designed in a way that effectively deconvolutes the effectof time and temperature. This feature helps identify a fit for purpose design withappropriate factor ranges and combinations.
The data from the HPLC systems and the data logger systems is combined into a simplestandardised format excel tableThis excel table is then imported into the data analytics package for a preliminary evaluationof the data. The overview gives an immediate sense of which where the greatest risk occurs.
The zoom and filter option allows us to perform a more rigorous inspection of the data,identify potential data outliers as a result of data entry/transcription errors or processingerrors.OverviewZoomFilterOnce we are happy with the data and we know which impurities are appropriate to model,we can start to build the models for specific batches and impuritiesThe dashboard interfaceAs you can imagine, generating and coupling these models can be very complex, which iswhy we have worked to develop a dashboard which automates the modelling “behind thescenes” to give a clean uncluttered interface for the decision makers The end-user canvary parameters, evaluate risk and determine potential controls.
Control panelParametric control(packaging and desiccants)Visualisation ofevaluation of riskOn the right hand side you can see an evaluation of risk. This shows the predicted shelf lifeor time to break specification for each attribute. This can help us determine where our risklies and what we need to control.The left hand side of the dashboard contains the parametric control. The graphs display theMVTR models and the drop down menus contain options for different packaging types.Additional customisations are available in the control panel. Here we can specify the exactdimensions of our packaging to make the model most appropriate for our application. Anychanges made on the control side of the dashboard are reflected in the degradation profileand risk analysis on the right.It is then possible to add the long-term stability data as it becomes available and overlay itto verify the model or supersede it if necessary.Adding valueCase study IIn this example one strength of a high strength product was already on the marketwith available long term stability data. An ASAP study was run. We can overlay thelong term data with the ASAP model (see A). The central blue line shown is theprediction with 2 sided 95% confidence intervals shown within the shaded area. Theblack spots are the long term data points and, as can be seen, they overlay well withthe prediction.An ASAP study was run with a lower strength product to assess its viability andpackaging changes that may be required to achieve a marketable shelf life.
The ASAP model of the lower strength product shows (B) the degradation rate ismuch higher and would not enable a marketable product. However, if we now selecta desiccant for inside our pack (C) we see the risk reduce as the predicted shelf lifeextends for the 0.94 impurity. Note that bar charts below the models also show thatthe desiccant does not impact on the 0.11 impurity in the same way. This impurity ismanaged by controlling the initial water content of the tablet by prolonged dryingtime. This gives some idea of how that the control strategy required to managedifferent impurities can be challenging and the utility of a modeling approach.(A) High strength product(no desiccant)(B) Low strength product(no desiccant)(C) Low strength product(with desiccant)Case study IIA project about to be commercialised identified a stability issue with an unknownroot cause. With a tight deadline for regulatory filing, the project team conducted anASAP study with varying drug substance and excipients batches.By utilising the "view all batches" option we can appreciate the impact of excipientsources. It materialised that it was the variation of excipient content in the batchesthat were causing the variations in the drug product degradation profile. It was alsodiscovered that the reaction producing the impurity was self limiting, with allbatches plateauing off before the specification. The control strategy in this caseenabled us to select specific batches with acceptable excipient content goingforwards in commercial manufacture.
What next?The ASAP Dashboard Application has been developed very rapidly by building, testing,incorporating feedback from the modeling team and lead users. The application hasprogressed from a static mock –up of the user interface (v0.1), through to a working versionwith minimal capability (v1.2), through to a more robust and fully functioning version (v1.6).Our intent is to continue to build in additional capability, such as non-linear modeling andlook at the requirements for scaling this out into an “industrialised” version for usethroughout the company. We will continue to build our portfolio of applications and refinethe process and protocols as our experience grows.v0.1Nov ’13v1.2Feb’14v1.6July ‘14v2.0Dec ‘14Key Learnings for Dashboard Application DevelopmentThe most important element in the success in building this capability has been tounderstand the business requirements and understand the different needs of the peopleinvolved in the ASAP process (modelling experts, ASAP lead Users, drug product projectteam member and senior decision-makers).The team members responsible for developing the application have diverse technicalcapabilities and team-styles. In particular, the team behaviour which is particularly helpfulto make rapid progress is a cohesive, flexible, responsive and can-do attitudeWe had several options of software packages to explore and develop this capability. The onewe chose had the required functionality, flexibility and ease of use to make progress veryquickly.Finally we caught the imagination of the organisation and individuals who have beenprepared to do something different, take action and to add value.
The key to increasing the uptake of ASAP is recognising that complex mathematics underpin the ASAP workflow. We need to combine kinetic models and humidity models to create a combined model with which we can make predictions. We then need a dashboard or interface that is easy to use by non -experts Stability protocol: practical experimentation
