Transcription
Budyko guide to exploring sustainability ofwater yields from catchments underchanging environmental conditionsIrena Creed and Adam SpargoWestern University, London, ON CANADA
And a consortium of catchmentscientists, including:USAMary Beth Adams (FER)Emery Boose (HFR)Eric Booth (NTL)John Campbell (HBR)Alan Covich (LUQ)David Clow (LVW)Clifford Dahm (SEV)Kelly Elder (FRA)Chelcy Ford (CWT)Nancy Grimm (CAP)Jeremy Jones (BNZ)Julia Jones (AND)Stephen Sebestyen (MAR)Mark Williams (NWT)Will Wolheim (PIE)Meryl Alber (GCE)John Blair (KNZ)William Bowden (ARC)Ward McCaughey (TEN)Teodora Minkova (OLY)Dan Reed (SBC)Leslie Reid (CAS)Phil Robertson (KBS)Jonathan Walsh (BES)CANADAFred Beall (TLW)Tom Clair (KEJ)Robin Pike (CAR)John Pomeroy (MRM)Patricia Ramlal (ELA)Rita Winkler (UPC)Huaxia Yao (DOR)2
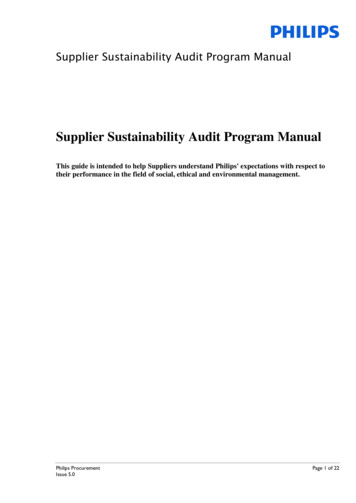
Budyko Curve describes the theoretical energyand water limits on the catchment water balance(P-ET Q).Budyko Curve provides a “business as usual”reference condition for the water balance.If we assume it depicts the expected partitioningof P into ET and Q,then we can begin to account for the reasonswhy sites depart from the baseline.Russian climatologist1920 –2001Can the Budyko Curve be used to identifycatchments undergoing shifts in water yields orat risk of undergoing these shifts?Budyko Curve3
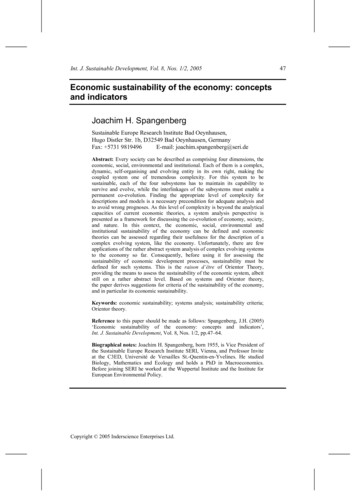
Water limit (AET P);a site cannot plot abovethe blue line unless thereis input of water beyondprecipitation.Energy limit (AET PET); asite cannot plot above thered line unlessprecipitation is being lostfrom the system by meansother than discharge.Budyko Curve4
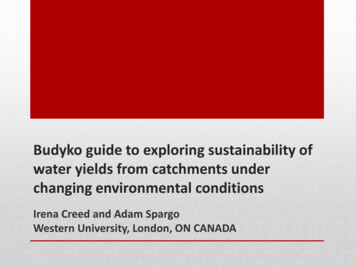
Energy limited (wet);AET is limited by the amount ofthermal energy that is available.Budyko CurveWater limited (dry);AET is limited by the amountof water that is available.5
Less runoffVERTICAL deviationsreflect a change in partitioningbetween ET and QWarmer, drierHORIZONTAL deviationsreflect a change in the climatic conditions(temperature, precipitation)Budyko Curve6
Network of catchments acrossNorth America Represent longest existing pairedrecords of meteorology andhydrology. Provide opportunity to exploreeffects of climate on water yieldsin headwaters Backdrop: P-PET (30-yr climatenormals, 1971 to 2000)North American Network7
(1) Under stationary conditions(naturally occurring oscillations),catchments will fall on the BudykoCurve.(2) Under non-stationary conditions(anthropogenic climate change),catchments will deviate from theBudyko Curve in a predictablemanner.Hypotheses8
Do the catchments fall on theBudyko Curve?9
Distribution of sites on Budyko Curve based on“common” 10 year period of dataBudyko CurveJones JA et al. (2012). Ecosystem processes and human influences regulate streamflow response toclimate change at long-term ecological research sites. BioScience 62: 390–404.10
Longterm Average AET/Pdeviation from the ARCLong term average deviation in AET/P(i.e., partitioning between ET and Q)0.40.30.20.10.0-0.2-0.3Deviations from Budyko Curve11
Reasons for falling off the Budyko Curve1.Inadequate representation of P and T (Loch Vale)2.Inadequate representation of ET (Andrews)3.Inadequate representation of Q (Marcell)4.Forest conversion (Coweeta)5.Forest disturbance (Luquillo)1. Today’s Focus: Response to changing climatic conditionsDeviations from Budyko Curve12
We assume that the BudykoCurve represents thereference condition for thetime period prior toanthropogenic climate changebeing detected in water yields.Climate related deviations:the “d” statistic13
For naturally occurring climateoscillations, the partitioningbetween ET and Q shouldmove up and down with theBudyko Curve.Climate related deviations:the “d” statistic14
If the partitioning between ETand Q moves away from theBudyko Curve,then this can be attributed toanthropogenic climatechange.Climate related deviations:the “d” statistic15
The “d” statistic, the deviationin AET/P due to climatechange, is calculated.Climate related deviations:the “d” statistic16
We know that not allcatchments fall on the BudykoCurve for reasons unrelated toclimate (i.e., o and ô on plot).We assume these offsets areconstant before and afterclimate change, and so thisterm becomes zero.Climate related deviations:the “d” statistic17
Negative d represents adownward shift and anincrease in Q (more wateryield).Positive d represents anupward shift an a decrease inQ (less water yield).Climate related deviations:the “d” statistic18
Can we identify catchment propertiesthat influence water yields?19
Spider plots showing year-to-year deviationsfrom long term averageInter-annual variation along Budyko CurveJones JA et al. (2012). Ecosystem processes and human influences regulate streamflow response toclimate change at long-term ecological research sites. BioScience 62: 390–404.20
Spider plots showing year-to-year deviationsfrom long term averageInter-annual variation along Budyko CurveJones JA et al. (2012). Ecosystem processes and human influences regulate streamflow response toclimate change at long-term ecological research sites. BioScience 62: 390–404.21
Responsivity ismeasured as themaximum range in AET/Pafter accounting fornatural deviation in theBudyko Curve.Pre climate change responsivity22
LOW RESPONSIVITYWater yields arenot synchronized to PHigh vs. low responsivityHIGH RESPONSIVITYWater yields aresynchronized to P23
PREDICTION #1:Larger deviations incatchments withhigher responsivity(catchments cannot bufferagainst climate change andwater yields strongly linkedto the atmosphere).Pre climate change responsivity vs. “d”24
Elasticity is measuredas the ratio of range ofPET/P to AETP/P.Pre climate change elasticity25
LOW ELASTICITY ( 1)small PET/P rangerelative to AET/P rangeHigh vs. low elasticityHIGH ELASTICITY ( 1)large PET/P rangerelative to AET/P range26
PREDICTION #2:Larger deviations incatchments withlower elasticity(catchments cannotacclimate/adapt tochanging climaticconditions)ElasticityPre climate change elasticity vs. “d”27
2.5Y 4.90x – 2.86R² 0.039P 0.07Elasticity2.01.51.00.50.00.50.60.7 0.8 0.9Responsivity1.0Responsivity does not imply elasticity28
Applying these metrics to testhypotheses29
Defining the onset ofanthropogenic climate change toidentify pre vs. post behaviorWang and Henjazi adopted a constant breakpoint (1970)to detect the effects of global environmental change onwater yields across USA30Wang D and M Hejazi. (2011). Quantifying the relative contribution of the climate and direct humanimpacts on mean annual streamflow in the contiguous United States. Water Resour. Res. 47: W00J12,doi:10.1029/2010WR010283.
Record length of P, ET (T)and Q data highlyvariable among thecatchmentsConstant breakpoint31
Record length of P, ET (T)and Q data highlyvariable among thecatchmentsA 1970 breakpointcaptures only 7headwater sites!Constant breakpoint32
Some sites observing net positive changes whileothers observing net negative changes.Constant breakpoint: pre vs. post changes33
0.080.060.060.040.040.020.020.000.00-0.08AND WS08AND WS02MRMHBR WS6HBR WS3CWT WS18-0.06FER WS4-0.04MAR S2-0.02d0.08MAR S5dPOSITIVE deviations (lower water yields) in coniferous forests andNEGATIVE deviations (higher water yields) in deciduous tant breakpoint: deviation (“d”)34
With Hubbard WS06Without Hubbard WS06PREDICTION #1Absolute value of d0.070.06y 0.12x - 0.06R² 0.39p 0.070.050.040.03y 0.12x - 0.05R² 0.850.000.020.010.000.000.50ResponsivityConstant breakpoint: responsivity vs. “d”1.0035
With Hubbard WS06Without Hubbard WS06ElasticityPREDICTION #2Absolute value of d0.070.060.05y 0.02x 0.02R² 0.48p 0.04y 0.01x 0.03R² 0.57p tant breakpoint: elasticity vs. “d”3.0036
Use AutoRegressive Integrated Moving Average technique to checkfor breakpoints at each year from 1960 to 2000 (Ford et al. 2006).1981No breakpointBreakpoint at 1981Variable breakpointFord CR, SH Laseter, WT Swank, JM Vose. (2011). Can forest management be used to sustain waterbased ecosystem services in the face of climate change? Ecological Applications 21: 2049–2067.37
Variable breakpointsallowed inclusion ofadditional sites (CAR,NTL), but also exclusion ofsites with no detectablebreakpoint (AND).Variable breakpoint38
Similar separation ofdeciduous (positive water yields) vs.coniferous (negative water yields)in the variable breakpoint analysis, except Carnation Creek.0.10MarmotCoweeta WS 17Coweeta WS18Hubbard WS6FernowMarcel S5Hubbard WS3-0.10Marcel WS2-0.05Carnationd0.00North temperate 0.05-0.15Variable breakpoint: deviation (“d”)39
Absolute value of d0.140.12With Carnation0.10Without CarnationLinear (With Carnation)0.08Linear (Without Carnation)y 0.07x - 0.01R² 0.05y 0.14x - 0.07R² 0.480.060.040.02PREDICTION #10.000.000.200.400.600.80ResponsivityVariable breakpoint: responsivity vs. “d”1.00401.20
0.14Without CarnationWith CarnationLinear (Without Carnation)Linear (With Carnation)Absolute value of d0.12ElasticityPREDICTION #20.100.08y 0.01x 0.03R² 0.06y 0.01x 0.01R² able breakpoint: elasticity vs. “d”4.005.00416.00
Constant vs. variable breakpointsSimilar relationships observed between responsivity and elasticityvs. absolute value of “d”.Variable breakpoint relationships reveal a “significant” outlier(Carnation Creek, BC).Need to delve further into the data to identify causes for thisoutlier – examine magnitude of temperature increase after thebreakpoint.Is the outlier key to our understanding?42
As temperature increases above 0, d increasesAverage increasein temperatureestimated byslope of line afterbreakpointRate of temperature increase vs. “d”43
As temperature increases above 0, d increasesAverage increasein temperatureestimated byslope of line afterbreakpointRate of temperature increase vs. “d”44
As temperature increases above 0, d increasesAverage increasein temperatureestimated byslope of line afterbreakpointRate of temperature increase vs. “d”45
Outlier: Carnation Creek, BC Western hemlock Largest “d” and highest rate ofanthropogenic climate change(2 C/decade)Is water yield of the outliercatchment at greater riskbecause its tree species is “at theedge” of its climate tolerance?Climatic ParameterParameter MeanParameter Range(min and max)Annual meantemperature5.13 C-4.66 to 12.93 CAnnual totalprecipitation1600 mm/year237 to 4196 mm/year46
Prior to anthropogenic climatechange, Carnation Creek fell atthe edge of the range ofWestern Hemlock.Maximum Range5th – 95th PercentileBaseline 1971 - 2000McKenney DW, et al. (2007). Potential impacts of climate change on the distribution of NorthAmerican trees. Bioscience 57: 939-948.47
Based on CGCM modelsimulations, the range ofWestern Hemlock will recedeon Vancouver Island.Maximum Range5th – 95th PercentileFirst 30 years, 2011 - 2040McKenney DW, et al. (2007). Potential impacts of climate change on the distribution of NorthAmerican trees. Bioscience 57: 939-948.48
Based on CGCM modelsimulations, the range ofWestern Hemlock will recedeon Vancouver Island.By mid 21st century, CarnationCreek will lie at the edge of themaximum range of WesternHemlock.Maximum Range5th – 95th PercentileSecond 30 years, 2041 - 2070McKenney DW, et al. (2007). Potential impacts of climate change on the distribution of NorthAmerican trees. Bioscience 57: 939-948.49
Based on CGCM modelsimulations, the range ofWestern Hemlock will recedeon Vancouver Island.By mid 21st century, CarnationCreek will lie at the edge of themaximum range of WesternHemlock.By end 21st century, CarnationCreek will lie outside themaximum range for WesternHemlock.Maximum Range5th – 95th PercentileThird 30 years, 2071 - 2100McKenney DW, et al. (2007). Potential impacts of climate change on the distribution of NorthAmerican trees. Bioscience 57: 939-948.50
Absolute value of dLARGE DEVIATIONSIN WATER YIELDSUnresponsiveinelasticShifting to alternativestable states? 2.0 deg C/yr 1.5 deg C/yr 1.0 deg C/yr 0.5 deg C/yrResponsivity and/or elasticitySMALL DEVIATIONSIN WATER YEILDSResponsiveElasticA better conceptual model ofclimate change effects on water yields51
NSERC Discovery Grant and Canada Research Chair Program “LTER Synthesis Workshops” funded by the LTER Network Office NSF LTER grants to participating USA sites USFS and USGS for initial establishment and continued support ofwatershed studies at many of the study sites NCE-SFM funded project on HydroEcological Landscapes andProcesses (HELP) and the participating Canadian sitesAcknowledgements52
53
Loch Vale (LVW):Failure to apply adiabatic lapse rate to meteorological data toaccount for orographic effects results in shift away from thecurve.Evaporative Index(AET/P)1.0Annual Raw DataAdiabatic Lapse Rate0.80.60.40.20.00.00.2 0.4 0.6 0.8Dryness Index (PET/P)1.0!(1) Inadequate representation of P, T54
HJ Andrews (HJA):Failure to consider net radiation, relative humidity and/or windspeed results in shift away from the curve.Evaporative 0.8Priestley-TaylorT, NR0.6PenmanMonteithT, NR, RH, WS0.4PET Penman-MonteithPET Hamon0.20.00.00.2 0.4 0.6 0.8Dryness Index (PET/P)1.0(2) Inadequate representation of ET55
Marcel (MAR):Failure to consider surface vs. groundwater losses ofprecipitaton.Evaporative Index(AET/P)1.00.80.60.4DischargeDischarge Groundwater0.20.00.00.2 0.4 0.6 0.8Dryness Index (PET/P)1.0(3) Inadequate representation of Q56
Coweeta (CWT):Conversion of forest from deciduous to coniferous forest resultsin shift away from the curve.Evaporative .00.2 0.4 0.6 0.8Dryness Index (PET/P)1.0(4) Forest management effects57
Luqillo (LUQ):Disturbance EffectsEvaporative Index(AET/P)1.0Before hurricane1-5yrs after hurricane 5yrs after hurricane0.80.60.40.20.00.00.2 0.4 0.6 0.8Dryness Index (PET/P)1.0(5) Natural disturbance effects58
Responsivity and elasticity were directly correlated toclimate related deviations from the Budyko Curve(among the catchments studied) Catchments where P and Q are synchronised catchmentsare more sensitive to climate change, that is they aretightly coupled with the atmosphere.Constant breakpoint findings59
Ford CR, SH Laseter, WT Swank, JM Vose. (2011). Can forest management be used to sustain water-based ecosystem services in the face of climate change? Ecological Applications 21: 2049-2067. Variable breakpoint Use AutoRegressive Integrated Moving Average technique to check for breakpoints at each year from 1960 to 2000 (Ford et al. 2006).